
Key Insights
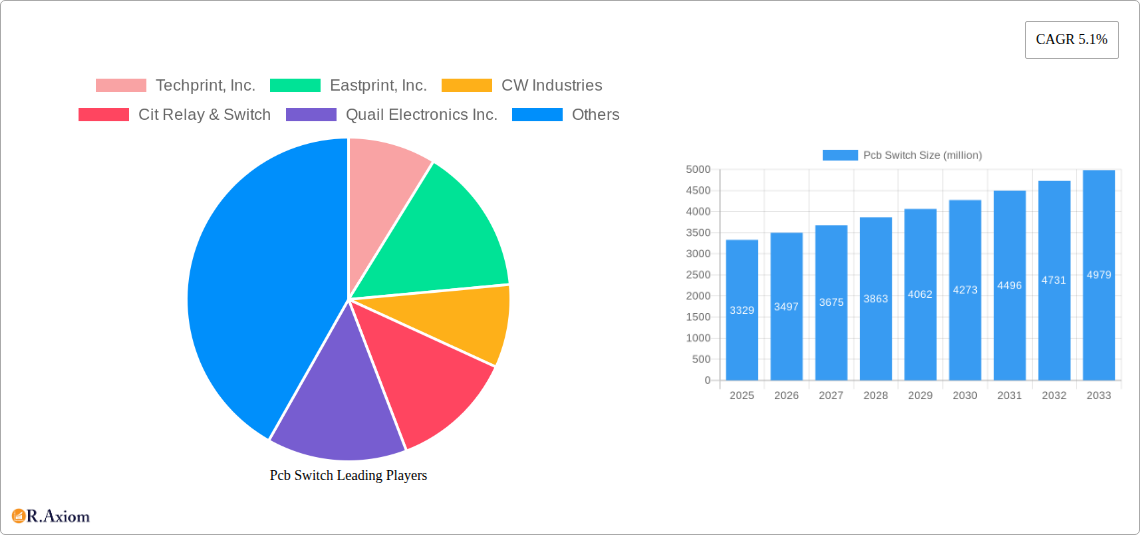
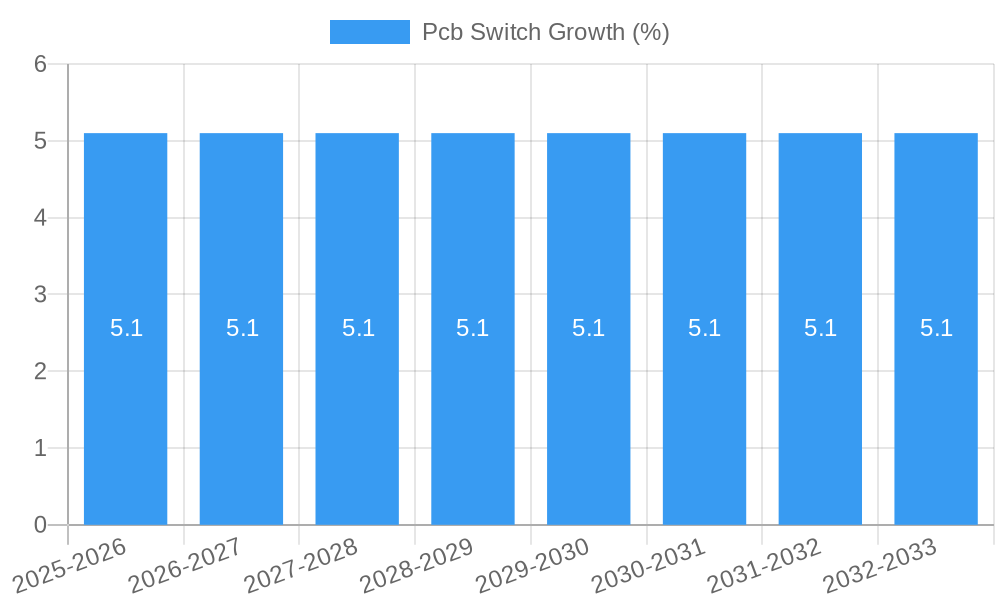
The Printed Circuit Board (PCB) switch market is poised for robust expansion, projected to reach approximately USD 3,329 million by 2025, with a Compound Annual Growth Rate (CAGR) of 5.1% anticipated to continue through 2033. This steady growth is primarily fueled by the escalating demand across the consumer electronics sector, driven by the proliferation of smart devices, wearables, and home automation systems. The increasing complexity and miniaturization of electronic components necessitate reliable and compact switching solutions, making PCB switches indispensable. Furthermore, the industrial equipment segment is a significant contributor, as advancements in automation, robotics, and the Industrial Internet of Things (IIoT) demand sophisticated control and signaling mechanisms. The rising adoption of 5G technology and the development of advanced telecommunications infrastructure also present substantial opportunities for PCB switch manufacturers.
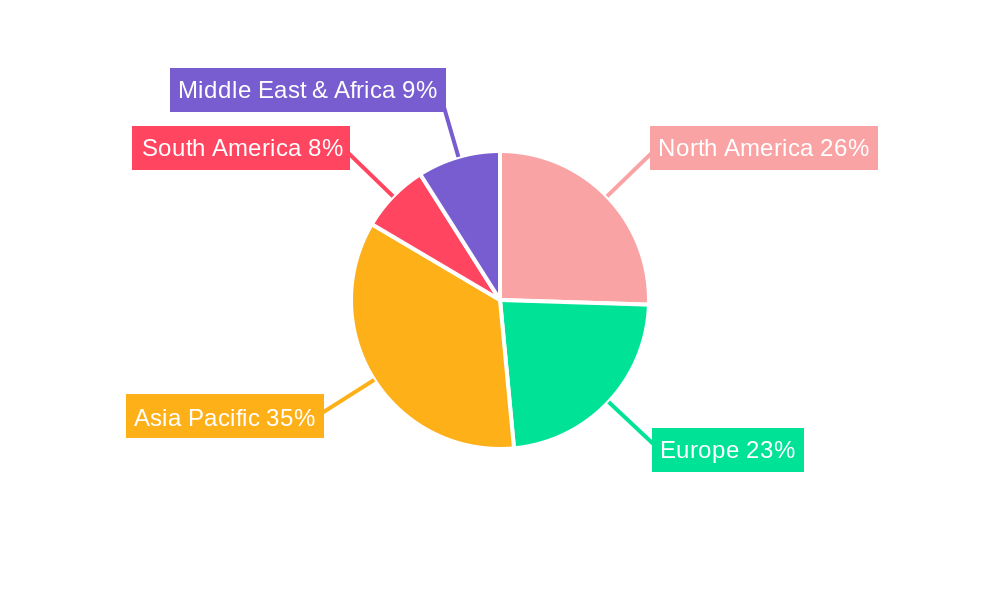
The market is characterized by a dynamic interplay of innovation and evolving industry requirements. The prevalent types of PCB switches include Normal Open (NO) and Normal Close (NC) configurations, each catering to specific functional needs. Normal Open switches, which are in an open circuit state until actuated, are widely used in applications requiring an "on-off" function upon user interaction or signal detection. Conversely, Normal Close switches, remaining in a closed circuit state until actuated, are critical for safety mechanisms, emergency stop functions, and preventing unintended operations. The competitive landscape is populated by a diverse range of companies, from established global players like TE Connectivity and SCHURTER to specialized manufacturers, all vying for market share through product innovation, strategic partnerships, and geographical expansion. Asia Pacific is expected to emerge as a dominant region due to its extensive manufacturing base and burgeoning consumer electronics market, while North America and Europe will remain significant markets driven by technological advancements and industrial modernization.
This in-depth report provides a panoramic view of the global PCB switch market, offering crucial insights for industry stakeholders. Spanning a comprehensive study period of 2019–2033, with a base year of 2025 and an estimated year also in 2025, the report meticulously analyzes historical data from 2019–2024 and projects future trends through the forecast period of 2025–2033. We delve into market dynamics, technological advancements, application-specific trends in Consumer Electronics, Industrial Equipment, and Others, and the intricate landscape of Normal Open Switch and Normal Close Switch types. This report is designed for immediate utilization without requiring any further modifications, ensuring actionable intelligence for strategic decision-making in the rapidly evolving PCB switch industry.
Pcb Switch Market Concentration & Innovation
The global PCB switch market exhibits a moderate level of concentration, with leading manufacturers like SCHURTER, Würth Elektronik, and TE Connectivity holding significant market shares, estimated to be over XX million USD each. Innovation is a key differentiator, driven by the demand for miniaturization, enhanced durability, and specialized functionalities across diverse applications. Emerging technologies such as advanced materials and smart switch integration are at the forefront of product development. Regulatory frameworks, particularly those concerning environmental compliance (e.g., RoHS, REACH) and product safety standards, significantly influence manufacturing processes and market entry. While direct product substitutes are limited, alternative switching mechanisms and integrated circuit solutions pose indirect competitive pressures. End-user trends indicate a growing preference for high-performance, low-power consumption PCB switches in Consumer Electronics and robust, reliable solutions in Industrial Equipment. Merger and acquisition (M&A) activities are expected to continue, with an estimated deal value of over XX million USD in the historical period, consolidating market share and expanding technological capabilities.
Pcb Switch Industry Trends & Insights
The PCB switch industry is experiencing robust growth, propelled by an escalating demand for electronic devices across virtually every sector. The market is projected to witness a significant Compound Annual Growth Rate (CAGR) of over XX% during the forecast period. This growth is primarily fueled by the relentless expansion of the Consumer Electronics sector, encompassing smartphones, wearables, smart home devices, and gaming consoles, all of which rely heavily on intricate PCB switch components for user interaction and operational control. Similarly, the Industrial Equipment segment, including automation machinery, medical devices, and telecommunications infrastructure, continues to be a major revenue generator. The increasing adoption of the Internet of Things (IoT) is a transformative trend, driving the need for an ever-greater number of interconnected devices, each requiring reliable PCB switches. Technological disruptions, such as the advent of silent switches, touch-sensitive switches, and switches with integrated diagnostic capabilities, are reshaping product offerings and creating new market niches. Consumer preferences are leaning towards compact, energy-efficient, and aesthetically pleasing PCB switches, particularly within the Consumer Electronics domain. The competitive dynamics are characterized by a blend of established players and agile new entrants, all vying for market share through product innovation, strategic partnerships, and competitive pricing. Market penetration is steadily increasing globally, as more economies embrace digital transformation and electronic integration into daily life.
Dominant Markets & Segments in Pcb Switch
The PCB switch market is characterized by distinct regional dominance and segment leadership, driven by a confluence of economic policies, infrastructure development, and technological adoption rates.
Leading Region: Asia Pacific
- Economic Policies: Favorable government initiatives promoting electronics manufacturing, R&D investments, and export-oriented policies have cemented Asia Pacific's position as the manufacturing hub for PCB switches.
- Infrastructure Development: Extensive investments in digital infrastructure and the proliferation of high-speed internet facilitate the widespread adoption of electronic devices, thereby driving demand.
- Technological Adoption: The region's large population and rapid urbanization contribute to a high adoption rate of advanced consumer electronics and industrial automation.
Dominant Application Segment: Consumer Electronics
- Market Size: This segment accounts for the largest share of the PCB switch market, estimated to be over XX million USD in the base year.
- Growth Drivers: The incessant demand for smartphones, tablets, laptops, smartwatches, gaming consoles, and home appliances fuels this segment's expansion. Miniaturization and user experience enhancement are key drivers for PCB switch innovation here.
- Consumer Preferences: Consumers seek compact, aesthetically pleasing, and feature-rich devices, necessitating sophisticated and reliable PCB switches.
Dominant Type Segment: Normal Open Switch
- Market Penetration: Normal Open Switches are ubiquitous, found in a vast array of applications where an electrical circuit needs to be completed upon activation.
- Application Breadth: They are integral to power buttons, control mechanisms in appliances, and signaling systems across both consumer and industrial sectors. Their simplicity and reliability make them a default choice in many designs.
- Technological Advancements: Innovations in materials and sealing techniques are enhancing their durability and performance in harsh environments, further solidifying their market position.
Other Significant Segments:
- Industrial Equipment: This segment, while smaller than consumer electronics, represents a high-value market due to the stringent reliability and durability requirements of machinery, automation systems, and medical devices. The trend towards Industry 4.0 and smart manufacturing directly benefits PCB switch demand in this sector.
- Normal Close Switch: While less prevalent than Normal Open Switches, Normal Close Switches are crucial in applications requiring default on states or safety interlocks, such as emergency stop buttons and security systems.
Pcb Switch Product Developments
The PCB switch market is abuzz with product developments focused on enhancing performance, reducing size, and integrating advanced functionalities. Innovations include low-profile, high-cycle life tactile switches for portable devices, sealed and ruggedized switches for harsh industrial environments, and intelligent switches with embedded sensing capabilities for IoT applications. These developments offer competitive advantages by enabling smaller device footprints, improved user interaction, extended product lifespans, and greater system integration, directly addressing evolving market demands.
Report Scope & Segmentation Analysis
This report provides a granular analysis of the PCB switch market, segmented by Application and Type.
Application Segmentation:
- Consumer Electronics: This segment, estimated at XX million USD in 2025, is projected to grow at a CAGR of XX% during the forecast period. It encompasses a wide array of products, from smartphones to smart home devices, demanding compact and reliable PCB switches.
- Industrial Equipment: Valued at XX million USD in 2025, this segment is expected to grow at a CAGR of XX%. It serves sectors like automation, medical, and telecommunications, requiring high durability and specialized functionalities in PCB switches.
- Others: This segment, comprising automotive, aerospace, and defense applications, is estimated at XX million USD in 2025, with a projected CAGR of XX%. It presents unique demands for robust and high-performance PCB switches.
Type Segmentation:
- Normal Open Switch: As the dominant type, this segment, valued at XX million USD in 2025, is forecast to grow at XX%. It is essential for initiating functions across all application areas.
- Normal Close Switch: This segment, estimated at XX million USD in 2025, is projected to grow at XX%. It plays a critical role in safety and default operational states.
Key Drivers of Pcb Switch Growth
The growth of the PCB switch market is propelled by several key factors. The accelerating digitalization across industries, from manufacturing to healthcare, drives the demand for electronic components, including PCB switches. The burgeoning Consumer Electronics market, fueled by new product launches and evolving consumer lifestyles, is a significant contributor. The increasing adoption of automation and the Industrial Internet of Things (IIoT) necessitates highly reliable and advanced PCB switches for seamless operation and control. Furthermore, technological advancements in switch design, such as miniaturization and improved durability, enable their integration into a wider range of devices and applications.
Challenges in the Pcb Switch Sector
Despite its growth trajectory, the PCB switch sector faces several challenges. Intense competition among manufacturers, both domestic and international, can lead to price erosion and reduced profit margins. Fluctuations in raw material costs, particularly for metals and plastics, can impact manufacturing expenses. Evolving environmental regulations and the need for sustainable manufacturing practices add complexity and cost to production. Additionally, supply chain disruptions, as experienced in recent years, can affect the availability and delivery of components, impacting production schedules and market responsiveness.
Emerging Opportunities in Pcb Switch
The PCB switch market is ripe with emerging opportunities. The rapid expansion of the electric vehicle (EV) market presents a substantial opportunity for high-reliability PCB switches in battery management systems, charging infrastructure, and in-car electronics. The growing demand for smart home devices and wearable technology continues to fuel innovation in compact and energy-efficient PCB switches. The increasing focus on medical device miniaturization and advanced diagnostics also opens new avenues for specialized PCB switches. Furthermore, the ongoing development of 5G technology and its widespread implementation will necessitate a vast network of connected devices, each requiring robust PCB switch components.
Leading Players in the Pcb Switch Market
- Techprint, Inc.
- Eastprint, Inc.
- CW Industries
- Cit Relay & Switch
- Quail Electronics Inc.
- Marsh Electronics, Inc.
- SCHURTER
- Würth Elektronik
- TE Connectivity
- EAO Corporation
- Apem
- NIDEC COPAL ELECTRONICS
- Mod-Tronic Instruments Limited
- PUI - Projections Unlimited, Inc.
- ADI American Distributors LLC
- PCBMay
- TinyTronics B.V.
Key Developments in Pcb Switch Industry
- 2023: SCHURTER introduces a new series of ultra-compact SMD tactile switches designed for high-density applications in consumer electronics, enhancing product miniaturization capabilities.
- 2023: TE Connectivity announces the expansion of its automotive-grade PCB switch portfolio, focusing on increased resistance to vibration and extreme temperatures for enhanced reliability in vehicle systems.
- 2024: Würth Elektronik launches a range of environmentally friendly, lead-free PCB switches, aligning with growing global sustainability initiatives and regulatory demands.
- 2024: CW Industries unveils advanced through-hole PCB switches with extended operational life cycles, catering to the growing demand for durable components in industrial automation equipment.
- 2024: Apem showcases innovative haptic feedback switches for gaming peripherals, enhancing user experience and creating a competitive edge in the entertainment electronics segment.
Strategic Outlook for Pcb Switch Market
The strategic outlook for the PCB switch market is exceptionally positive, driven by ongoing technological advancements and the pervasive integration of electronics across all facets of modern life. The persistent demand from the Consumer Electronics and Industrial Equipment sectors, coupled with the emerging opportunities in the electric vehicle and IoT markets, paints a picture of sustained growth. Companies that focus on innovation, particularly in areas of miniaturization, enhanced performance, and smart functionalities, alongside a commitment to sustainability and robust supply chain management, will be well-positioned to capitalize on future market potential and achieve strategic success.
Pcb Switch Segmentation
-
1. Application
- 1.1. Consumer Electronics
- 1.2. Industrial Equipment
- 1.3. Others
-
2. Type
- 2.1. Normal Open Switch
- 2.2. Normal Close Switch
Pcb Switch Segmentation By Geography
-
1. North America
- 1.1. United States
- 1.2. Canada
- 1.3. Mexico
-
2. South America
- 2.1. Brazil
- 2.2. Argentina
- 2.3. Rest of South America
-
3. Europe
- 3.1. United Kingdom
- 3.2. Germany
- 3.3. France
- 3.4. Italy
- 3.5. Spain
- 3.6. Russia
- 3.7. Benelux
- 3.8. Nordics
- 3.9. Rest of Europe
-
4. Middle East & Africa
- 4.1. Turkey
- 4.2. Israel
- 4.3. GCC
- 4.4. North Africa
- 4.5. South Africa
- 4.6. Rest of Middle East & Africa
-
5. Asia Pacific
- 5.1. China
- 5.2. India
- 5.3. Japan
- 5.4. South Korea
- 5.5. ASEAN
- 5.6. Oceania
- 5.7. Rest of Asia Pacific
Pcb Switch REPORT HIGHLIGHTS
| Aspects | Details |
|---|---|
| Study Period | 2019-2033 |
| Base Year | 2024 |
| Estimated Year | 2025 |
| Forecast Period | 2025-2033 |
| Historical Period | 2019-2024 |
| Growth Rate | CAGR of 5.1% from 2019-2033 |
| Segmentation |
|
Table of Contents
- 1. Introduction
- 1.1. Research Scope
- 1.2. Market Segmentation
- 1.3. Research Methodology
- 1.4. Definitions and Assumptions
- 2. Executive Summary
- 2.1. Introduction
- 3. Market Dynamics
- 3.1. Introduction
- 3.2. Market Drivers
- 3.3. Market Restrains
- 3.4. Market Trends
- 4. Market Factor Analysis
- 4.1. Porters Five Forces
- 4.2. Supply/Value Chain
- 4.3. PESTEL analysis
- 4.4. Market Entropy
- 4.5. Patent/Trademark Analysis
- 5. Global Pcb Switch Analysis, Insights and Forecast, 2019-2031
- 5.1. Market Analysis, Insights and Forecast - by Application
- 5.1.1. Consumer Electronics
- 5.1.2. Industrial Equipment
- 5.1.3. Others
- 5.2. Market Analysis, Insights and Forecast - by Type
- 5.2.1. Normal Open Switch
- 5.2.2. Normal Close Switch
- 5.3. Market Analysis, Insights and Forecast - by Region
- 5.3.1. North America
- 5.3.2. South America
- 5.3.3. Europe
- 5.3.4. Middle East & Africa
- 5.3.5. Asia Pacific
- 5.1. Market Analysis, Insights and Forecast - by Application
- 6. North America Pcb Switch Analysis, Insights and Forecast, 2019-2031
- 6.1. Market Analysis, Insights and Forecast - by Application
- 6.1.1. Consumer Electronics
- 6.1.2. Industrial Equipment
- 6.1.3. Others
- 6.2. Market Analysis, Insights and Forecast - by Type
- 6.2.1. Normal Open Switch
- 6.2.2. Normal Close Switch
- 6.1. Market Analysis, Insights and Forecast - by Application
- 7. South America Pcb Switch Analysis, Insights and Forecast, 2019-2031
- 7.1. Market Analysis, Insights and Forecast - by Application
- 7.1.1. Consumer Electronics
- 7.1.2. Industrial Equipment
- 7.1.3. Others
- 7.2. Market Analysis, Insights and Forecast - by Type
- 7.2.1. Normal Open Switch
- 7.2.2. Normal Close Switch
- 7.1. Market Analysis, Insights and Forecast - by Application
- 8. Europe Pcb Switch Analysis, Insights and Forecast, 2019-2031
- 8.1. Market Analysis, Insights and Forecast - by Application
- 8.1.1. Consumer Electronics
- 8.1.2. Industrial Equipment
- 8.1.3. Others
- 8.2. Market Analysis, Insights and Forecast - by Type
- 8.2.1. Normal Open Switch
- 8.2.2. Normal Close Switch
- 8.1. Market Analysis, Insights and Forecast - by Application
- 9. Middle East & Africa Pcb Switch Analysis, Insights and Forecast, 2019-2031
- 9.1. Market Analysis, Insights and Forecast - by Application
- 9.1.1. Consumer Electronics
- 9.1.2. Industrial Equipment
- 9.1.3. Others
- 9.2. Market Analysis, Insights and Forecast - by Type
- 9.2.1. Normal Open Switch
- 9.2.2. Normal Close Switch
- 9.1. Market Analysis, Insights and Forecast - by Application
- 10. Asia Pacific Pcb Switch Analysis, Insights and Forecast, 2019-2031
- 10.1. Market Analysis, Insights and Forecast - by Application
- 10.1.1. Consumer Electronics
- 10.1.2. Industrial Equipment
- 10.1.3. Others
- 10.2. Market Analysis, Insights and Forecast - by Type
- 10.2.1. Normal Open Switch
- 10.2.2. Normal Close Switch
- 10.1. Market Analysis, Insights and Forecast - by Application
- 11. Competitive Analysis
- 11.1. Global Market Share Analysis 2024
- 11.2. Company Profiles
- 11.2.1 Techprint Inc.
- 11.2.1.1. Overview
- 11.2.1.2. Products
- 11.2.1.3. SWOT Analysis
- 11.2.1.4. Recent Developments
- 11.2.1.5. Financials (Based on Availability)
- 11.2.2 Eastprint Inc.
- 11.2.2.1. Overview
- 11.2.2.2. Products
- 11.2.2.3. SWOT Analysis
- 11.2.2.4. Recent Developments
- 11.2.2.5. Financials (Based on Availability)
- 11.2.3 CW Industries
- 11.2.3.1. Overview
- 11.2.3.2. Products
- 11.2.3.3. SWOT Analysis
- 11.2.3.4. Recent Developments
- 11.2.3.5. Financials (Based on Availability)
- 11.2.4 Cit Relay & Switch
- 11.2.4.1. Overview
- 11.2.4.2. Products
- 11.2.4.3. SWOT Analysis
- 11.2.4.4. Recent Developments
- 11.2.4.5. Financials (Based on Availability)
- 11.2.5 Quail Electronics Inc.
- 11.2.5.1. Overview
- 11.2.5.2. Products
- 11.2.5.3. SWOT Analysis
- 11.2.5.4. Recent Developments
- 11.2.5.5. Financials (Based on Availability)
- 11.2.6 Marsh Electronics Inc.
- 11.2.6.1. Overview
- 11.2.6.2. Products
- 11.2.6.3. SWOT Analysis
- 11.2.6.4. Recent Developments
- 11.2.6.5. Financials (Based on Availability)
- 11.2.7 SCHURTER
- 11.2.7.1. Overview
- 11.2.7.2. Products
- 11.2.7.3. SWOT Analysis
- 11.2.7.4. Recent Developments
- 11.2.7.5. Financials (Based on Availability)
- 11.2.8 Würth Elektronik
- 11.2.8.1. Overview
- 11.2.8.2. Products
- 11.2.8.3. SWOT Analysis
- 11.2.8.4. Recent Developments
- 11.2.8.5. Financials (Based on Availability)
- 11.2.9 TE Connectivity
- 11.2.9.1. Overview
- 11.2.9.2. Products
- 11.2.9.3. SWOT Analysis
- 11.2.9.4. Recent Developments
- 11.2.9.5. Financials (Based on Availability)
- 11.2.10 EAO Corporation
- 11.2.10.1. Overview
- 11.2.10.2. Products
- 11.2.10.3. SWOT Analysis
- 11.2.10.4. Recent Developments
- 11.2.10.5. Financials (Based on Availability)
- 11.2.11 Apem
- 11.2.11.1. Overview
- 11.2.11.2. Products
- 11.2.11.3. SWOT Analysis
- 11.2.11.4. Recent Developments
- 11.2.11.5. Financials (Based on Availability)
- 11.2.12 NIDEC COPAL ELECTRONICS
- 11.2.12.1. Overview
- 11.2.12.2. Products
- 11.2.12.3. SWOT Analysis
- 11.2.12.4. Recent Developments
- 11.2.12.5. Financials (Based on Availability)
- 11.2.13 Mod-Tronic Instruments Limited
- 11.2.13.1. Overview
- 11.2.13.2. Products
- 11.2.13.3. SWOT Analysis
- 11.2.13.4. Recent Developments
- 11.2.13.5. Financials (Based on Availability)
- 11.2.14 PUI - Projections Unlimited Inc.
- 11.2.14.1. Overview
- 11.2.14.2. Products
- 11.2.14.3. SWOT Analysis
- 11.2.14.4. Recent Developments
- 11.2.14.5. Financials (Based on Availability)
- 11.2.15 ADI American Distributors LLC
- 11.2.15.1. Overview
- 11.2.15.2. Products
- 11.2.15.3. SWOT Analysis
- 11.2.15.4. Recent Developments
- 11.2.15.5. Financials (Based on Availability)
- 11.2.16 PCBMay
- 11.2.16.1. Overview
- 11.2.16.2. Products
- 11.2.16.3. SWOT Analysis
- 11.2.16.4. Recent Developments
- 11.2.16.5. Financials (Based on Availability)
- 11.2.17 TinyTronics B.V.
- 11.2.17.1. Overview
- 11.2.17.2. Products
- 11.2.17.3. SWOT Analysis
- 11.2.17.4. Recent Developments
- 11.2.17.5. Financials (Based on Availability)
- 11.2.1 Techprint Inc.
List of Figures
- Figure 1: Global Pcb Switch Revenue Breakdown (million, %) by Region 2024 & 2032
- Figure 2: Global Pcb Switch Volume Breakdown (K, %) by Region 2024 & 2032
- Figure 3: North America Pcb Switch Revenue (million), by Application 2024 & 2032
- Figure 4: North America Pcb Switch Volume (K), by Application 2024 & 2032
- Figure 5: North America Pcb Switch Revenue Share (%), by Application 2024 & 2032
- Figure 6: North America Pcb Switch Volume Share (%), by Application 2024 & 2032
- Figure 7: North America Pcb Switch Revenue (million), by Type 2024 & 2032
- Figure 8: North America Pcb Switch Volume (K), by Type 2024 & 2032
- Figure 9: North America Pcb Switch Revenue Share (%), by Type 2024 & 2032
- Figure 10: North America Pcb Switch Volume Share (%), by Type 2024 & 2032
- Figure 11: North America Pcb Switch Revenue (million), by Country 2024 & 2032
- Figure 12: North America Pcb Switch Volume (K), by Country 2024 & 2032
- Figure 13: North America Pcb Switch Revenue Share (%), by Country 2024 & 2032
- Figure 14: North America Pcb Switch Volume Share (%), by Country 2024 & 2032
- Figure 15: South America Pcb Switch Revenue (million), by Application 2024 & 2032
- Figure 16: South America Pcb Switch Volume (K), by Application 2024 & 2032
- Figure 17: South America Pcb Switch Revenue Share (%), by Application 2024 & 2032
- Figure 18: South America Pcb Switch Volume Share (%), by Application 2024 & 2032
- Figure 19: South America Pcb Switch Revenue (million), by Type 2024 & 2032
- Figure 20: South America Pcb Switch Volume (K), by Type 2024 & 2032
- Figure 21: South America Pcb Switch Revenue Share (%), by Type 2024 & 2032
- Figure 22: South America Pcb Switch Volume Share (%), by Type 2024 & 2032
- Figure 23: South America Pcb Switch Revenue (million), by Country 2024 & 2032
- Figure 24: South America Pcb Switch Volume (K), by Country 2024 & 2032
- Figure 25: South America Pcb Switch Revenue Share (%), by Country 2024 & 2032
- Figure 26: South America Pcb Switch Volume Share (%), by Country 2024 & 2032
- Figure 27: Europe Pcb Switch Revenue (million), by Application 2024 & 2032
- Figure 28: Europe Pcb Switch Volume (K), by Application 2024 & 2032
- Figure 29: Europe Pcb Switch Revenue Share (%), by Application 2024 & 2032
- Figure 30: Europe Pcb Switch Volume Share (%), by Application 2024 & 2032
- Figure 31: Europe Pcb Switch Revenue (million), by Type 2024 & 2032
- Figure 32: Europe Pcb Switch Volume (K), by Type 2024 & 2032
- Figure 33: Europe Pcb Switch Revenue Share (%), by Type 2024 & 2032
- Figure 34: Europe Pcb Switch Volume Share (%), by Type 2024 & 2032
- Figure 35: Europe Pcb Switch Revenue (million), by Country 2024 & 2032
- Figure 36: Europe Pcb Switch Volume (K), by Country 2024 & 2032
- Figure 37: Europe Pcb Switch Revenue Share (%), by Country 2024 & 2032
- Figure 38: Europe Pcb Switch Volume Share (%), by Country 2024 & 2032
- Figure 39: Middle East & Africa Pcb Switch Revenue (million), by Application 2024 & 2032
- Figure 40: Middle East & Africa Pcb Switch Volume (K), by Application 2024 & 2032
- Figure 41: Middle East & Africa Pcb Switch Revenue Share (%), by Application 2024 & 2032
- Figure 42: Middle East & Africa Pcb Switch Volume Share (%), by Application 2024 & 2032
- Figure 43: Middle East & Africa Pcb Switch Revenue (million), by Type 2024 & 2032
- Figure 44: Middle East & Africa Pcb Switch Volume (K), by Type 2024 & 2032
- Figure 45: Middle East & Africa Pcb Switch Revenue Share (%), by Type 2024 & 2032
- Figure 46: Middle East & Africa Pcb Switch Volume Share (%), by Type 2024 & 2032
- Figure 47: Middle East & Africa Pcb Switch Revenue (million), by Country 2024 & 2032
- Figure 48: Middle East & Africa Pcb Switch Volume (K), by Country 2024 & 2032
- Figure 49: Middle East & Africa Pcb Switch Revenue Share (%), by Country 2024 & 2032
- Figure 50: Middle East & Africa Pcb Switch Volume Share (%), by Country 2024 & 2032
- Figure 51: Asia Pacific Pcb Switch Revenue (million), by Application 2024 & 2032
- Figure 52: Asia Pacific Pcb Switch Volume (K), by Application 2024 & 2032
- Figure 53: Asia Pacific Pcb Switch Revenue Share (%), by Application 2024 & 2032
- Figure 54: Asia Pacific Pcb Switch Volume Share (%), by Application 2024 & 2032
- Figure 55: Asia Pacific Pcb Switch Revenue (million), by Type 2024 & 2032
- Figure 56: Asia Pacific Pcb Switch Volume (K), by Type 2024 & 2032
- Figure 57: Asia Pacific Pcb Switch Revenue Share (%), by Type 2024 & 2032
- Figure 58: Asia Pacific Pcb Switch Volume Share (%), by Type 2024 & 2032
- Figure 59: Asia Pacific Pcb Switch Revenue (million), by Country 2024 & 2032
- Figure 60: Asia Pacific Pcb Switch Volume (K), by Country 2024 & 2032
- Figure 61: Asia Pacific Pcb Switch Revenue Share (%), by Country 2024 & 2032
- Figure 62: Asia Pacific Pcb Switch Volume Share (%), by Country 2024 & 2032
List of Tables
- Table 1: Global Pcb Switch Revenue million Forecast, by Region 2019 & 2032
- Table 2: Global Pcb Switch Volume K Forecast, by Region 2019 & 2032
- Table 3: Global Pcb Switch Revenue million Forecast, by Application 2019 & 2032
- Table 4: Global Pcb Switch Volume K Forecast, by Application 2019 & 2032
- Table 5: Global Pcb Switch Revenue million Forecast, by Type 2019 & 2032
- Table 6: Global Pcb Switch Volume K Forecast, by Type 2019 & 2032
- Table 7: Global Pcb Switch Revenue million Forecast, by Region 2019 & 2032
- Table 8: Global Pcb Switch Volume K Forecast, by Region 2019 & 2032
- Table 9: Global Pcb Switch Revenue million Forecast, by Application 2019 & 2032
- Table 10: Global Pcb Switch Volume K Forecast, by Application 2019 & 2032
- Table 11: Global Pcb Switch Revenue million Forecast, by Type 2019 & 2032
- Table 12: Global Pcb Switch Volume K Forecast, by Type 2019 & 2032
- Table 13: Global Pcb Switch Revenue million Forecast, by Country 2019 & 2032
- Table 14: Global Pcb Switch Volume K Forecast, by Country 2019 & 2032
- Table 15: United States Pcb Switch Revenue (million) Forecast, by Application 2019 & 2032
- Table 16: United States Pcb Switch Volume (K) Forecast, by Application 2019 & 2032
- Table 17: Canada Pcb Switch Revenue (million) Forecast, by Application 2019 & 2032
- Table 18: Canada Pcb Switch Volume (K) Forecast, by Application 2019 & 2032
- Table 19: Mexico Pcb Switch Revenue (million) Forecast, by Application 2019 & 2032
- Table 20: Mexico Pcb Switch Volume (K) Forecast, by Application 2019 & 2032
- Table 21: Global Pcb Switch Revenue million Forecast, by Application 2019 & 2032
- Table 22: Global Pcb Switch Volume K Forecast, by Application 2019 & 2032
- Table 23: Global Pcb Switch Revenue million Forecast, by Type 2019 & 2032
- Table 24: Global Pcb Switch Volume K Forecast, by Type 2019 & 2032
- Table 25: Global Pcb Switch Revenue million Forecast, by Country 2019 & 2032
- Table 26: Global Pcb Switch Volume K Forecast, by Country 2019 & 2032
- Table 27: Brazil Pcb Switch Revenue (million) Forecast, by Application 2019 & 2032
- Table 28: Brazil Pcb Switch Volume (K) Forecast, by Application 2019 & 2032
- Table 29: Argentina Pcb Switch Revenue (million) Forecast, by Application 2019 & 2032
- Table 30: Argentina Pcb Switch Volume (K) Forecast, by Application 2019 & 2032
- Table 31: Rest of South America Pcb Switch Revenue (million) Forecast, by Application 2019 & 2032
- Table 32: Rest of South America Pcb Switch Volume (K) Forecast, by Application 2019 & 2032
- Table 33: Global Pcb Switch Revenue million Forecast, by Application 2019 & 2032
- Table 34: Global Pcb Switch Volume K Forecast, by Application 2019 & 2032
- Table 35: Global Pcb Switch Revenue million Forecast, by Type 2019 & 2032
- Table 36: Global Pcb Switch Volume K Forecast, by Type 2019 & 2032
- Table 37: Global Pcb Switch Revenue million Forecast, by Country 2019 & 2032
- Table 38: Global Pcb Switch Volume K Forecast, by Country 2019 & 2032
- Table 39: United Kingdom Pcb Switch Revenue (million) Forecast, by Application 2019 & 2032
- Table 40: United Kingdom Pcb Switch Volume (K) Forecast, by Application 2019 & 2032
- Table 41: Germany Pcb Switch Revenue (million) Forecast, by Application 2019 & 2032
- Table 42: Germany Pcb Switch Volume (K) Forecast, by Application 2019 & 2032
- Table 43: France Pcb Switch Revenue (million) Forecast, by Application 2019 & 2032
- Table 44: France Pcb Switch Volume (K) Forecast, by Application 2019 & 2032
- Table 45: Italy Pcb Switch Revenue (million) Forecast, by Application 2019 & 2032
- Table 46: Italy Pcb Switch Volume (K) Forecast, by Application 2019 & 2032
- Table 47: Spain Pcb Switch Revenue (million) Forecast, by Application 2019 & 2032
- Table 48: Spain Pcb Switch Volume (K) Forecast, by Application 2019 & 2032
- Table 49: Russia Pcb Switch Revenue (million) Forecast, by Application 2019 & 2032
- Table 50: Russia Pcb Switch Volume (K) Forecast, by Application 2019 & 2032
- Table 51: Benelux Pcb Switch Revenue (million) Forecast, by Application 2019 & 2032
- Table 52: Benelux Pcb Switch Volume (K) Forecast, by Application 2019 & 2032
- Table 53: Nordics Pcb Switch Revenue (million) Forecast, by Application 2019 & 2032
- Table 54: Nordics Pcb Switch Volume (K) Forecast, by Application 2019 & 2032
- Table 55: Rest of Europe Pcb Switch Revenue (million) Forecast, by Application 2019 & 2032
- Table 56: Rest of Europe Pcb Switch Volume (K) Forecast, by Application 2019 & 2032
- Table 57: Global Pcb Switch Revenue million Forecast, by Application 2019 & 2032
- Table 58: Global Pcb Switch Volume K Forecast, by Application 2019 & 2032
- Table 59: Global Pcb Switch Revenue million Forecast, by Type 2019 & 2032
- Table 60: Global Pcb Switch Volume K Forecast, by Type 2019 & 2032
- Table 61: Global Pcb Switch Revenue million Forecast, by Country 2019 & 2032
- Table 62: Global Pcb Switch Volume K Forecast, by Country 2019 & 2032
- Table 63: Turkey Pcb Switch Revenue (million) Forecast, by Application 2019 & 2032
- Table 64: Turkey Pcb Switch Volume (K) Forecast, by Application 2019 & 2032
- Table 65: Israel Pcb Switch Revenue (million) Forecast, by Application 2019 & 2032
- Table 66: Israel Pcb Switch Volume (K) Forecast, by Application 2019 & 2032
- Table 67: GCC Pcb Switch Revenue (million) Forecast, by Application 2019 & 2032
- Table 68: GCC Pcb Switch Volume (K) Forecast, by Application 2019 & 2032
- Table 69: North Africa Pcb Switch Revenue (million) Forecast, by Application 2019 & 2032
- Table 70: North Africa Pcb Switch Volume (K) Forecast, by Application 2019 & 2032
- Table 71: South Africa Pcb Switch Revenue (million) Forecast, by Application 2019 & 2032
- Table 72: South Africa Pcb Switch Volume (K) Forecast, by Application 2019 & 2032
- Table 73: Rest of Middle East & Africa Pcb Switch Revenue (million) Forecast, by Application 2019 & 2032
- Table 74: Rest of Middle East & Africa Pcb Switch Volume (K) Forecast, by Application 2019 & 2032
- Table 75: Global Pcb Switch Revenue million Forecast, by Application 2019 & 2032
- Table 76: Global Pcb Switch Volume K Forecast, by Application 2019 & 2032
- Table 77: Global Pcb Switch Revenue million Forecast, by Type 2019 & 2032
- Table 78: Global Pcb Switch Volume K Forecast, by Type 2019 & 2032
- Table 79: Global Pcb Switch Revenue million Forecast, by Country 2019 & 2032
- Table 80: Global Pcb Switch Volume K Forecast, by Country 2019 & 2032
- Table 81: China Pcb Switch Revenue (million) Forecast, by Application 2019 & 2032
- Table 82: China Pcb Switch Volume (K) Forecast, by Application 2019 & 2032
- Table 83: India Pcb Switch Revenue (million) Forecast, by Application 2019 & 2032
- Table 84: India Pcb Switch Volume (K) Forecast, by Application 2019 & 2032
- Table 85: Japan Pcb Switch Revenue (million) Forecast, by Application 2019 & 2032
- Table 86: Japan Pcb Switch Volume (K) Forecast, by Application 2019 & 2032
- Table 87: South Korea Pcb Switch Revenue (million) Forecast, by Application 2019 & 2032
- Table 88: South Korea Pcb Switch Volume (K) Forecast, by Application 2019 & 2032
- Table 89: ASEAN Pcb Switch Revenue (million) Forecast, by Application 2019 & 2032
- Table 90: ASEAN Pcb Switch Volume (K) Forecast, by Application 2019 & 2032
- Table 91: Oceania Pcb Switch Revenue (million) Forecast, by Application 2019 & 2032
- Table 92: Oceania Pcb Switch Volume (K) Forecast, by Application 2019 & 2032
- Table 93: Rest of Asia Pacific Pcb Switch Revenue (million) Forecast, by Application 2019 & 2032
- Table 94: Rest of Asia Pacific Pcb Switch Volume (K) Forecast, by Application 2019 & 2032
Frequently Asked Questions
1. What is the projected Compound Annual Growth Rate (CAGR) of the Pcb Switch?
The projected CAGR is approximately 5.1%.
2. Which companies are prominent players in the Pcb Switch?
Key companies in the market include Techprint, Inc., Eastprint, Inc., CW Industries, Cit Relay & Switch, Quail Electronics Inc., Marsh Electronics, Inc., SCHURTER, Würth Elektronik, TE Connectivity, EAO Corporation, Apem, NIDEC COPAL ELECTRONICS, Mod-Tronic Instruments Limited, PUI - Projections Unlimited, Inc., ADI American Distributors LLC, PCBMay, TinyTronics B.V..
3. What are the main segments of the Pcb Switch?
The market segments include Application, Type.
4. Can you provide details about the market size?
The market size is estimated to be USD 3329 million as of 2022.
5. What are some drivers contributing to market growth?
N/A
6. What are the notable trends driving market growth?
N/A
7. Are there any restraints impacting market growth?
N/A
8. Can you provide examples of recent developments in the market?
N/A
9. What pricing options are available for accessing the report?
Pricing options include single-user, multi-user, and enterprise licenses priced at USD 3950.00, USD 5925.00, and USD 7900.00 respectively.
10. Is the market size provided in terms of value or volume?
The market size is provided in terms of value, measured in million and volume, measured in K.
11. Are there any specific market keywords associated with the report?
Yes, the market keyword associated with the report is "Pcb Switch," which aids in identifying and referencing the specific market segment covered.
12. How do I determine which pricing option suits my needs best?
The pricing options vary based on user requirements and access needs. Individual users may opt for single-user licenses, while businesses requiring broader access may choose multi-user or enterprise licenses for cost-effective access to the report.
13. Are there any additional resources or data provided in the Pcb Switch report?
While the report offers comprehensive insights, it's advisable to review the specific contents or supplementary materials provided to ascertain if additional resources or data are available.
14. How can I stay updated on further developments or reports in the Pcb Switch?
To stay informed about further developments, trends, and reports in the Pcb Switch, consider subscribing to industry newsletters, following relevant companies and organizations, or regularly checking reputable industry news sources and publications.
Methodology
Step 1 - Identification of Relevant Samples Size from Population Database


Step 2 - Approaches for Defining Global Market Size (Value, Volume* & Price*)

Note*: In applicable scenarios
Step 3 - Data Sources
Primary Research
- Web Analytics
- Survey Reports
- Research Institute
- Latest Research Reports
- Opinion Leaders
Secondary Research
- Annual Reports
- White Paper
- Latest Press Release
- Industry Association
- Paid Database
- Investor Presentations

Step 4 - Data Triangulation
Involves using different sources of information in order to increase the validity of a study
These sources are likely to be stakeholders in a program - participants, other researchers, program staff, other community members, and so on.
Then we put all data in single framework & apply various statistical tools to find out the dynamic on the market.
During the analysis stage, feedback from the stakeholder groups would be compared to determine areas of agreement as well as areas of divergence


