

Key Insights
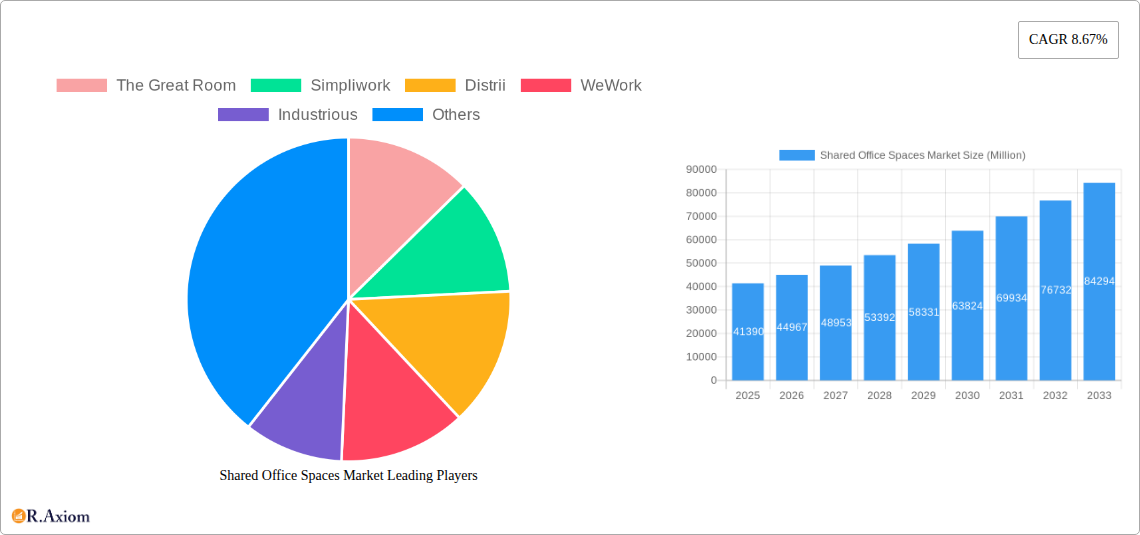
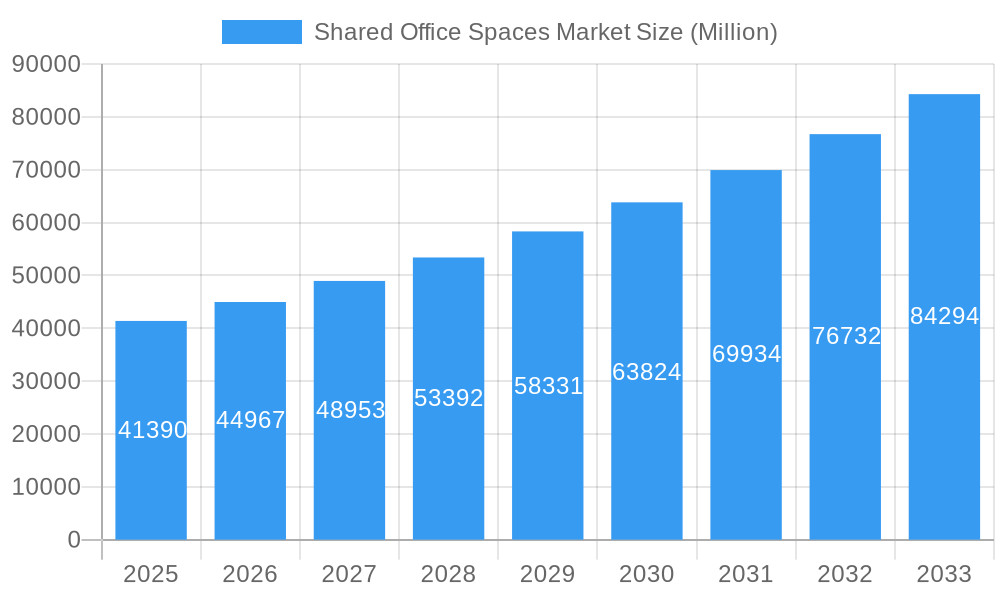
The global shared office space market, valued at $41.39 billion in 2025, is experiencing robust growth, projected to expand at a compound annual growth rate (CAGR) of 8.67% from 2025 to 2033. This expansion is driven by several key factors. The increasing preference for flexible work arrangements among businesses of all sizes, particularly startups and small to medium-sized enterprises (SMEs), is a major catalyst. The rising demand for cost-effective and efficient workspace solutions, coupled with the escalating costs of traditional office leases, further fuels market growth. Technological advancements, such as improved booking systems and smart office technologies, enhance operational efficiency and user experience, attracting a wider range of users. Furthermore, the growing adoption of hybrid work models post-pandemic has solidified the demand for flexible and scalable office spaces. The market is segmented by type (conventional, corporate, luxury, others), end-use (IT & ITES, legal services, BFSI, consulting, others), and user (freelancers, enterprises, others). North America and Asia-Pacific currently represent significant market shares, but growth is anticipated across all regions, driven by increasing urbanization and economic development.
Shared Office Spaces Market Market Size (In Billion)
The competitive landscape includes both established global players like WeWork, IWG Group, and Regus, and a growing number of regional and specialized providers. Competition focuses on providing innovative services, superior amenities, strategic locations, and flexible lease terms. While the market faces challenges such as economic downturns affecting demand and increasing competition, the overall outlook remains positive, driven by the enduring trend towards flexible work arrangements and the continued growth of the global economy. The long-term forecast anticipates sustained market expansion, with significant opportunities for companies offering innovative solutions and catering to specific market segments, particularly in rapidly developing economies. The market's evolution will likely involve further technological integration, enhanced sustainability initiatives, and a growing focus on community building within shared workspaces.
Shared Office Spaces Market Company Market Share
Shared Office Spaces Market: A Comprehensive Report (2019-2033)
This detailed report provides a comprehensive analysis of the global Shared Office Spaces market, covering the period 2019-2033. It offers actionable insights into market dynamics, competitive landscape, and future growth potential, making it an essential resource for industry stakeholders, investors, and businesses operating within or planning to enter this dynamic sector. The report leverages extensive data analysis and industry expertise to provide a clear and concise overview of the market. The global market value is projected to reach xx Million by 2033.
Shared Office Spaces Market Market Concentration & Innovation
The shared office space market exhibits a moderately concentrated structure, with several major players holding significant market share. WeWork, IWG Group, and Regus are among the leading global brands, while regional players like Distrii and JustCo dominate specific geographic areas. Market share fluctuates based on expansion strategies, M&A activities, and evolving customer preferences. Innovation plays a crucial role, with companies constantly striving to enhance amenities, technology integration (e.g., smart building technologies, booking systems), and service offerings to attract and retain clients.
- Market Concentration: The top 5 players account for approximately xx% of the global market share (2024).
- Innovation Drivers: Technological advancements, flexible workspace solutions, and sustainability initiatives are key drivers.
- Regulatory Frameworks: Zoning laws, building codes, and labor regulations influence market operations.
- Product Substitutes: Traditional office spaces, virtual offices, and co-living spaces compete for market share.
- End-User Trends: Growing demand for flexible work arrangements and collaborative environments fuels market growth.
- M&A Activities: Consolidation through mergers and acquisitions is a significant trend, impacting market structure and competition. Total M&A deal value for 2024 was estimated at xx Million.
Shared Office Spaces Market Industry Trends & Insights
The shared office space market is experiencing robust growth, driven by several key factors. The increasing adoption of flexible work arrangements, especially post-pandemic, is a significant catalyst. Technological advancements, such as smart office technologies and enhanced booking systems, are streamlining operations and improving user experience. Furthermore, a growing preference for collaborative work environments and the rise of the gig economy are contributing to market expansion. However, economic downturns and rising operating costs can pose challenges.
The market is characterized by a healthy CAGR of xx% during the forecast period (2025-2033), with significant market penetration observed in major urban centers globally. Competitive dynamics are intense, with companies vying for market share through strategic partnerships, technological innovation, and expansion into new markets. Consumer preferences are shifting towards spaces offering enhanced amenities, sustainability features, and strong community building initiatives.
Dominant Markets & Segments in Shared Office Spaces Market
Leading Region: North America currently holds the largest market share, driven by strong economic growth and high demand for flexible workspaces. However, Asia-Pacific is projected to experience the fastest growth rate in the coming years.
Dominant Segments:
- By Type: The conventional segment holds the largest market share due to its widespread availability and affordability. However, the luxury and corporate segments are witnessing significant growth, fueled by increased demand for premium amenities and tailored solutions.
- By End Use: The Information Technology (IT and ITES) sector is a major user of shared office spaces, followed by consulting and BFSI (Banking, Financial Services and Insurance).
- By User: Enterprises and freelancers are the primary users, with a growing number of small and medium-sized businesses adopting shared office spaces.
Key Drivers for Dominant Segments:
- North America: Strong entrepreneurial culture, robust venture capital investment, and established flexible workspace ecosystems.
- Asia-Pacific: Rapid urbanization, rising middle class, and increasing adoption of flexible work arrangements.
- IT & ITES: Need for collaborative work environments, agile development methodologies, and cost-effective solutions.
- Enterprises: Requirement for flexible expansion capabilities, reduced overhead costs, and access to diverse talent pools.
Shared Office Spaces Market Product Developments
Recent innovations in shared office spaces encompass smart building technologies, flexible layouts, enhanced security systems, and improved booking and management platforms. The focus is on integrating technology to improve efficiency, enhance the user experience, and create sustainable work environments. These developments aim to differentiate offerings and attract a wider range of clients, enhancing the market fit and competitive advantage of providers.
Report Scope & Segmentation Analysis
This report segments the shared office space market by type (conventional, corporate, luxury, other types), end-use (IT and ITES, legal services, BFSI, consulting, other services), and user (freelancers, enterprises, other users). Each segment includes detailed analysis of market size, growth projections, and competitive dynamics. For example, the corporate segment is expected to witness significant growth due to increasing demand for customized solutions, while the freelancer segment will continue to expand in line with the growing gig economy.
Key Drivers of Shared Office Spaces Market Growth
The shared office space market's growth is fueled by several factors, including:
- Increased demand for flexible work arrangements: The shift towards remote and hybrid work models has boosted demand.
- Technological advancements: Smart building technologies and innovative workspace solutions enhance user experience.
- Favorable economic conditions: Strong economic growth in certain regions supports market expansion (though economic downturns can be a headwind).
- Government initiatives: Policies promoting entrepreneurship and flexible work arrangements can positively impact the market.
Challenges in the Shared Office Spaces Market Sector
Several challenges impact the shared office space market, including:
- High operating costs: Rent, utilities, and staffing expenses can pose significant challenges.
- Competition: Intense competition from established players and new entrants impacts profitability.
- Economic downturns: Recessions can lead to reduced demand for shared office spaces.
- Health and safety concerns: Maintaining a safe and hygienic workspace is crucial, especially post-pandemic.
Emerging Opportunities in Shared Office Spaces Market
Emerging opportunities include:
- Expansion into underserved markets: Growth potential exists in smaller cities and developing countries.
- Specialization: Providing niche services, like spaces for specific industries or those with advanced amenities.
- Integration of technology: Offering smart building features and advanced communication systems.
- Sustainable practices: Focusing on environmentally friendly spaces and operations is a growing trend.
Leading Players in the Shared Office Spaces Market Market
- The Great Room
- Simpliwork
- Distrii
- WeWork
- Industrious
- IWG Group
- Convene
- District Cowork
- Regus
- JustCo
- Servcorp Limited
Key Developments in Shared Office Spaces Market Industry
- June 2023: The Great Room expands into the Australian market, opening a new location in Sydney. This signifies the ongoing expansion of premium coworking spaces globally.
- July 2023: Industrious partners with Instacart, offering same-day grocery delivery to its US offices. This highlights the importance of providing enhanced amenities and services to attract and retain clients.
Strategic Outlook for Shared Office Spaces Market Market
The future of the shared office space market looks promising, driven by continued demand for flexible work arrangements, technological advancements, and expansion into new markets. Companies that successfully adapt to changing customer preferences, leverage technology, and focus on sustainability will be best positioned for long-term growth and success. The market is expected to witness further consolidation through mergers and acquisitions, and innovation will continue to play a crucial role in shaping the future of the industry.
Shared Office Spaces Market Segmentation
-
1. Type
- 1.1. Co-Working Space
- 1.2. Serviced offices / Executive suites
- 1.3. Others (Hybrid, Virtual Office)
-
2. End Use
- 2.1. Information Technology (IT and ITES)
- 2.2. BFSI (Banking, Financial Services and Insurance)
- 2.3. Business Consulting & Professional Services
- 2.4. Other Se
-
3. User
- 3.1. Freelancers
- 3.2. Enterprises
- 3.3. Start Ups
- 3.4. Others (Remote Worker, Digital Nomads)
Shared Office Spaces Market Segmentation By Geography
-
1. North America
- 1.1. United States
- 1.2. Canada
- 1.3. Mexico
-
2. Asia Pacific
- 2.1. India
- 2.2. China
- 2.3. Singapore
- 2.4. Japan
- 2.5. South Korea
- 2.6. Vietnam
- 2.7. Australia
- 2.8. Rest of Asia Pacific
-
3. Europe
- 3.1. Germany
- 3.2. United Kingdom
- 3.3. Spain
- 3.4. France
- 3.5. Italy
- 3.6. Rest of Europe
- 4. Middle East
-
5. United Arab Emirates
- 5.1. Saudi Arabia
- 5.2. Egypt
- 5.3. Rest of Middle East and Africa
- 6. Rest of the world
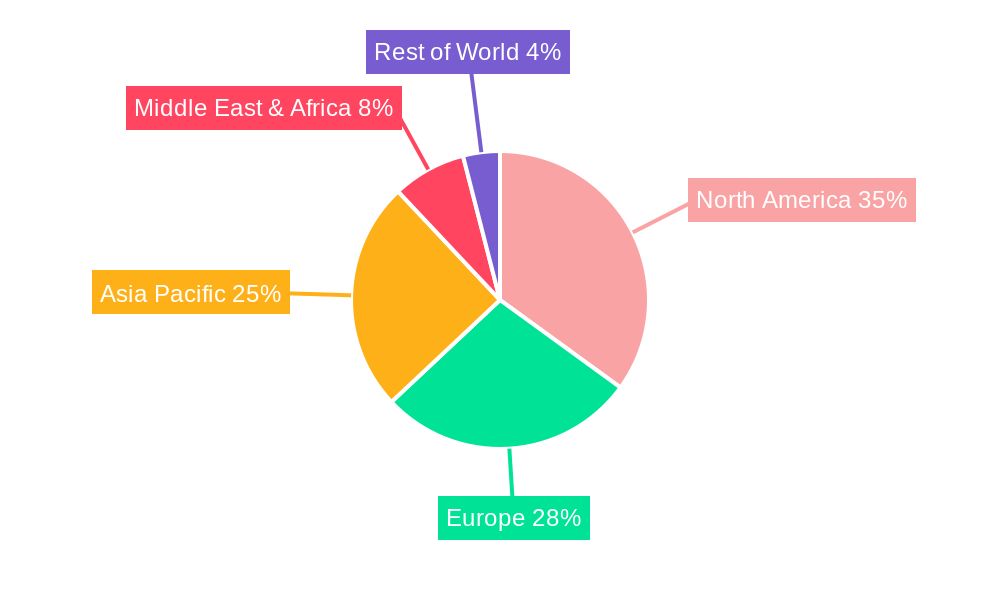
Shared Office Spaces Market Regional Market Share
Geographic Coverage of Shared Office Spaces Market
Shared Office Spaces Market REPORT HIGHLIGHTS
| Aspects | Details |
|---|---|
| Study Period | 2020-2034 |
| Base Year | 2025 |
| Estimated Year | 2026 |
| Forecast Period | 2026-2034 |
| Historical Period | 2020-2025 |
| Growth Rate | CAGR of 8.67% from 2020-2034 |
| Segmentation |
|
Table of Contents
- 1. Introduction
- 1.1. Research Scope
- 1.2. Market Segmentation
- 1.3. Research Methodology
- 1.4. Definitions and Assumptions
- 2. Executive Summary
- 2.1. Introduction
- 3. Market Dynamics
- 3.1. Introduction
- 3.2. Market Drivers
- 3.2.1. Increasing Adoption of Remote and Hybrid Work Model
- 3.3. Market Restrains
- 3.3.1. Lack of Privacy
- 3.4. Market Trends
- 3.4.1. Increasing Number of Co-working Space Members
- 4. Market Factor Analysis
- 4.1. Porters Five Forces
- 4.2. Supply/Value Chain
- 4.3. PESTEL analysis
- 4.4. Market Entropy
- 4.5. Patent/Trademark Analysis
- 5. Global Shared Office Spaces Market Analysis, Insights and Forecast, 2020-2032
- 5.1. Market Analysis, Insights and Forecast - by Type
- 5.1.1. Co-Working Space
- 5.1.2. Serviced offices / Executive suites
- 5.1.3. Others (Hybrid, Virtual Office)
- 5.2. Market Analysis, Insights and Forecast - by End Use
- 5.2.1. Information Technology (IT and ITES)
- 5.2.2. BFSI (Banking, Financial Services and Insurance)
- 5.2.3. Business Consulting & Professional Services
- 5.2.4. Other Se
- 5.3. Market Analysis, Insights and Forecast - by User
- 5.3.1. Freelancers
- 5.3.2. Enterprises
- 5.3.3. Start Ups
- 5.3.4. Others (Remote Worker, Digital Nomads)
- 5.4. Market Analysis, Insights and Forecast - by Region
- 5.4.1. North America
- 5.4.2. Asia Pacific
- 5.4.3. Europe
- 5.4.4. Middle East
- 5.4.5. United Arab Emirates
- 5.4.6. Rest of the world
- 5.1. Market Analysis, Insights and Forecast - by Type
- 6. North America Shared Office Spaces Market Analysis, Insights and Forecast, 2020-2032
- 6.1. Market Analysis, Insights and Forecast - by Type
- 6.1.1. Co-Working Space
- 6.1.2. Serviced offices / Executive suites
- 6.1.3. Others (Hybrid, Virtual Office)
- 6.2. Market Analysis, Insights and Forecast - by End Use
- 6.2.1. Information Technology (IT and ITES)
- 6.2.2. BFSI (Banking, Financial Services and Insurance)
- 6.2.3. Business Consulting & Professional Services
- 6.2.4. Other Se
- 6.3. Market Analysis, Insights and Forecast - by User
- 6.3.1. Freelancers
- 6.3.2. Enterprises
- 6.3.3. Start Ups
- 6.3.4. Others (Remote Worker, Digital Nomads)
- 6.1. Market Analysis, Insights and Forecast - by Type
- 7. Asia Pacific Shared Office Spaces Market Analysis, Insights and Forecast, 2020-2032
- 7.1. Market Analysis, Insights and Forecast - by Type
- 7.1.1. Co-Working Space
- 7.1.2. Serviced offices / Executive suites
- 7.1.3. Others (Hybrid, Virtual Office)
- 7.2. Market Analysis, Insights and Forecast - by End Use
- 7.2.1. Information Technology (IT and ITES)
- 7.2.2. BFSI (Banking, Financial Services and Insurance)
- 7.2.3. Business Consulting & Professional Services
- 7.2.4. Other Se
- 7.3. Market Analysis, Insights and Forecast - by User
- 7.3.1. Freelancers
- 7.3.2. Enterprises
- 7.3.3. Start Ups
- 7.3.4. Others (Remote Worker, Digital Nomads)
- 7.1. Market Analysis, Insights and Forecast - by Type
- 8. Europe Shared Office Spaces Market Analysis, Insights and Forecast, 2020-2032
- 8.1. Market Analysis, Insights and Forecast - by Type
- 8.1.1. Co-Working Space
- 8.1.2. Serviced offices / Executive suites
- 8.1.3. Others (Hybrid, Virtual Office)
- 8.2. Market Analysis, Insights and Forecast - by End Use
- 8.2.1. Information Technology (IT and ITES)
- 8.2.2. BFSI (Banking, Financial Services and Insurance)
- 8.2.3. Business Consulting & Professional Services
- 8.2.4. Other Se
- 8.3. Market Analysis, Insights and Forecast - by User
- 8.3.1. Freelancers
- 8.3.2. Enterprises
- 8.3.3. Start Ups
- 8.3.4. Others (Remote Worker, Digital Nomads)
- 8.1. Market Analysis, Insights and Forecast - by Type
- 9. Middle East Shared Office Spaces Market Analysis, Insights and Forecast, 2020-2032
- 9.1. Market Analysis, Insights and Forecast - by Type
- 9.1.1. Co-Working Space
- 9.1.2. Serviced offices / Executive suites
- 9.1.3. Others (Hybrid, Virtual Office)
- 9.2. Market Analysis, Insights and Forecast - by End Use
- 9.2.1. Information Technology (IT and ITES)
- 9.2.2. BFSI (Banking, Financial Services and Insurance)
- 9.2.3. Business Consulting & Professional Services
- 9.2.4. Other Se
- 9.3. Market Analysis, Insights and Forecast - by User
- 9.3.1. Freelancers
- 9.3.2. Enterprises
- 9.3.3. Start Ups
- 9.3.4. Others (Remote Worker, Digital Nomads)
- 9.1. Market Analysis, Insights and Forecast - by Type
- 10. United Arab Emirates Shared Office Spaces Market Analysis, Insights and Forecast, 2020-2032
- 10.1. Market Analysis, Insights and Forecast - by Type
- 10.1.1. Co-Working Space
- 10.1.2. Serviced offices / Executive suites
- 10.1.3. Others (Hybrid, Virtual Office)
- 10.2. Market Analysis, Insights and Forecast - by End Use
- 10.2.1. Information Technology (IT and ITES)
- 10.2.2. BFSI (Banking, Financial Services and Insurance)
- 10.2.3. Business Consulting & Professional Services
- 10.2.4. Other Se
- 10.3. Market Analysis, Insights and Forecast - by User
- 10.3.1. Freelancers
- 10.3.2. Enterprises
- 10.3.3. Start Ups
- 10.3.4. Others (Remote Worker, Digital Nomads)
- 10.1. Market Analysis, Insights and Forecast - by Type
- 11. Rest of the world Shared Office Spaces Market Analysis, Insights and Forecast, 2020-2032
- 11.1. Market Analysis, Insights and Forecast - by Type
- 11.1.1. Co-Working Space
- 11.1.2. Serviced offices / Executive suites
- 11.1.3. Others (Hybrid, Virtual Office)
- 11.2. Market Analysis, Insights and Forecast - by End Use
- 11.2.1. Information Technology (IT and ITES)
- 11.2.2. BFSI (Banking, Financial Services and Insurance)
- 11.2.3. Business Consulting & Professional Services
- 11.2.4. Other Se
- 11.3. Market Analysis, Insights and Forecast - by User
- 11.3.1. Freelancers
- 11.3.2. Enterprises
- 11.3.3. Start Ups
- 11.3.4. Others (Remote Worker, Digital Nomads)
- 11.1. Market Analysis, Insights and Forecast - by Type
- 12. Competitive Analysis
- 12.1. Global Market Share Analysis 2025
- 12.2. Company Profiles
- 12.2.1 The Great Room
- 12.2.1.1. Overview
- 12.2.1.2. Products
- 12.2.1.3. SWOT Analysis
- 12.2.1.4. Recent Developments
- 12.2.1.5. Financials (Based on Availability)
- 12.2.2 Simpliwork
- 12.2.2.1. Overview
- 12.2.2.2. Products
- 12.2.2.3. SWOT Analysis
- 12.2.2.4. Recent Developments
- 12.2.2.5. Financials (Based on Availability)
- 12.2.3 Distrii
- 12.2.3.1. Overview
- 12.2.3.2. Products
- 12.2.3.3. SWOT Analysis
- 12.2.3.4. Recent Developments
- 12.2.3.5. Financials (Based on Availability)
- 12.2.4 WeWork
- 12.2.4.1. Overview
- 12.2.4.2. Products
- 12.2.4.3. SWOT Analysis
- 12.2.4.4. Recent Developments
- 12.2.4.5. Financials (Based on Availability)
- 12.2.5 Industrious
- 12.2.5.1. Overview
- 12.2.5.2. Products
- 12.2.5.3. SWOT Analysis
- 12.2.5.4. Recent Developments
- 12.2.5.5. Financials (Based on Availability)
- 12.2.6 IWG Group
- 12.2.6.1. Overview
- 12.2.6.2. Products
- 12.2.6.3. SWOT Analysis
- 12.2.6.4. Recent Developments
- 12.2.6.5. Financials (Based on Availability)
- 12.2.7 Convene**List Not Exhaustive
- 12.2.7.1. Overview
- 12.2.7.2. Products
- 12.2.7.3. SWOT Analysis
- 12.2.7.4. Recent Developments
- 12.2.7.5. Financials (Based on Availability)
- 12.2.8 District Cowork
- 12.2.8.1. Overview
- 12.2.8.2. Products
- 12.2.8.3. SWOT Analysis
- 12.2.8.4. Recent Developments
- 12.2.8.5. Financials (Based on Availability)
- 12.2.9 Regus
- 12.2.9.1. Overview
- 12.2.9.2. Products
- 12.2.9.3. SWOT Analysis
- 12.2.9.4. Recent Developments
- 12.2.9.5. Financials (Based on Availability)
- 12.2.10 JustCo
- 12.2.10.1. Overview
- 12.2.10.2. Products
- 12.2.10.3. SWOT Analysis
- 12.2.10.4. Recent Developments
- 12.2.10.5. Financials (Based on Availability)
- 12.2.11 Servcorp Limited
- 12.2.11.1. Overview
- 12.2.11.2. Products
- 12.2.11.3. SWOT Analysis
- 12.2.11.4. Recent Developments
- 12.2.11.5. Financials (Based on Availability)
- 12.2.1 The Great Room
List of Figures
- Figure 1: Global Shared Office Spaces Market Revenue Breakdown (Million, %) by Region 2025 & 2033
- Figure 2: North America Shared Office Spaces Market Revenue (Million), by Type 2025 & 2033
- Figure 3: North America Shared Office Spaces Market Revenue Share (%), by Type 2025 & 2033
- Figure 4: North America Shared Office Spaces Market Revenue (Million), by End Use 2025 & 2033
- Figure 5: North America Shared Office Spaces Market Revenue Share (%), by End Use 2025 & 2033
- Figure 6: North America Shared Office Spaces Market Revenue (Million), by User 2025 & 2033
- Figure 7: North America Shared Office Spaces Market Revenue Share (%), by User 2025 & 2033
- Figure 8: North America Shared Office Spaces Market Revenue (Million), by Country 2025 & 2033
- Figure 9: North America Shared Office Spaces Market Revenue Share (%), by Country 2025 & 2033
- Figure 10: Asia Pacific Shared Office Spaces Market Revenue (Million), by Type 2025 & 2033
- Figure 11: Asia Pacific Shared Office Spaces Market Revenue Share (%), by Type 2025 & 2033
- Figure 12: Asia Pacific Shared Office Spaces Market Revenue (Million), by End Use 2025 & 2033
- Figure 13: Asia Pacific Shared Office Spaces Market Revenue Share (%), by End Use 2025 & 2033
- Figure 14: Asia Pacific Shared Office Spaces Market Revenue (Million), by User 2025 & 2033
- Figure 15: Asia Pacific Shared Office Spaces Market Revenue Share (%), by User 2025 & 2033
- Figure 16: Asia Pacific Shared Office Spaces Market Revenue (Million), by Country 2025 & 2033
- Figure 17: Asia Pacific Shared Office Spaces Market Revenue Share (%), by Country 2025 & 2033
- Figure 18: Europe Shared Office Spaces Market Revenue (Million), by Type 2025 & 2033
- Figure 19: Europe Shared Office Spaces Market Revenue Share (%), by Type 2025 & 2033
- Figure 20: Europe Shared Office Spaces Market Revenue (Million), by End Use 2025 & 2033
- Figure 21: Europe Shared Office Spaces Market Revenue Share (%), by End Use 2025 & 2033
- Figure 22: Europe Shared Office Spaces Market Revenue (Million), by User 2025 & 2033
- Figure 23: Europe Shared Office Spaces Market Revenue Share (%), by User 2025 & 2033
- Figure 24: Europe Shared Office Spaces Market Revenue (Million), by Country 2025 & 2033
- Figure 25: Europe Shared Office Spaces Market Revenue Share (%), by Country 2025 & 2033
- Figure 26: Middle East Shared Office Spaces Market Revenue (Million), by Type 2025 & 2033
- Figure 27: Middle East Shared Office Spaces Market Revenue Share (%), by Type 2025 & 2033
- Figure 28: Middle East Shared Office Spaces Market Revenue (Million), by End Use 2025 & 2033
- Figure 29: Middle East Shared Office Spaces Market Revenue Share (%), by End Use 2025 & 2033
- Figure 30: Middle East Shared Office Spaces Market Revenue (Million), by User 2025 & 2033
- Figure 31: Middle East Shared Office Spaces Market Revenue Share (%), by User 2025 & 2033
- Figure 32: Middle East Shared Office Spaces Market Revenue (Million), by Country 2025 & 2033
- Figure 33: Middle East Shared Office Spaces Market Revenue Share (%), by Country 2025 & 2033
- Figure 34: United Arab Emirates Shared Office Spaces Market Revenue (Million), by Type 2025 & 2033
- Figure 35: United Arab Emirates Shared Office Spaces Market Revenue Share (%), by Type 2025 & 2033
- Figure 36: United Arab Emirates Shared Office Spaces Market Revenue (Million), by End Use 2025 & 2033
- Figure 37: United Arab Emirates Shared Office Spaces Market Revenue Share (%), by End Use 2025 & 2033
- Figure 38: United Arab Emirates Shared Office Spaces Market Revenue (Million), by User 2025 & 2033
- Figure 39: United Arab Emirates Shared Office Spaces Market Revenue Share (%), by User 2025 & 2033
- Figure 40: United Arab Emirates Shared Office Spaces Market Revenue (Million), by Country 2025 & 2033
- Figure 41: United Arab Emirates Shared Office Spaces Market Revenue Share (%), by Country 2025 & 2033
- Figure 42: Rest of the world Shared Office Spaces Market Revenue (Million), by Type 2025 & 2033
- Figure 43: Rest of the world Shared Office Spaces Market Revenue Share (%), by Type 2025 & 2033
- Figure 44: Rest of the world Shared Office Spaces Market Revenue (Million), by End Use 2025 & 2033
- Figure 45: Rest of the world Shared Office Spaces Market Revenue Share (%), by End Use 2025 & 2033
- Figure 46: Rest of the world Shared Office Spaces Market Revenue (Million), by User 2025 & 2033
- Figure 47: Rest of the world Shared Office Spaces Market Revenue Share (%), by User 2025 & 2033
- Figure 48: Rest of the world Shared Office Spaces Market Revenue (Million), by Country 2025 & 2033
- Figure 49: Rest of the world Shared Office Spaces Market Revenue Share (%), by Country 2025 & 2033
List of Tables
- Table 1: Global Shared Office Spaces Market Revenue Million Forecast, by Type 2020 & 2033
- Table 2: Global Shared Office Spaces Market Revenue Million Forecast, by End Use 2020 & 2033
- Table 3: Global Shared Office Spaces Market Revenue Million Forecast, by User 2020 & 2033
- Table 4: Global Shared Office Spaces Market Revenue Million Forecast, by Region 2020 & 2033
- Table 5: Global Shared Office Spaces Market Revenue Million Forecast, by Type 2020 & 2033
- Table 6: Global Shared Office Spaces Market Revenue Million Forecast, by End Use 2020 & 2033
- Table 7: Global Shared Office Spaces Market Revenue Million Forecast, by User 2020 & 2033
- Table 8: Global Shared Office Spaces Market Revenue Million Forecast, by Country 2020 & 2033
- Table 9: United States Shared Office Spaces Market Revenue (Million) Forecast, by Application 2020 & 2033
- Table 10: Canada Shared Office Spaces Market Revenue (Million) Forecast, by Application 2020 & 2033
- Table 11: Mexico Shared Office Spaces Market Revenue (Million) Forecast, by Application 2020 & 2033
- Table 12: Global Shared Office Spaces Market Revenue Million Forecast, by Type 2020 & 2033
- Table 13: Global Shared Office Spaces Market Revenue Million Forecast, by End Use 2020 & 2033
- Table 14: Global Shared Office Spaces Market Revenue Million Forecast, by User 2020 & 2033
- Table 15: Global Shared Office Spaces Market Revenue Million Forecast, by Country 2020 & 2033
- Table 16: India Shared Office Spaces Market Revenue (Million) Forecast, by Application 2020 & 2033
- Table 17: China Shared Office Spaces Market Revenue (Million) Forecast, by Application 2020 & 2033
- Table 18: Singapore Shared Office Spaces Market Revenue (Million) Forecast, by Application 2020 & 2033
- Table 19: Japan Shared Office Spaces Market Revenue (Million) Forecast, by Application 2020 & 2033
- Table 20: South Korea Shared Office Spaces Market Revenue (Million) Forecast, by Application 2020 & 2033
- Table 21: Vietnam Shared Office Spaces Market Revenue (Million) Forecast, by Application 2020 & 2033
- Table 22: Australia Shared Office Spaces Market Revenue (Million) Forecast, by Application 2020 & 2033
- Table 23: Rest of Asia Pacific Shared Office Spaces Market Revenue (Million) Forecast, by Application 2020 & 2033
- Table 24: Global Shared Office Spaces Market Revenue Million Forecast, by Type 2020 & 2033
- Table 25: Global Shared Office Spaces Market Revenue Million Forecast, by End Use 2020 & 2033
- Table 26: Global Shared Office Spaces Market Revenue Million Forecast, by User 2020 & 2033
- Table 27: Global Shared Office Spaces Market Revenue Million Forecast, by Country 2020 & 2033
- Table 28: Germany Shared Office Spaces Market Revenue (Million) Forecast, by Application 2020 & 2033
- Table 29: United Kingdom Shared Office Spaces Market Revenue (Million) Forecast, by Application 2020 & 2033
- Table 30: Spain Shared Office Spaces Market Revenue (Million) Forecast, by Application 2020 & 2033
- Table 31: France Shared Office Spaces Market Revenue (Million) Forecast, by Application 2020 & 2033
- Table 32: Italy Shared Office Spaces Market Revenue (Million) Forecast, by Application 2020 & 2033
- Table 33: Rest of Europe Shared Office Spaces Market Revenue (Million) Forecast, by Application 2020 & 2033
- Table 34: Global Shared Office Spaces Market Revenue Million Forecast, by Type 2020 & 2033
- Table 35: Global Shared Office Spaces Market Revenue Million Forecast, by End Use 2020 & 2033
- Table 36: Global Shared Office Spaces Market Revenue Million Forecast, by User 2020 & 2033
- Table 37: Global Shared Office Spaces Market Revenue Million Forecast, by Country 2020 & 2033
- Table 38: Global Shared Office Spaces Market Revenue Million Forecast, by Type 2020 & 2033
- Table 39: Global Shared Office Spaces Market Revenue Million Forecast, by End Use 2020 & 2033
- Table 40: Global Shared Office Spaces Market Revenue Million Forecast, by User 2020 & 2033
- Table 41: Global Shared Office Spaces Market Revenue Million Forecast, by Country 2020 & 2033
- Table 42: Saudi Arabia Shared Office Spaces Market Revenue (Million) Forecast, by Application 2020 & 2033
- Table 43: Egypt Shared Office Spaces Market Revenue (Million) Forecast, by Application 2020 & 2033
- Table 44: Rest of Middle East and Africa Shared Office Spaces Market Revenue (Million) Forecast, by Application 2020 & 2033
- Table 45: Global Shared Office Spaces Market Revenue Million Forecast, by Type 2020 & 2033
- Table 46: Global Shared Office Spaces Market Revenue Million Forecast, by End Use 2020 & 2033
- Table 47: Global Shared Office Spaces Market Revenue Million Forecast, by User 2020 & 2033
- Table 48: Global Shared Office Spaces Market Revenue Million Forecast, by Country 2020 & 2033
Frequently Asked Questions
1. What is the projected Compound Annual Growth Rate (CAGR) of the Shared Office Spaces Market?
The projected CAGR is approximately 8.67%.
2. Which companies are prominent players in the Shared Office Spaces Market?
Key companies in the market include The Great Room, Simpliwork, Distrii, WeWork, Industrious, IWG Group, Convene**List Not Exhaustive, District Cowork, Regus, JustCo, Servcorp Limited.
3. What are the main segments of the Shared Office Spaces Market?
The market segments include Type, End Use, User.
4. Can you provide details about the market size?
The market size is estimated to be USD 41.39 Million as of 2022.
5. What are some drivers contributing to market growth?
Increasing Adoption of Remote and Hybrid Work Model.
6. What are the notable trends driving market growth?
Increasing Number of Co-working Space Members.
7. Are there any restraints impacting market growth?
Lack of Privacy.
8. Can you provide examples of recent developments in the market?
June 2023: Premium hospitality-led coworking space, THE GREAT ROOM by Industrious, is announced its expansion into the Australian market. The Great Room is set to open its doors in the heart of Sydney’s CBD at Level 29, 85 Castlereagh Street, marking its first foray into the country in partnership with Australia & New Zealand-based asset manager 151 Property. Spanning 1,200 sqm, 35 dedicated offices and enterprise customised spaces, the new Sydney location will overlook iconic Hyde Park and provide the same high standard of comfort, aesthetics, and performance synonymous with The Great Room brand.
9. What pricing options are available for accessing the report?
Pricing options include single-user, multi-user, and enterprise licenses priced at USD 4750, USD 5250, and USD 8750 respectively.
10. Is the market size provided in terms of value or volume?
The market size is provided in terms of value, measured in Million.
11. Are there any specific market keywords associated with the report?
Yes, the market keyword associated with the report is "Shared Office Spaces Market," which aids in identifying and referencing the specific market segment covered.
12. How do I determine which pricing option suits my needs best?
The pricing options vary based on user requirements and access needs. Individual users may opt for single-user licenses, while businesses requiring broader access may choose multi-user or enterprise licenses for cost-effective access to the report.
13. Are there any additional resources or data provided in the Shared Office Spaces Market report?
While the report offers comprehensive insights, it's advisable to review the specific contents or supplementary materials provided to ascertain if additional resources or data are available.
14. How can I stay updated on further developments or reports in the Shared Office Spaces Market?
To stay informed about further developments, trends, and reports in the Shared Office Spaces Market, consider subscribing to industry newsletters, following relevant companies and organizations, or regularly checking reputable industry news sources and publications.
Methodology
Step 1 - Identification of Relevant Samples Size from Population Database


Step 2 - Approaches for Defining Global Market Size (Value, Volume* & Price*)

Note*: In applicable scenarios
Step 3 - Data Sources
Primary Research
- Web Analytics
- Survey Reports
- Research Institute
- Latest Research Reports
- Opinion Leaders
Secondary Research
- Annual Reports
- White Paper
- Latest Press Release
- Industry Association
- Paid Database
- Investor Presentations

Step 4 - Data Triangulation
Involves using different sources of information in order to increase the validity of a study
These sources are likely to be stakeholders in a program - participants, other researchers, program staff, other community members, and so on.
Then we put all data in single framework & apply various statistical tools to find out the dynamic on the market.
During the analysis stage, feedback from the stakeholder groups would be compared to determine areas of agreement as well as areas of divergence