Key Insights
The USA Office Real Estate Industry is poised for robust growth, with a projected market size in the tens of billions of dollars. Driven by a healthy Compound Annual Growth Rate (CAGR) exceeding 4.00%, the sector is experiencing significant expansion. Key drivers include the ongoing demand for flexible and collaborative workspaces, the resurgence of in-office work post-pandemic, and the need for modernized, amenity-rich office environments that attract and retain talent. Technology integration, smart building solutions, and sustainable design are becoming paramount, pushing for upgrades and new constructions that cater to evolving corporate needs. The expansion of sectors like Information Technology (IT and ITES), Banking, Financial Services, and Insurance (BFSI), and Consulting are directly fueling this demand, requiring specialized and well-equipped office spaces. Despite potential economic headwinds or shifts in work-from-home policies, the overarching trend points towards a market that values quality, location, and employee experience.
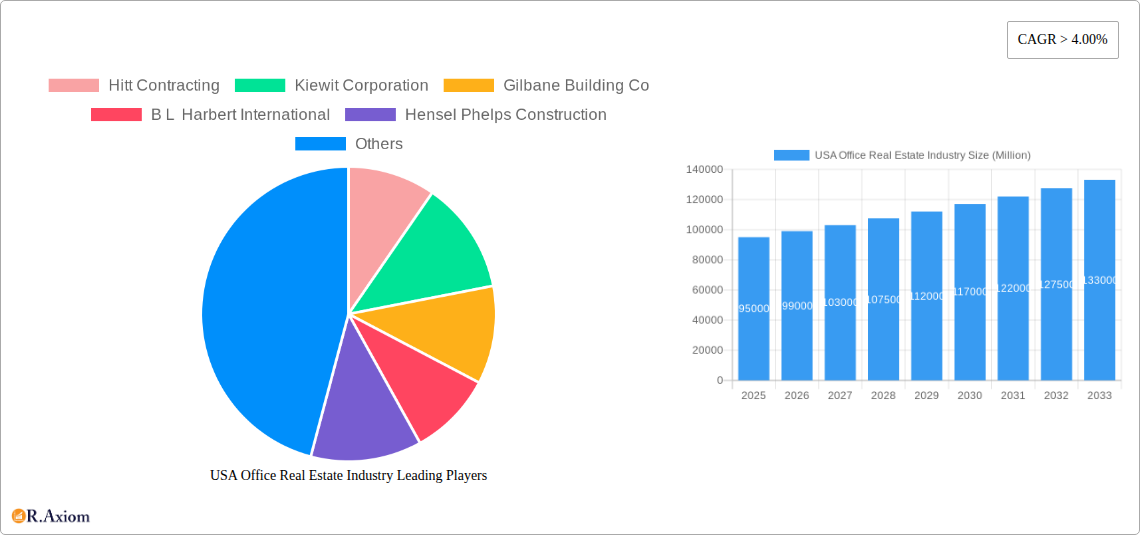
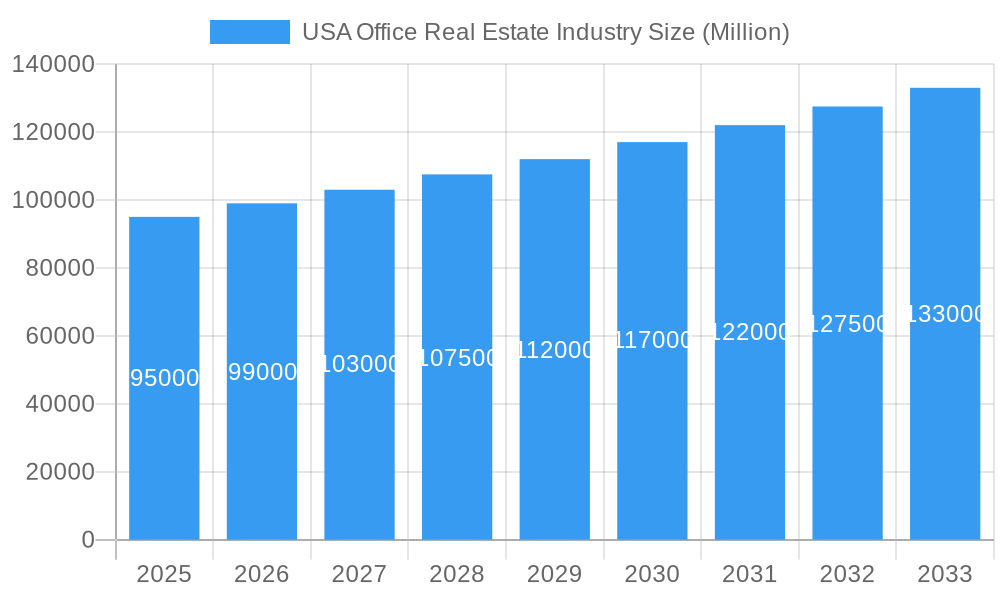
USA Office Real Estate Industry Market Size (In Billion)
The industry's trajectory is further shaped by significant trends such as the rise of hybrid work models, necessitating adaptable layouts and technology infrastructure, and the increasing focus on Environmental, Social, and Governance (ESG) principles, driving demand for green buildings. Emerging technologies like AI and IoT are being integrated to enhance building management and tenant experience. While rising construction costs and the persistent influence of remote work present some challenges, the sheer scale of the market and the sustained need for well-designed, functional office spaces across major economic hubs are expected to sustain a positive growth outlook. Companies like Hitt Contracting, Kiewit Corporation, and Skanska USA Inc. are at the forefront, investing in innovative construction and development to meet the diverse requirements of a dynamic office real estate landscape. The North American region, particularly the United States, will continue to be the dominant force, influencing global market dynamics.
USA Office Real Estate Industry Company Market Share
USA Office Real Estate Industry Market Concentration & Innovation
The USA Office Real Estate industry exhibits a moderate level of market concentration, with a blend of large, established players and a dynamic landscape of emerging firms. Key players like Hitt Contracting, Kiewit Corporation, Gilbane Building Co, B L Harbert International, Hensel Phelps Construction, Ryan Companies US Inc, Skanska USA Inc, Turner Construction Company Inc, Trammell Crow Company, Clayco Inc, Dpr Construction, and PCL Construction Enterprises hold significant market share. Innovation is a critical driver, fueled by advancements in sustainable building technologies, smart office solutions, and flexible workspace models. Regulatory frameworks, while generally supportive of development, can introduce complexities, particularly concerning zoning laws, environmental standards, and building codes. Product substitutes, such as co-working spaces and the increasing adoption of remote work, continue to exert pressure, albeit with a renewed focus on hybrid models. End-user trends are shifting towards demand for amenity-rich environments, health and wellness features, and adaptable floor plans that cater to evolving workforce needs. Merger and acquisition (M&A) activities, while not always publicly disclosed with granular detail for this specific industry segment, are common as larger entities seek to expand their portfolios, acquire specialized expertise, or enter new geographic markets. Anticipated M&A deal values in the coming years are expected to remain robust, reflecting the ongoing consolidation and strategic realignment within the sector.
USA Office Real Estate Industry Industry Trends & Insights
The USA Office Real Estate industry is navigating a period of significant transformation, driven by a confluence of technological advancements, evolving economic policies, and shifting consumer preferences. The Compound Annual Growth Rate (CAGR) for the office real estate market is projected to be approximately 4.5% over the forecast period of 2025–2033, indicating a steady but measured recovery and expansion. Market penetration of innovative workspace solutions, such as flexible leasing models and tech-enabled buildings, is increasing, with an estimated penetration rate of 30% by 2033.
Technological disruptions are reshaping how office spaces are designed, managed, and utilized. The integration of Artificial Intelligence (AI) and the Internet of Things (IoT) is leading to smarter, more energy-efficient buildings with enhanced occupant experiences. Predictive analytics are being employed for space utilization optimization, predictive maintenance, and personalized environmental controls. This digital transformation is not only improving operational efficiency but also creating more responsive and attractive workplaces.
Consumer preferences are undergoing a fundamental shift. Tenants are prioritizing locations that offer a high quality of life, robust public transportation links, and access to amenities like fitness centers, dining establishments, and green spaces. The demand for wellness-focused features, such as improved air quality, natural light, and biophilic design, is escalating as companies recognize their impact on employee productivity and well-being. Furthermore, the rise of hybrid work models has fueled a demand for flexible office solutions, including hot-desking, hot-eling, and on-demand meeting spaces. Companies are seeking to optimize their real estate footprints to balance the need for collaboration and company culture with the benefits of remote work flexibility.
Competitive dynamics within the industry are intensifying. Developers and landlords are investing heavily in modernizing existing assets and constructing new, state-of-the-art buildings to meet these evolving demands. Property technology (PropTech) startups are playing an increasingly vital role, offering innovative solutions for building management, tenant engagement, and space optimization. Strategic partnerships between traditional real estate firms and technology providers are becoming more common, fostering a collaborative ecosystem that drives innovation and competitive advantage. The industry is also witnessing a growing emphasis on Environmental, Social, and Governance (ESG) principles, with investors and tenants alike demanding sustainable and socially responsible real estate practices. This includes a focus on reducing carbon footprints, promoting diversity and inclusion, and ensuring ethical sourcing and construction practices.
Dominant Markets & Segments in USA Office Real Estate Industry
The USA Office Real Estate Industry's dominance is intricately linked to its vibrant economic landscape and the specific needs of its diverse business sectors. Among the key segments, the Information Technology (IT and ITES) sector continues to be a significant driver of demand, particularly in tech hubs like Silicon Valley, Seattle, and Austin. The constant need for innovation and talent acquisition in this sector necessitates well-equipped, modern office spaces that foster collaboration and attract top professionals. Economic policies that support technological growth and venture capital investment directly fuel the expansion of this segment, creating a ripple effect on office space requirements. Infrastructure development, including high-speed internet connectivity and accessible transportation networks, is paramount for supporting the dense operational needs of IT companies.
The BFSI (Banking, Financial Services, and Insurance) sector remains a strong contender for office space, with a substantial presence in major financial centers such as New York City, Chicago, and Charlotte. While some financial services operations have embraced remote work, the need for secure, centralized data management, client-facing meeting spaces, and collaborative trading floors continues to drive demand for prime office locations. Robust regulatory frameworks within BFSI often necessitate highly secure and compliant office environments, influencing design and operational requirements.
Consulting firms, operating across various industries, also represent a significant segment. Their demand is often characterized by a need for flexible, professional office spaces in central business districts, allowing for easy client access and fostering a professional image. The growth of the consulting sector is often tied to broader economic trends and the need for expert advice in areas like digital transformation, sustainability, and market entry.
The Manufacturing sector, while traditionally associated with industrial spaces, also has a growing need for administrative and R&D office facilities. Companies in this sector are increasingly establishing corporate offices to manage operations, design new products, and engage with clients. Proximity to manufacturing plants and robust logistics infrastructure are key drivers for their office space decisions.
Other Services, encompassing a wide array of businesses from legal and healthcare to media and professional services, collectively contribute substantially to office space demand. The diverse nature of this segment means that their office space requirements vary greatly, from specialized medical offices to creative studio spaces. Economic policies that stimulate diverse business growth and support small and medium-sized enterprises (SMEs) indirectly boost demand within this broad category.
USA Office Real Estate Industry Product Developments
Product developments in the USA Office Real Estate industry are heavily influenced by the pursuit of enhanced functionality, occupant well-being, and sustainability. Innovations include smart building technologies that optimize energy consumption through AI-driven systems and IoT sensors, leading to significant cost savings and environmental benefits. Flexible workspace solutions, offering modular furniture and adaptable layouts, are gaining traction, allowing tenants to reconfigure spaces easily to suit evolving needs. The integration of biophilic design elements, such as indoor plants and natural light optimization, is a growing trend aimed at improving employee health and productivity. Competitive advantages are being realized through buildings that offer a comprehensive suite of amenities, including advanced AV conferencing capabilities, on-site wellness facilities, and integrated mobile applications for building access and service requests.
Report Scope & Segmentation Analysis
This report provides a comprehensive analysis of the USA Office Real Estate Industry. The market is segmented by Sector, including Information Technology (IT and ITES), Manufacturing, BFSI (Banking, Financial Services, and Insurance), Consulting, and Other Services.
- Information Technology (IT and ITES): Expected to experience robust growth, with market sizes projected to reach $150 Billion by 2033, driven by ongoing digital transformation and tech talent demand. Competitive dynamics are intense, with a focus on innovation hubs.
- Manufacturing: While traditionally less office-centric, the administrative and R&D office segment is anticipated to grow to $40 Billion by 2033, supported by reshoring initiatives and advanced manufacturing needs.
- BFSI (Banking, Financial Services, and Insurance): Projected to reach $120 Billion by 2033, with steady demand for prime locations and secure, compliant spaces. Regulatory impacts are a key consideration.
- Consulting: Forecasted to grow to $70 Billion by 2033, driven by an increasing need for specialized expertise across various industries. Flexibility and central locations are critical.
- Other Services: This broad segment is projected to reach $100 Billion by 2033, encompassing diverse needs and demonstrating resilient demand across various sub-sectors.
Key Drivers of USA Office Real Estate Industry Growth
The growth of the USA Office Real Estate industry is propelled by several interconnected factors. Technological advancements, particularly in AI and IoT, are enabling smarter, more efficient, and occupant-centric buildings, driving demand for upgraded facilities. Economic recovery and business expansion are fundamental drivers, as companies increase their hiring and require physical spaces for collaboration and operations. Shifting work models, from fully remote to hybrid, are creating a demand for flexible, amenity-rich, and strategically located office spaces that cater to employee well-being and productivity. Favorable government policies and incentives promoting urban development and sustainable construction also contribute significantly.
Challenges in the USA Office Real Estate Industry Sector
The USA Office Real Estate Industry faces several significant challenges. The persistent impact of remote and hybrid work models continues to create uncertainty regarding long-term space needs and has led to increased vacancy rates in some markets, estimated at 15% nationally. Economic volatility and inflation can impact construction costs and tenant affordability. Regulatory hurdles, including complex zoning laws and increasing environmental compliance requirements, can delay projects and increase development expenses. Furthermore, intensified competition from alternative workspace solutions and older, less-attractive buildings necessitates significant investment in modernization to remain competitive. Supply chain disruptions can also impact construction timelines and material costs.
Emerging Opportunities in USA Office Real Estate Industry
Emerging opportunities in the USA Office Real Estate industry lie in adapting to the evolving demands of the modern workforce and leveraging technological innovation. The demand for flexible and adaptable workspaces, including co-working spaces and on-demand meeting rooms, is a significant growth area. Sustainable and ESG-focused developments are increasingly sought after by both tenants and investors, presenting opportunities for green building certifications and energy-efficient designs. The repurposing of underutilized office spaces into mixed-use developments or residential units offers a creative solution to market imbalances. Furthermore, the integration of PropTech solutions for smart building management, tenant engagement, and data analytics presents opportunities for enhanced operational efficiency and value creation.
Leading Players in the USA Office Real Estate Industry Market
Hitt Contracting Kiewit Corporation Gilbane Building Co B L Harbert International Hensel Phelps Construction Ryan Companies US Inc Skanska USA Inc Turner Construction Company Inc Trammell Crow Company Clayco Inc Dpr Construction PCL Construction Enterprises Structure Tone LLC
Key Developments in USA Office Real Estate Industry Industry
- 2023/01: Increased investment in PropTech solutions to enhance building management and tenant experience.
- 2023/03: Growing demand for flexible lease terms and co-working spaces as hybrid work models solidify.
- 2023/06: Expansion of green building initiatives and focus on ESG compliance in new developments.
- 2024/01: Renewed interest in central business district office spaces with enhanced amenities and wellness features.
- 2024/04: Consolidation within the industry through strategic mergers and acquisitions to gain market share and specialized expertise.
- 2025/XX: Anticipated increase in demand for AI-powered building management systems to optimize energy consumption and occupant comfort.
Strategic Outlook for USA Office Real Estate Industry Market
The strategic outlook for the USA Office Real Estate industry is one of adaptive evolution and innovation. Future growth will be catalyzed by a focus on creating flexible, tech-enabled, and amenity-rich environments that attract and retain talent in a hybrid work landscape. Developers and landlords must prioritize sustainability and ESG compliance to meet growing investor and tenant expectations. The integration of advanced PropTech solutions will be crucial for operational efficiency and delivering superior occupant experiences. Strategic partnerships and a willingness to repurpose existing assets will be key to navigating market shifts and capitalizing on emerging opportunities, ensuring continued relevance and value creation in the evolving office market.
USA Office Real Estate Industry Segmentation
-
1. Sector
- 1.1. Information Technology (IT and ITES)
- 1.2. Manufacturing
- 1.3. BFSI (Banking, Financial Services, and Insurance)
- 1.4. Consulting
- 1.5. Other Services
USA Office Real Estate Industry Segmentation By Geography
-
1. North America
- 1.1. United States
- 1.2. Canada
- 1.3. Mexico
-
2. South America
- 2.1. Brazil
- 2.2. Argentina
- 2.3. Rest of South America
-
3. Europe
- 3.1. United Kingdom
- 3.2. Germany
- 3.3. France
- 3.4. Italy
- 3.5. Spain
- 3.6. Russia
- 3.7. Benelux
- 3.8. Nordics
- 3.9. Rest of Europe
-
4. Middle East & Africa
- 4.1. Turkey
- 4.2. Israel
- 4.3. GCC
- 4.4. North Africa
- 4.5. South Africa
- 4.6. Rest of Middle East & Africa
-
5. Asia Pacific
- 5.1. China
- 5.2. India
- 5.3. Japan
- 5.4. South Korea
- 5.5. ASEAN
- 5.6. Oceania
- 5.7. Rest of Asia Pacific
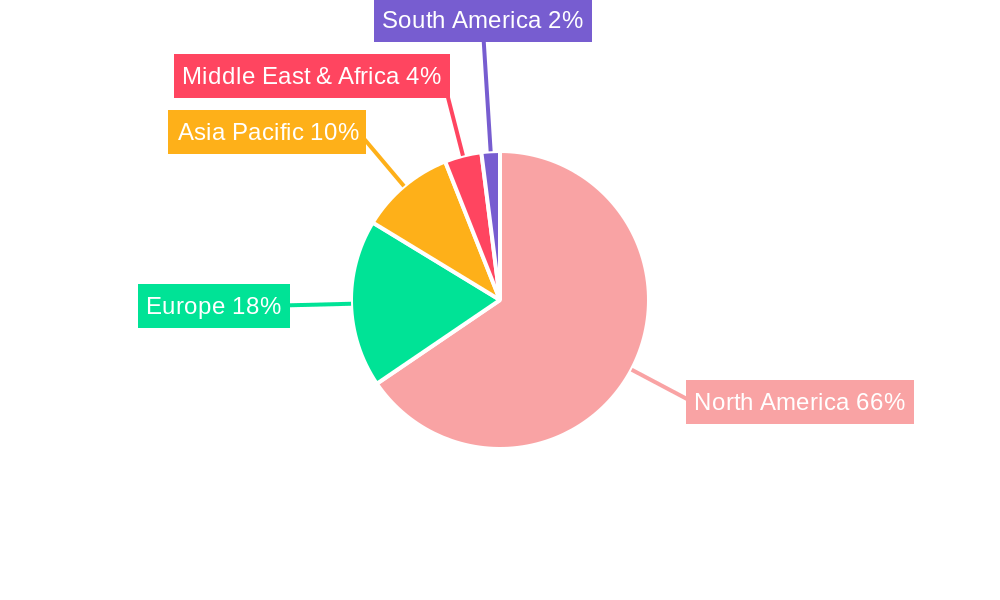
USA Office Real Estate Industry Regional Market Share
Geographic Coverage of USA Office Real Estate Industry
USA Office Real Estate Industry REPORT HIGHLIGHTS
| Aspects | Details |
|---|---|
| Study Period | 2020-2034 |
| Base Year | 2025 |
| Estimated Year | 2026 |
| Forecast Period | 2026-2034 |
| Historical Period | 2020-2025 |
| Growth Rate | CAGR of 7.1% from 2020-2034 |
| Segmentation |
|
Table of Contents
- 1. Introduction
- 1.1. Research Scope
- 1.2. Market Segmentation
- 1.3. Research Objective
- 1.4. Definitions and Assumptions
- 2. Executive Summary
- 2.1. Market Snapshot
- 3. Market Dynamics
- 3.1. Market Drivers
- 3.2. Market Restrains
- 3.3. Market Trends
- 3.4. Market Opportunities
- 4. Market Factor Analysis
- 4.1. Porters Five Forces
- 4.1.1. Bargaining Power of Suppliers
- 4.1.2. Bargaining Power of Buyers
- 4.1.3. Threat of New Entrants
- 4.1.4. Threat of Substitutes
- 4.1.5. Competitive Rivalry
- 4.2. PESTEL analysis
- 4.3. BCG Analysis
- 4.3.1. Stars (High Growth, High Market Share)
- 4.3.2. Cash Cows (Low Growth, High Market Share)
- 4.3.3. Question Mark (High Growth, Low Market Share)
- 4.3.4. Dogs (Low Growth, Low Market Share)
- 4.4. Ansoff Matrix Analysis
- 4.5. Supply Chain Analysis
- 4.6. Regulatory Landscape
- 4.7. Current Market Potential and Opportunity Assessment (TAM–SAM–SOM Framework)
- 4.8. RAX Analyst Note
- 4.1. Porters Five Forces
- 5. Market Analysis, Insights and Forecast 2021-2033
- 5.1. Market Analysis, Insights and Forecast - by Sector
- 5.1.1. Information Technology (IT and ITES)
- 5.1.2. Manufacturing
- 5.1.3. BFSI (Banking, Financial Services, and Insurance)
- 5.1.4. Consulting
- 5.1.5. Other Services
- 5.2. Market Analysis, Insights and Forecast - by Region
- 5.2.1. North America
- 5.2.2. South America
- 5.2.3. Europe
- 5.2.4. Middle East & Africa
- 5.2.5. Asia Pacific
- 5.1. Market Analysis, Insights and Forecast - by Sector
- 6. Global USA Office Real Estate Industry Analysis, Insights and Forecast, 2021-2033
- 6.1. Market Analysis, Insights and Forecast - by Sector
- 6.1.1. Information Technology (IT and ITES)
- 6.1.2. Manufacturing
- 6.1.3. BFSI (Banking, Financial Services, and Insurance)
- 6.1.4. Consulting
- 6.1.5. Other Services
- 6.1. Market Analysis, Insights and Forecast - by Sector
- 7. North America USA Office Real Estate Industry Analysis, Insights and Forecast, 2020-2032
- 7.1. Market Analysis, Insights and Forecast - by Sector
- 7.1.1. Information Technology (IT and ITES)
- 7.1.2. Manufacturing
- 7.1.3. BFSI (Banking, Financial Services, and Insurance)
- 7.1.4. Consulting
- 7.1.5. Other Services
- 7.1. Market Analysis, Insights and Forecast - by Sector
- 8. South America USA Office Real Estate Industry Analysis, Insights and Forecast, 2020-2032
- 8.1. Market Analysis, Insights and Forecast - by Sector
- 8.1.1. Information Technology (IT and ITES)
- 8.1.2. Manufacturing
- 8.1.3. BFSI (Banking, Financial Services, and Insurance)
- 8.1.4. Consulting
- 8.1.5. Other Services
- 8.1. Market Analysis, Insights and Forecast - by Sector
- 9. Europe USA Office Real Estate Industry Analysis, Insights and Forecast, 2020-2032
- 9.1. Market Analysis, Insights and Forecast - by Sector
- 9.1.1. Information Technology (IT and ITES)
- 9.1.2. Manufacturing
- 9.1.3. BFSI (Banking, Financial Services, and Insurance)
- 9.1.4. Consulting
- 9.1.5. Other Services
- 9.1. Market Analysis, Insights and Forecast - by Sector
- 10. Middle East & Africa USA Office Real Estate Industry Analysis, Insights and Forecast, 2020-2032
- 10.1. Market Analysis, Insights and Forecast - by Sector
- 10.1.1. Information Technology (IT and ITES)
- 10.1.2. Manufacturing
- 10.1.3. BFSI (Banking, Financial Services, and Insurance)
- 10.1.4. Consulting
- 10.1.5. Other Services
- 10.1. Market Analysis, Insights and Forecast - by Sector
- 11. Asia Pacific USA Office Real Estate Industry Analysis, Insights and Forecast, 2020-2032
- 11.1. Market Analysis, Insights and Forecast - by Sector
- 11.1.1. Information Technology (IT and ITES)
- 11.1.2. Manufacturing
- 11.1.3. BFSI (Banking, Financial Services, and Insurance)
- 11.1.4. Consulting
- 11.1.5. Other Services
- 11.1. Market Analysis, Insights and Forecast - by Sector
- 12. Competitive Analysis
- 12.1. Company Profiles
- 12.1.1 Hitt Contracting
- 12.1.1.1. Company Overview
- 12.1.1.2. Products
- 12.1.1.3. Company Financials
- 12.1.1.4. SWOT Analysis
- 12.1.2 Kiewit Corporation
- 12.1.2.1. Company Overview
- 12.1.2.2. Products
- 12.1.2.3. Company Financials
- 12.1.2.4. SWOT Analysis
- 12.1.3 Gilbane Building Co
- 12.1.3.1. Company Overview
- 12.1.3.2. Products
- 12.1.3.3. Company Financials
- 12.1.3.4. SWOT Analysis
- 12.1.4 B L Harbert International
- 12.1.4.1. Company Overview
- 12.1.4.2. Products
- 12.1.4.3. Company Financials
- 12.1.4.4. SWOT Analysis
- 12.1.5 Hensel Phelps Construction
- 12.1.5.1. Company Overview
- 12.1.5.2. Products
- 12.1.5.3. Company Financials
- 12.1.5.4. SWOT Analysis
- 12.1.6 Ryan Companies US Inc
- 12.1.6.1. Company Overview
- 12.1.6.2. Products
- 12.1.6.3. Company Financials
- 12.1.6.4. SWOT Analysis
- 12.1.7 Skanska USA Inc
- 12.1.7.1. Company Overview
- 12.1.7.2. Products
- 12.1.7.3. Company Financials
- 12.1.7.4. SWOT Analysis
- 12.1.8 Turner Construction Company Inc
- 12.1.8.1. Company Overview
- 12.1.8.2. Products
- 12.1.8.3. Company Financials
- 12.1.8.4. SWOT Analysis
- 12.1.9 Trammell Crow Company
- 12.1.9.1. Company Overview
- 12.1.9.2. Products
- 12.1.9.3. Company Financials
- 12.1.9.4. SWOT Analysis
- 12.1.10 Clayco Inc
- 12.1.10.1. Company Overview
- 12.1.10.2. Products
- 12.1.10.3. Company Financials
- 12.1.10.4. SWOT Analysis
- 12.1.11 Dpr Construction
- 12.1.11.1. Company Overview
- 12.1.11.2. Products
- 12.1.11.3. Company Financials
- 12.1.11.4. SWOT Analysis
- 12.1.12 PCL Construction Enterprises
- 12.1.12.1. Company Overview
- 12.1.12.2. Products
- 12.1.12.3. Company Financials
- 12.1.12.4. SWOT Analysis
- 12.1.13 Structure Tone LLC**List Not Exhaustive
- 12.1.13.1. Company Overview
- 12.1.13.2. Products
- 12.1.13.3. Company Financials
- 12.1.13.4. SWOT Analysis
- 12.1.1 Hitt Contracting
- 12.2. Market Entropy
- 12.2.1 Company's Key Areas Served
- 12.2.2 Recent Developments
- 12.3. Company Market Share Analysis 2025
- 12.3.1 Top 5 Companies Market Share Analysis
- 12.3.2 Top 3 Companies Market Share Analysis
- 12.4. List of Potential Customers
- 13. Research Methodology
List of Figures
- Figure 1: Global USA Office Real Estate Industry Revenue Breakdown (billion, %) by Region 2025 & 2033
- Figure 2: North America USA Office Real Estate Industry Revenue (billion), by Sector 2025 & 2033
- Figure 3: North America USA Office Real Estate Industry Revenue Share (%), by Sector 2025 & 2033
- Figure 4: North America USA Office Real Estate Industry Revenue (billion), by Country 2025 & 2033
- Figure 5: North America USA Office Real Estate Industry Revenue Share (%), by Country 2025 & 2033
- Figure 6: South America USA Office Real Estate Industry Revenue (billion), by Sector 2025 & 2033
- Figure 7: South America USA Office Real Estate Industry Revenue Share (%), by Sector 2025 & 2033
- Figure 8: South America USA Office Real Estate Industry Revenue (billion), by Country 2025 & 2033
- Figure 9: South America USA Office Real Estate Industry Revenue Share (%), by Country 2025 & 2033
- Figure 10: Europe USA Office Real Estate Industry Revenue (billion), by Sector 2025 & 2033
- Figure 11: Europe USA Office Real Estate Industry Revenue Share (%), by Sector 2025 & 2033
- Figure 12: Europe USA Office Real Estate Industry Revenue (billion), by Country 2025 & 2033
- Figure 13: Europe USA Office Real Estate Industry Revenue Share (%), by Country 2025 & 2033
- Figure 14: Middle East & Africa USA Office Real Estate Industry Revenue (billion), by Sector 2025 & 2033
- Figure 15: Middle East & Africa USA Office Real Estate Industry Revenue Share (%), by Sector 2025 & 2033
- Figure 16: Middle East & Africa USA Office Real Estate Industry Revenue (billion), by Country 2025 & 2033
- Figure 17: Middle East & Africa USA Office Real Estate Industry Revenue Share (%), by Country 2025 & 2033
- Figure 18: Asia Pacific USA Office Real Estate Industry Revenue (billion), by Sector 2025 & 2033
- Figure 19: Asia Pacific USA Office Real Estate Industry Revenue Share (%), by Sector 2025 & 2033
- Figure 20: Asia Pacific USA Office Real Estate Industry Revenue (billion), by Country 2025 & 2033
- Figure 21: Asia Pacific USA Office Real Estate Industry Revenue Share (%), by Country 2025 & 2033
List of Tables
- Table 1: Global USA Office Real Estate Industry Revenue billion Forecast, by Sector 2020 & 2033
- Table 2: Global USA Office Real Estate Industry Revenue billion Forecast, by Region 2020 & 2033
- Table 3: Global USA Office Real Estate Industry Revenue billion Forecast, by Sector 2020 & 2033
- Table 4: Global USA Office Real Estate Industry Revenue billion Forecast, by Country 2020 & 2033
- Table 5: United States USA Office Real Estate Industry Revenue (billion) Forecast, by Application 2020 & 2033
- Table 6: Canada USA Office Real Estate Industry Revenue (billion) Forecast, by Application 2020 & 2033
- Table 7: Mexico USA Office Real Estate Industry Revenue (billion) Forecast, by Application 2020 & 2033
- Table 8: Global USA Office Real Estate Industry Revenue billion Forecast, by Sector 2020 & 2033
- Table 9: Global USA Office Real Estate Industry Revenue billion Forecast, by Country 2020 & 2033
- Table 10: Brazil USA Office Real Estate Industry Revenue (billion) Forecast, by Application 2020 & 2033
- Table 11: Argentina USA Office Real Estate Industry Revenue (billion) Forecast, by Application 2020 & 2033
- Table 12: Rest of South America USA Office Real Estate Industry Revenue (billion) Forecast, by Application 2020 & 2033
- Table 13: Global USA Office Real Estate Industry Revenue billion Forecast, by Sector 2020 & 2033
- Table 14: Global USA Office Real Estate Industry Revenue billion Forecast, by Country 2020 & 2033
- Table 15: United Kingdom USA Office Real Estate Industry Revenue (billion) Forecast, by Application 2020 & 2033
- Table 16: Germany USA Office Real Estate Industry Revenue (billion) Forecast, by Application 2020 & 2033
- Table 17: France USA Office Real Estate Industry Revenue (billion) Forecast, by Application 2020 & 2033
- Table 18: Italy USA Office Real Estate Industry Revenue (billion) Forecast, by Application 2020 & 2033
- Table 19: Spain USA Office Real Estate Industry Revenue (billion) Forecast, by Application 2020 & 2033
- Table 20: Russia USA Office Real Estate Industry Revenue (billion) Forecast, by Application 2020 & 2033
- Table 21: Benelux USA Office Real Estate Industry Revenue (billion) Forecast, by Application 2020 & 2033
- Table 22: Nordics USA Office Real Estate Industry Revenue (billion) Forecast, by Application 2020 & 2033
- Table 23: Rest of Europe USA Office Real Estate Industry Revenue (billion) Forecast, by Application 2020 & 2033
- Table 24: Global USA Office Real Estate Industry Revenue billion Forecast, by Sector 2020 & 2033
- Table 25: Global USA Office Real Estate Industry Revenue billion Forecast, by Country 2020 & 2033
- Table 26: Turkey USA Office Real Estate Industry Revenue (billion) Forecast, by Application 2020 & 2033
- Table 27: Israel USA Office Real Estate Industry Revenue (billion) Forecast, by Application 2020 & 2033
- Table 28: GCC USA Office Real Estate Industry Revenue (billion) Forecast, by Application 2020 & 2033
- Table 29: North Africa USA Office Real Estate Industry Revenue (billion) Forecast, by Application 2020 & 2033
- Table 30: South Africa USA Office Real Estate Industry Revenue (billion) Forecast, by Application 2020 & 2033
- Table 31: Rest of Middle East & Africa USA Office Real Estate Industry Revenue (billion) Forecast, by Application 2020 & 2033
- Table 32: Global USA Office Real Estate Industry Revenue billion Forecast, by Sector 2020 & 2033
- Table 33: Global USA Office Real Estate Industry Revenue billion Forecast, by Country 2020 & 2033
- Table 34: China USA Office Real Estate Industry Revenue (billion) Forecast, by Application 2020 & 2033
- Table 35: India USA Office Real Estate Industry Revenue (billion) Forecast, by Application 2020 & 2033
- Table 36: Japan USA Office Real Estate Industry Revenue (billion) Forecast, by Application 2020 & 2033
- Table 37: South Korea USA Office Real Estate Industry Revenue (billion) Forecast, by Application 2020 & 2033
- Table 38: ASEAN USA Office Real Estate Industry Revenue (billion) Forecast, by Application 2020 & 2033
- Table 39: Oceania USA Office Real Estate Industry Revenue (billion) Forecast, by Application 2020 & 2033
- Table 40: Rest of Asia Pacific USA Office Real Estate Industry Revenue (billion) Forecast, by Application 2020 & 2033
Frequently Asked Questions
1. What is the projected Compound Annual Growth Rate (CAGR) of the USA Office Real Estate Industry?
The projected CAGR is approximately 7.1%.
2. Which companies are prominent players in the USA Office Real Estate Industry?
Key companies in the market include Hitt Contracting, Kiewit Corporation, Gilbane Building Co, B L Harbert International, Hensel Phelps Construction, Ryan Companies US Inc, Skanska USA Inc, Turner Construction Company Inc, Trammell Crow Company, Clayco Inc, Dpr Construction, PCL Construction Enterprises, Structure Tone LLC**List Not Exhaustive.
3. What are the main segments of the USA Office Real Estate Industry?
The market segments include Sector.
4. Can you provide details about the market size?
The market size is estimated to be USD 4332.38 billion as of 2022.
5. What are some drivers contributing to market growth?
Increasing Disposable Income and Middle-Class Expansion; Increased Awareness of Roofing Solutions.
6. What are the notable trends driving market growth?
Increase in Leasing Volumes.
7. Are there any restraints impacting market growth?
The presence of counterfeit or substandard roofing materials in the market poses a significant challenge; The roofing industry faces a shortage of skilled labor.
8. Can you provide examples of recent developments in the market?
N/A
9. What pricing options are available for accessing the report?
Pricing options include single-user, multi-user, and enterprise licenses priced at USD 3800, USD 4500, and USD 5800 respectively.
10. Is the market size provided in terms of value or volume?
The market size is provided in terms of value, measured in billion.
11. Are there any specific market keywords associated with the report?
Yes, the market keyword associated with the report is "USA Office Real Estate Industry," which aids in identifying and referencing the specific market segment covered.
12. How do I determine which pricing option suits my needs best?
The pricing options vary based on user requirements and access needs. Individual users may opt for single-user licenses, while businesses requiring broader access may choose multi-user or enterprise licenses for cost-effective access to the report.
13. Are there any additional resources or data provided in the USA Office Real Estate Industry report?
While the report offers comprehensive insights, it's advisable to review the specific contents or supplementary materials provided to ascertain if additional resources or data are available.
14. How can I stay updated on further developments or reports in the USA Office Real Estate Industry?
To stay informed about further developments, trends, and reports in the USA Office Real Estate Industry, consider subscribing to industry newsletters, following relevant companies and organizations, or regularly checking reputable industry news sources and publications.
Methodology
Step 1 - Identification of Relevant Samples Size from Population Database


Step 2 - Approaches for Defining Global Market Size (Value, Volume* & Price*)

Note*: In applicable scenarios
Step 3 - Data Sources
Primary Research
- Web Analytics
- Survey Reports
- Research Institute
- Latest Research Reports
- Opinion Leaders
Secondary Research
- Annual Reports
- White Paper
- Latest Press Release
- Industry Association
- Paid Database
- Investor Presentations

Step 4 - Data Triangulation
Involves using different sources of information in order to increase the validity of a study
These sources are likely to be stakeholders in a program - participants, other researchers, program staff, other community members, and so on.
Then we put all data in single framework & apply various statistical tools to find out the dynamic on the market.
During the analysis stage, feedback from the stakeholder groups would be compared to determine areas of agreement as well as areas of divergence

