
Key Insights
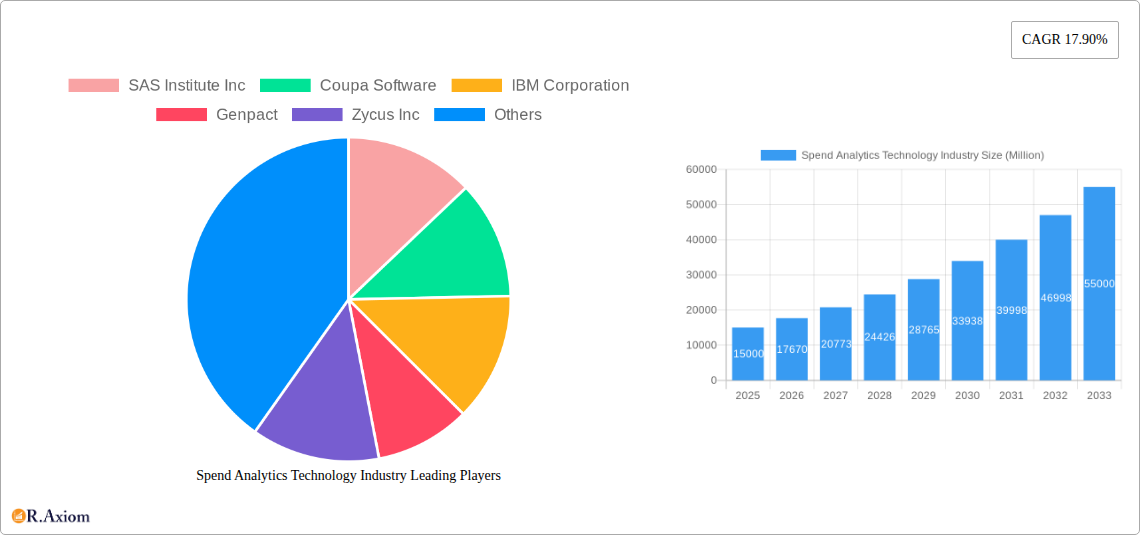
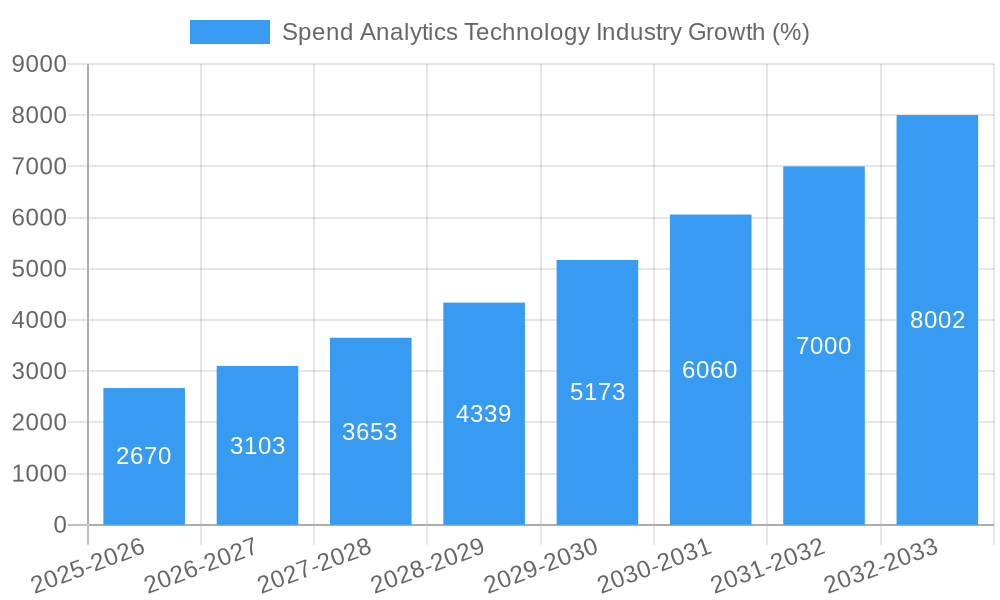
The Spend Analytics Technology market is experiencing robust growth, projected to reach a substantial size by 2033. A compound annual growth rate (CAGR) of 17.90% from 2025 to 2033 signifies significant market expansion driven by several key factors. The increasing need for enhanced procurement efficiency and cost optimization across various industries, particularly Manufacturing, Supply Chain & Logistics, and BFSI (Banking, Financial Services, and Insurance), fuels this growth. Businesses are leveraging spend analytics to gain better visibility into their spending patterns, identify cost savings opportunities, and improve supplier relationships. The shift towards cloud-based deployment models further contributes to market expansion, offering scalability and accessibility benefits to organizations of all sizes. Predictive analytics capabilities within spend analytics platforms are gaining traction, enabling businesses to forecast future spending and proactively manage risks. Competitive pressures and the drive to improve profitability are also major catalysts for adoption. While data security concerns and the initial investment costs for implementing spend analytics solutions pose some challenges, the long-term benefits significantly outweigh these hurdles, resulting in strong market momentum.
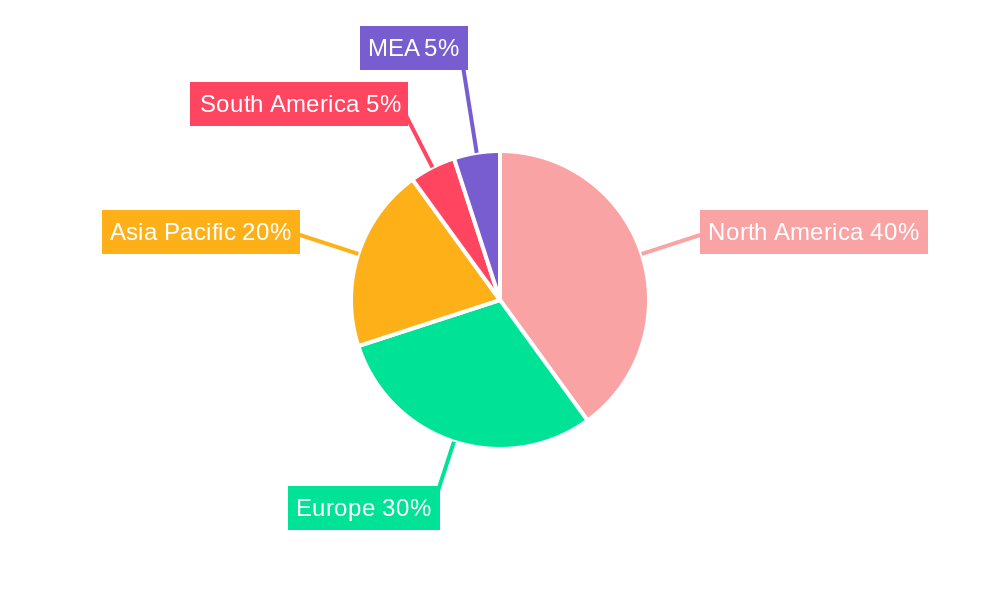
The market segmentation reveals a diverse landscape. Software solutions constitute a significant portion of the market, followed by services that provide implementation, support, and consulting. Descriptive, prescriptive, and predictive analytics capabilities are integrated into different solutions to address various business needs. Geographical distribution shows a concentration in North America and Europe, with significant growth potential in the Asia-Pacific region driven by increasing digitalization and economic expansion. Key players like SAS Institute Inc., Coupa Software, IBM Corporation, and others are constantly innovating to cater to evolving market demands, fostering competition and driving technological advancements within the spend analytics space. This dynamic environment underscores a positive outlook for continued expansion in the coming years, particularly as more businesses recognize the strategic value of data-driven procurement optimization.
Spend Analytics Technology Industry: A Comprehensive Market Report (2019-2033)
This comprehensive report provides a detailed analysis of the Spend Analytics Technology industry, offering invaluable insights for stakeholders, investors, and industry professionals. The report covers the period from 2019 to 2033, with a focus on the 2025 market, encompassing historical data, current trends, and future projections. The global Spend Analytics Technology market is projected to reach xx Million by 2033, exhibiting a Compound Annual Growth Rate (CAGR) of xx% during the forecast period (2025-2033).
Spend Analytics Technology Industry Market Concentration & Innovation
The Spend Analytics Technology market exhibits a moderately concentrated landscape, with key players like SAS Institute Inc, Coupa Software, IBM Corporation, Genpact, Zycus Inc, Oracle Corporation, Empronc Solutions Pvt Ltd, JAGGAER Incorporation, Sievo Oy, Proactis Inc, and SAP SE holding significant market share. However, the market also accommodates several smaller, specialized players, fostering innovation.
Market share distribution among these key players in 2024 is estimated as follows: SAS Institute Inc (xx%), Coupa Software (xx%), IBM Corporation (xx%), and other players (xx%). This signifies a dynamic competitive environment. Mergers and acquisitions (M&A) activity has been a significant driver of market consolidation, with deals exceeding xx Million in value in recent years. For instance, SAP SE's acquisition of Askdata in July 2022 and JAGGAER's acquisition of DocSkiff Inc. in February 2022 highlight this trend. These deals reflect a focus on enhancing AI capabilities and contract analysis functionalities. The regulatory landscape, though generally supportive of technological advancements, faces ongoing scrutiny regarding data privacy and security, impacting vendor strategies. Product substitutes, mainly encompassing in-house solutions and legacy systems, continue to pose a challenge, albeit a diminishing one given the value proposition of specialized spend analytics tools. End-user trends indicate a growing preference for cloud-based solutions and AI-driven predictive analytics.
Spend Analytics Technology Industry Industry Trends & Insights
The Spend Analytics Technology market is experiencing robust growth, driven primarily by the increasing need for enhanced procurement visibility, cost optimization, and data-driven decision-making across various industries. The global market size in 2024 is estimated to be xx Million and is projected to grow significantly over the forecast period, reaching xx Million by 2033. This growth reflects a heightened awareness of the strategic value of spend analytics in maximizing efficiency and profitability. Technological disruptions, specifically the integration of AI and machine learning, are transforming the market. AI-powered predictive analytics are improving forecasting accuracy and risk mitigation. Consumer preferences increasingly lean toward cloud-based, user-friendly solutions that provide real-time insights and seamless integration with existing enterprise resource planning (ERP) systems. The competitive dynamics are characterized by intense rivalry among established players and emerging startups, driving innovation and continuous improvement in product offerings. Market penetration of spend analytics solutions remains relatively low across many industries, indicating significant untapped potential for future growth.
Dominant Markets & Segments in Spend Analytics Technology Industry
- By End-user Industry: The Manufacturing, Supply Chain & Logistics, and Retail sectors currently represent the largest segments in terms of adoption and spending. These industries have complex procurement processes and a high volume of transactions, making them ideal candidates for spend analytics solutions. Strong economic activity and continuous improvement initiatives within these sectors fuel growth.
- By Type: The Software segment dominates, reflecting the prevalence of software-based platforms for spend analytics. However, the Service segment is witnessing significant growth as businesses increasingly seek expert consultation and implementation support.
- By Analysis: Predictive analytics is a rapidly expanding segment, attracting significant investment due to its potential for enhanced forecasting and risk management.
- By Deployment: Cloud-based deployments are gaining traction due to their scalability, cost-effectiveness, and accessibility. However, on-premise deployments still remain relevant for businesses with stringent security requirements or specific integration needs.
The North American region currently holds the largest market share, driven by factors such as high technological adoption rates, advanced digital infrastructure, and significant investments in enterprise software.
Spend Analytics Technology Industry Product Developments
Recent product innovations focus on enhancing AI capabilities, improving user experience, and expanding integration options. New applications are emerging in areas such as supplier risk management, contract lifecycle management, and sustainability reporting. Key competitive advantages include superior AI algorithms, robust data visualization tools, and seamless integration with various ERP systems. The market is witnessing a significant shift towards cloud-based, SaaS solutions, offering greater scalability, accessibility, and cost-effectiveness.
Report Scope & Segmentation Analysis
This report segments the Spend Analytics Technology market based on end-user industry (Manufacturing, Supply Chain & Logistics, Retail, BFSI, IT & Telecommunication, Education, Healthcare, Other End-user Industries), type (Software, Service), analysis type (Descriptive, Prescriptive, Predictive), and deployment mode (On-Premise, Cloud). Each segment's growth projection, market size, and competitive dynamics are analyzed. The report provides a comprehensive understanding of market trends across each category. For instance, the cloud deployment segment is projected to experience significant growth due to increased adoption of cloud-based solutions.
Key Drivers of Spend Analytics Technology Industry Growth
Several factors are driving the growth of the Spend Analytics Technology industry. These include the increasing need for cost optimization and efficiency improvements across businesses, advancements in AI and machine learning technologies enabling more accurate predictive analytics, the growing adoption of cloud-based solutions, and supportive regulatory frameworks promoting transparency and accountability in procurement processes. Government initiatives focused on digital transformation across industries are further accelerating adoption.
Challenges in the Spend Analytics Technology Industry Sector
The industry faces challenges such as the high cost of implementation and maintenance of spend analytics solutions, the need for robust data integration capabilities across various systems, and concerns regarding data security and privacy. The complexity of integrating spend analytics solutions with legacy systems poses significant implementation challenges, limiting adoption in some organizations. Competition among providers also exerts downward pressure on pricing.
Emerging Opportunities in Spend Analytics Technology Industry
Emerging opportunities lie in the expansion of spend analytics solutions into new industries, such as the public sector and non-profit organizations. The integration of blockchain technology for improved supply chain transparency and the development of more sophisticated predictive models based on advanced analytics are other key opportunities. The increasing demand for sustainable procurement practices also presents opportunities for vendors offering solutions with integrated sustainability reporting capabilities.
Leading Players in the Spend Analytics Technology Industry Market
- SAS Institute Inc
- Coupa Software
- IBM Corporation
- Genpact
- Zycus Inc
- Oracle Corporation
- Empronc Solutions Pvt Ltd
- JAGGAER Incorporation
- Sievo Oy
- Proactis Inc
- SAP SE
Key Developments in Spend Analytics Technology Industry Industry
- July 2022: SAP SE acquired Askdata, enhancing its AI-driven natural language search capabilities for spend analytics.
- February 2022: JAGGAER acquired DocSkiff Inc., integrating AI-powered contract analysis into its platform.
Strategic Outlook for Spend Analytics Technology Market
The Spend Analytics Technology market is poised for continued growth, driven by increasing adoption across various industries, technological advancements, and the growing need for data-driven decision-making. The future potential is substantial, particularly in emerging markets and industries with complex procurement processes. Further innovation in AI and machine learning will significantly shape market dynamics, leading to more sophisticated and user-friendly solutions.
Spend Analytics Technology Industry Segmentation
-
1. Type
- 1.1. Software
-
1.2. Service
- 1.2.1. Professional Service
- 1.2.2. Managed Service
-
2. Analysis
- 2.1. Descriptive
- 2.2. Prescriptive
- 2.3. Predictive
-
3. Deployment
- 3.1. On-Premise
- 3.2. Cloud
-
4. End-user Industry
- 4.1. Manufacturing
- 4.2. Supply Chain & Logistic
- 4.3. Retail
- 4.4. BFSI
- 4.5. IT & Telecommunication
- 4.6. Education
- 4.7. Healthcare
- 4.8. Other End-user Industries
Spend Analytics Technology Industry Segmentation By Geography
- 1. North America
- 2. Europe
- 3. Asia Pacific
- 4. Latin America
- 5. Middle East
Spend Analytics Technology Industry REPORT HIGHLIGHTS
| Aspects | Details |
|---|---|
| Study Period | 2019-2033 |
| Base Year | 2024 |
| Estimated Year | 2025 |
| Forecast Period | 2025-2033 |
| Historical Period | 2019-2024 |
| Growth Rate | CAGR of 17.90% from 2019-2033 |
| Segmentation |
|
Table of Contents
- 1. Introduction
- 1.1. Research Scope
- 1.2. Market Segmentation
- 1.3. Research Methodology
- 1.4. Definitions and Assumptions
- 2. Executive Summary
- 2.1. Introduction
- 3. Market Dynamics
- 3.1. Introduction
- 3.2. Market Drivers
- 3.2.1. Rising Adoption in Procurement Process in Industries; Rising Adoption of Cloud Services and Increasing Penetration of IoT Applications
- 3.3. Market Restrains
- 3.3.1. Growing Data Breaches Cases
- 3.4. Market Trends
- 3.4.1. Retail Segment is Expected to Hold Significant Share
- 4. Market Factor Analysis
- 4.1. Porters Five Forces
- 4.2. Supply/Value Chain
- 4.3. PESTEL analysis
- 4.4. Market Entropy
- 4.5. Patent/Trademark Analysis
- 5. Global Spend Analytics Technology Industry Analysis, Insights and Forecast, 2019-2031
- 5.1. Market Analysis, Insights and Forecast - by Type
- 5.1.1. Software
- 5.1.2. Service
- 5.1.2.1. Professional Service
- 5.1.2.2. Managed Service
- 5.2. Market Analysis, Insights and Forecast - by Analysis
- 5.2.1. Descriptive
- 5.2.2. Prescriptive
- 5.2.3. Predictive
- 5.3. Market Analysis, Insights and Forecast - by Deployment
- 5.3.1. On-Premise
- 5.3.2. Cloud
- 5.4. Market Analysis, Insights and Forecast - by End-user Industry
- 5.4.1. Manufacturing
- 5.4.2. Supply Chain & Logistic
- 5.4.3. Retail
- 5.4.4. BFSI
- 5.4.5. IT & Telecommunication
- 5.4.6. Education
- 5.4.7. Healthcare
- 5.4.8. Other End-user Industries
- 5.5. Market Analysis, Insights and Forecast - by Region
- 5.5.1. North America
- 5.5.2. Europe
- 5.5.3. Asia Pacific
- 5.5.4. Latin America
- 5.5.5. Middle East
- 5.1. Market Analysis, Insights and Forecast - by Type
- 6. North America Spend Analytics Technology Industry Analysis, Insights and Forecast, 2019-2031
- 6.1. Market Analysis, Insights and Forecast - by Type
- 6.1.1. Software
- 6.1.2. Service
- 6.1.2.1. Professional Service
- 6.1.2.2. Managed Service
- 6.2. Market Analysis, Insights and Forecast - by Analysis
- 6.2.1. Descriptive
- 6.2.2. Prescriptive
- 6.2.3. Predictive
- 6.3. Market Analysis, Insights and Forecast - by Deployment
- 6.3.1. On-Premise
- 6.3.2. Cloud
- 6.4. Market Analysis, Insights and Forecast - by End-user Industry
- 6.4.1. Manufacturing
- 6.4.2. Supply Chain & Logistic
- 6.4.3. Retail
- 6.4.4. BFSI
- 6.4.5. IT & Telecommunication
- 6.4.6. Education
- 6.4.7. Healthcare
- 6.4.8. Other End-user Industries
- 6.1. Market Analysis, Insights and Forecast - by Type
- 7. Europe Spend Analytics Technology Industry Analysis, Insights and Forecast, 2019-2031
- 7.1. Market Analysis, Insights and Forecast - by Type
- 7.1.1. Software
- 7.1.2. Service
- 7.1.2.1. Professional Service
- 7.1.2.2. Managed Service
- 7.2. Market Analysis, Insights and Forecast - by Analysis
- 7.2.1. Descriptive
- 7.2.2. Prescriptive
- 7.2.3. Predictive
- 7.3. Market Analysis, Insights and Forecast - by Deployment
- 7.3.1. On-Premise
- 7.3.2. Cloud
- 7.4. Market Analysis, Insights and Forecast - by End-user Industry
- 7.4.1. Manufacturing
- 7.4.2. Supply Chain & Logistic
- 7.4.3. Retail
- 7.4.4. BFSI
- 7.4.5. IT & Telecommunication
- 7.4.6. Education
- 7.4.7. Healthcare
- 7.4.8. Other End-user Industries
- 7.1. Market Analysis, Insights and Forecast - by Type
- 8. Asia Pacific Spend Analytics Technology Industry Analysis, Insights and Forecast, 2019-2031
- 8.1. Market Analysis, Insights and Forecast - by Type
- 8.1.1. Software
- 8.1.2. Service
- 8.1.2.1. Professional Service
- 8.1.2.2. Managed Service
- 8.2. Market Analysis, Insights and Forecast - by Analysis
- 8.2.1. Descriptive
- 8.2.2. Prescriptive
- 8.2.3. Predictive
- 8.3. Market Analysis, Insights and Forecast - by Deployment
- 8.3.1. On-Premise
- 8.3.2. Cloud
- 8.4. Market Analysis, Insights and Forecast - by End-user Industry
- 8.4.1. Manufacturing
- 8.4.2. Supply Chain & Logistic
- 8.4.3. Retail
- 8.4.4. BFSI
- 8.4.5. IT & Telecommunication
- 8.4.6. Education
- 8.4.7. Healthcare
- 8.4.8. Other End-user Industries
- 8.1. Market Analysis, Insights and Forecast - by Type
- 9. Latin America Spend Analytics Technology Industry Analysis, Insights and Forecast, 2019-2031
- 9.1. Market Analysis, Insights and Forecast - by Type
- 9.1.1. Software
- 9.1.2. Service
- 9.1.2.1. Professional Service
- 9.1.2.2. Managed Service
- 9.2. Market Analysis, Insights and Forecast - by Analysis
- 9.2.1. Descriptive
- 9.2.2. Prescriptive
- 9.2.3. Predictive
- 9.3. Market Analysis, Insights and Forecast - by Deployment
- 9.3.1. On-Premise
- 9.3.2. Cloud
- 9.4. Market Analysis, Insights and Forecast - by End-user Industry
- 9.4.1. Manufacturing
- 9.4.2. Supply Chain & Logistic
- 9.4.3. Retail
- 9.4.4. BFSI
- 9.4.5. IT & Telecommunication
- 9.4.6. Education
- 9.4.7. Healthcare
- 9.4.8. Other End-user Industries
- 9.1. Market Analysis, Insights and Forecast - by Type
- 10. Middle East Spend Analytics Technology Industry Analysis, Insights and Forecast, 2019-2031
- 10.1. Market Analysis, Insights and Forecast - by Type
- 10.1.1. Software
- 10.1.2. Service
- 10.1.2.1. Professional Service
- 10.1.2.2. Managed Service
- 10.2. Market Analysis, Insights and Forecast - by Analysis
- 10.2.1. Descriptive
- 10.2.2. Prescriptive
- 10.2.3. Predictive
- 10.3. Market Analysis, Insights and Forecast - by Deployment
- 10.3.1. On-Premise
- 10.3.2. Cloud
- 10.4. Market Analysis, Insights and Forecast - by End-user Industry
- 10.4.1. Manufacturing
- 10.4.2. Supply Chain & Logistic
- 10.4.3. Retail
- 10.4.4. BFSI
- 10.4.5. IT & Telecommunication
- 10.4.6. Education
- 10.4.7. Healthcare
- 10.4.8. Other End-user Industries
- 10.1. Market Analysis, Insights and Forecast - by Type
- 11. North America Spend Analytics Technology Industry Analysis, Insights and Forecast, 2019-2031
- 11.1. Market Analysis, Insights and Forecast - By Country/Sub-region
- 11.1.1 United States
- 11.1.2 Canada
- 11.1.3 Mexico
- 12. Europe Spend Analytics Technology Industry Analysis, Insights and Forecast, 2019-2031
- 12.1. Market Analysis, Insights and Forecast - By Country/Sub-region
- 12.1.1 Germany
- 12.1.2 United Kingdom
- 12.1.3 France
- 12.1.4 Spain
- 12.1.5 Italy
- 12.1.6 Spain
- 12.1.7 Belgium
- 12.1.8 Netherland
- 12.1.9 Nordics
- 12.1.10 Rest of Europe
- 13. Asia Pacific Spend Analytics Technology Industry Analysis, Insights and Forecast, 2019-2031
- 13.1. Market Analysis, Insights and Forecast - By Country/Sub-region
- 13.1.1 China
- 13.1.2 Japan
- 13.1.3 India
- 13.1.4 South Korea
- 13.1.5 Southeast Asia
- 13.1.6 Australia
- 13.1.7 Indonesia
- 13.1.8 Phillipes
- 13.1.9 Singapore
- 13.1.10 Thailandc
- 13.1.11 Rest of Asia Pacific
- 14. South America Spend Analytics Technology Industry Analysis, Insights and Forecast, 2019-2031
- 14.1. Market Analysis, Insights and Forecast - By Country/Sub-region
- 14.1.1 Brazil
- 14.1.2 Argentina
- 14.1.3 Peru
- 14.1.4 Chile
- 14.1.5 Colombia
- 14.1.6 Ecuador
- 14.1.7 Venezuela
- 14.1.8 Rest of South America
- 15. North America Spend Analytics Technology Industry Analysis, Insights and Forecast, 2019-2031
- 15.1. Market Analysis, Insights and Forecast - By Country/Sub-region
- 15.1.1 United States
- 15.1.2 Canada
- 15.1.3 Mexico
- 16. MEA Spend Analytics Technology Industry Analysis, Insights and Forecast, 2019-2031
- 16.1. Market Analysis, Insights and Forecast - By Country/Sub-region
- 16.1.1 United Arab Emirates
- 16.1.2 Saudi Arabia
- 16.1.3 South Africa
- 16.1.4 Rest of Middle East and Africa
- 17. Competitive Analysis
- 17.1. Global Market Share Analysis 2024
- 17.2. Company Profiles
- 17.2.1 SAS Institute Inc
- 17.2.1.1. Overview
- 17.2.1.2. Products
- 17.2.1.3. SWOT Analysis
- 17.2.1.4. Recent Developments
- 17.2.1.5. Financials (Based on Availability)
- 17.2.2 Coupa Software
- 17.2.2.1. Overview
- 17.2.2.2. Products
- 17.2.2.3. SWOT Analysis
- 17.2.2.4. Recent Developments
- 17.2.2.5. Financials (Based on Availability)
- 17.2.3 IBM Corporation
- 17.2.3.1. Overview
- 17.2.3.2. Products
- 17.2.3.3. SWOT Analysis
- 17.2.3.4. Recent Developments
- 17.2.3.5. Financials (Based on Availability)
- 17.2.4 Genpact
- 17.2.4.1. Overview
- 17.2.4.2. Products
- 17.2.4.3. SWOT Analysis
- 17.2.4.4. Recent Developments
- 17.2.4.5. Financials (Based on Availability)
- 17.2.5 Zycus Inc
- 17.2.5.1. Overview
- 17.2.5.2. Products
- 17.2.5.3. SWOT Analysis
- 17.2.5.4. Recent Developments
- 17.2.5.5. Financials (Based on Availability)
- 17.2.6 Oracle Corporation
- 17.2.6.1. Overview
- 17.2.6.2. Products
- 17.2.6.3. SWOT Analysis
- 17.2.6.4. Recent Developments
- 17.2.6.5. Financials (Based on Availability)
- 17.2.7 Empronc Solutions Pvt Ltd
- 17.2.7.1. Overview
- 17.2.7.2. Products
- 17.2.7.3. SWOT Analysis
- 17.2.7.4. Recent Developments
- 17.2.7.5. Financials (Based on Availability)
- 17.2.8 JAGGAER Incorporation
- 17.2.8.1. Overview
- 17.2.8.2. Products
- 17.2.8.3. SWOT Analysis
- 17.2.8.4. Recent Developments
- 17.2.8.5. Financials (Based on Availability)
- 17.2.9 Sievo Oy*List Not Exhaustive
- 17.2.9.1. Overview
- 17.2.9.2. Products
- 17.2.9.3. SWOT Analysis
- 17.2.9.4. Recent Developments
- 17.2.9.5. Financials (Based on Availability)
- 17.2.10 Proactis Inc
- 17.2.10.1. Overview
- 17.2.10.2. Products
- 17.2.10.3. SWOT Analysis
- 17.2.10.4. Recent Developments
- 17.2.10.5. Financials (Based on Availability)
- 17.2.11 SAP SE
- 17.2.11.1. Overview
- 17.2.11.2. Products
- 17.2.11.3. SWOT Analysis
- 17.2.11.4. Recent Developments
- 17.2.11.5. Financials (Based on Availability)
- 17.2.1 SAS Institute Inc
List of Figures
- Figure 1: Global Spend Analytics Technology Industry Revenue Breakdown (Million, %) by Region 2024 & 2032
- Figure 2: North America Spend Analytics Technology Industry Revenue (Million), by Country 2024 & 2032
- Figure 3: North America Spend Analytics Technology Industry Revenue Share (%), by Country 2024 & 2032
- Figure 4: Europe Spend Analytics Technology Industry Revenue (Million), by Country 2024 & 2032
- Figure 5: Europe Spend Analytics Technology Industry Revenue Share (%), by Country 2024 & 2032
- Figure 6: Asia Pacific Spend Analytics Technology Industry Revenue (Million), by Country 2024 & 2032
- Figure 7: Asia Pacific Spend Analytics Technology Industry Revenue Share (%), by Country 2024 & 2032
- Figure 8: South America Spend Analytics Technology Industry Revenue (Million), by Country 2024 & 2032
- Figure 9: South America Spend Analytics Technology Industry Revenue Share (%), by Country 2024 & 2032
- Figure 10: North America Spend Analytics Technology Industry Revenue (Million), by Country 2024 & 2032
- Figure 11: North America Spend Analytics Technology Industry Revenue Share (%), by Country 2024 & 2032
- Figure 12: MEA Spend Analytics Technology Industry Revenue (Million), by Country 2024 & 2032
- Figure 13: MEA Spend Analytics Technology Industry Revenue Share (%), by Country 2024 & 2032
- Figure 14: North America Spend Analytics Technology Industry Revenue (Million), by Type 2024 & 2032
- Figure 15: North America Spend Analytics Technology Industry Revenue Share (%), by Type 2024 & 2032
- Figure 16: North America Spend Analytics Technology Industry Revenue (Million), by Analysis 2024 & 2032
- Figure 17: North America Spend Analytics Technology Industry Revenue Share (%), by Analysis 2024 & 2032
- Figure 18: North America Spend Analytics Technology Industry Revenue (Million), by Deployment 2024 & 2032
- Figure 19: North America Spend Analytics Technology Industry Revenue Share (%), by Deployment 2024 & 2032
- Figure 20: North America Spend Analytics Technology Industry Revenue (Million), by End-user Industry 2024 & 2032
- Figure 21: North America Spend Analytics Technology Industry Revenue Share (%), by End-user Industry 2024 & 2032
- Figure 22: North America Spend Analytics Technology Industry Revenue (Million), by Country 2024 & 2032
- Figure 23: North America Spend Analytics Technology Industry Revenue Share (%), by Country 2024 & 2032
- Figure 24: Europe Spend Analytics Technology Industry Revenue (Million), by Type 2024 & 2032
- Figure 25: Europe Spend Analytics Technology Industry Revenue Share (%), by Type 2024 & 2032
- Figure 26: Europe Spend Analytics Technology Industry Revenue (Million), by Analysis 2024 & 2032
- Figure 27: Europe Spend Analytics Technology Industry Revenue Share (%), by Analysis 2024 & 2032
- Figure 28: Europe Spend Analytics Technology Industry Revenue (Million), by Deployment 2024 & 2032
- Figure 29: Europe Spend Analytics Technology Industry Revenue Share (%), by Deployment 2024 & 2032
- Figure 30: Europe Spend Analytics Technology Industry Revenue (Million), by End-user Industry 2024 & 2032
- Figure 31: Europe Spend Analytics Technology Industry Revenue Share (%), by End-user Industry 2024 & 2032
- Figure 32: Europe Spend Analytics Technology Industry Revenue (Million), by Country 2024 & 2032
- Figure 33: Europe Spend Analytics Technology Industry Revenue Share (%), by Country 2024 & 2032
- Figure 34: Asia Pacific Spend Analytics Technology Industry Revenue (Million), by Type 2024 & 2032
- Figure 35: Asia Pacific Spend Analytics Technology Industry Revenue Share (%), by Type 2024 & 2032
- Figure 36: Asia Pacific Spend Analytics Technology Industry Revenue (Million), by Analysis 2024 & 2032
- Figure 37: Asia Pacific Spend Analytics Technology Industry Revenue Share (%), by Analysis 2024 & 2032
- Figure 38: Asia Pacific Spend Analytics Technology Industry Revenue (Million), by Deployment 2024 & 2032
- Figure 39: Asia Pacific Spend Analytics Technology Industry Revenue Share (%), by Deployment 2024 & 2032
- Figure 40: Asia Pacific Spend Analytics Technology Industry Revenue (Million), by End-user Industry 2024 & 2032
- Figure 41: Asia Pacific Spend Analytics Technology Industry Revenue Share (%), by End-user Industry 2024 & 2032
- Figure 42: Asia Pacific Spend Analytics Technology Industry Revenue (Million), by Country 2024 & 2032
- Figure 43: Asia Pacific Spend Analytics Technology Industry Revenue Share (%), by Country 2024 & 2032
- Figure 44: Latin America Spend Analytics Technology Industry Revenue (Million), by Type 2024 & 2032
- Figure 45: Latin America Spend Analytics Technology Industry Revenue Share (%), by Type 2024 & 2032
- Figure 46: Latin America Spend Analytics Technology Industry Revenue (Million), by Analysis 2024 & 2032
- Figure 47: Latin America Spend Analytics Technology Industry Revenue Share (%), by Analysis 2024 & 2032
- Figure 48: Latin America Spend Analytics Technology Industry Revenue (Million), by Deployment 2024 & 2032
- Figure 49: Latin America Spend Analytics Technology Industry Revenue Share (%), by Deployment 2024 & 2032
- Figure 50: Latin America Spend Analytics Technology Industry Revenue (Million), by End-user Industry 2024 & 2032
- Figure 51: Latin America Spend Analytics Technology Industry Revenue Share (%), by End-user Industry 2024 & 2032
- Figure 52: Latin America Spend Analytics Technology Industry Revenue (Million), by Country 2024 & 2032
- Figure 53: Latin America Spend Analytics Technology Industry Revenue Share (%), by Country 2024 & 2032
- Figure 54: Middle East Spend Analytics Technology Industry Revenue (Million), by Type 2024 & 2032
- Figure 55: Middle East Spend Analytics Technology Industry Revenue Share (%), by Type 2024 & 2032
- Figure 56: Middle East Spend Analytics Technology Industry Revenue (Million), by Analysis 2024 & 2032
- Figure 57: Middle East Spend Analytics Technology Industry Revenue Share (%), by Analysis 2024 & 2032
- Figure 58: Middle East Spend Analytics Technology Industry Revenue (Million), by Deployment 2024 & 2032
- Figure 59: Middle East Spend Analytics Technology Industry Revenue Share (%), by Deployment 2024 & 2032
- Figure 60: Middle East Spend Analytics Technology Industry Revenue (Million), by End-user Industry 2024 & 2032
- Figure 61: Middle East Spend Analytics Technology Industry Revenue Share (%), by End-user Industry 2024 & 2032
- Figure 62: Middle East Spend Analytics Technology Industry Revenue (Million), by Country 2024 & 2032
- Figure 63: Middle East Spend Analytics Technology Industry Revenue Share (%), by Country 2024 & 2032
List of Tables
- Table 1: Global Spend Analytics Technology Industry Revenue Million Forecast, by Region 2019 & 2032
- Table 2: Global Spend Analytics Technology Industry Revenue Million Forecast, by Type 2019 & 2032
- Table 3: Global Spend Analytics Technology Industry Revenue Million Forecast, by Analysis 2019 & 2032
- Table 4: Global Spend Analytics Technology Industry Revenue Million Forecast, by Deployment 2019 & 2032
- Table 5: Global Spend Analytics Technology Industry Revenue Million Forecast, by End-user Industry 2019 & 2032
- Table 6: Global Spend Analytics Technology Industry Revenue Million Forecast, by Region 2019 & 2032
- Table 7: Global Spend Analytics Technology Industry Revenue Million Forecast, by Country 2019 & 2032
- Table 8: United States Spend Analytics Technology Industry Revenue (Million) Forecast, by Application 2019 & 2032
- Table 9: Canada Spend Analytics Technology Industry Revenue (Million) Forecast, by Application 2019 & 2032
- Table 10: Mexico Spend Analytics Technology Industry Revenue (Million) Forecast, by Application 2019 & 2032
- Table 11: Global Spend Analytics Technology Industry Revenue Million Forecast, by Country 2019 & 2032
- Table 12: Germany Spend Analytics Technology Industry Revenue (Million) Forecast, by Application 2019 & 2032
- Table 13: United Kingdom Spend Analytics Technology Industry Revenue (Million) Forecast, by Application 2019 & 2032
- Table 14: France Spend Analytics Technology Industry Revenue (Million) Forecast, by Application 2019 & 2032
- Table 15: Spain Spend Analytics Technology Industry Revenue (Million) Forecast, by Application 2019 & 2032
- Table 16: Italy Spend Analytics Technology Industry Revenue (Million) Forecast, by Application 2019 & 2032
- Table 17: Spain Spend Analytics Technology Industry Revenue (Million) Forecast, by Application 2019 & 2032
- Table 18: Belgium Spend Analytics Technology Industry Revenue (Million) Forecast, by Application 2019 & 2032
- Table 19: Netherland Spend Analytics Technology Industry Revenue (Million) Forecast, by Application 2019 & 2032
- Table 20: Nordics Spend Analytics Technology Industry Revenue (Million) Forecast, by Application 2019 & 2032
- Table 21: Rest of Europe Spend Analytics Technology Industry Revenue (Million) Forecast, by Application 2019 & 2032
- Table 22: Global Spend Analytics Technology Industry Revenue Million Forecast, by Country 2019 & 2032
- Table 23: China Spend Analytics Technology Industry Revenue (Million) Forecast, by Application 2019 & 2032
- Table 24: Japan Spend Analytics Technology Industry Revenue (Million) Forecast, by Application 2019 & 2032
- Table 25: India Spend Analytics Technology Industry Revenue (Million) Forecast, by Application 2019 & 2032
- Table 26: South Korea Spend Analytics Technology Industry Revenue (Million) Forecast, by Application 2019 & 2032
- Table 27: Southeast Asia Spend Analytics Technology Industry Revenue (Million) Forecast, by Application 2019 & 2032
- Table 28: Australia Spend Analytics Technology Industry Revenue (Million) Forecast, by Application 2019 & 2032
- Table 29: Indonesia Spend Analytics Technology Industry Revenue (Million) Forecast, by Application 2019 & 2032
- Table 30: Phillipes Spend Analytics Technology Industry Revenue (Million) Forecast, by Application 2019 & 2032
- Table 31: Singapore Spend Analytics Technology Industry Revenue (Million) Forecast, by Application 2019 & 2032
- Table 32: Thailandc Spend Analytics Technology Industry Revenue (Million) Forecast, by Application 2019 & 2032
- Table 33: Rest of Asia Pacific Spend Analytics Technology Industry Revenue (Million) Forecast, by Application 2019 & 2032
- Table 34: Global Spend Analytics Technology Industry Revenue Million Forecast, by Country 2019 & 2032
- Table 35: Brazil Spend Analytics Technology Industry Revenue (Million) Forecast, by Application 2019 & 2032
- Table 36: Argentina Spend Analytics Technology Industry Revenue (Million) Forecast, by Application 2019 & 2032
- Table 37: Peru Spend Analytics Technology Industry Revenue (Million) Forecast, by Application 2019 & 2032
- Table 38: Chile Spend Analytics Technology Industry Revenue (Million) Forecast, by Application 2019 & 2032
- Table 39: Colombia Spend Analytics Technology Industry Revenue (Million) Forecast, by Application 2019 & 2032
- Table 40: Ecuador Spend Analytics Technology Industry Revenue (Million) Forecast, by Application 2019 & 2032
- Table 41: Venezuela Spend Analytics Technology Industry Revenue (Million) Forecast, by Application 2019 & 2032
- Table 42: Rest of South America Spend Analytics Technology Industry Revenue (Million) Forecast, by Application 2019 & 2032
- Table 43: Global Spend Analytics Technology Industry Revenue Million Forecast, by Country 2019 & 2032
- Table 44: United States Spend Analytics Technology Industry Revenue (Million) Forecast, by Application 2019 & 2032
- Table 45: Canada Spend Analytics Technology Industry Revenue (Million) Forecast, by Application 2019 & 2032
- Table 46: Mexico Spend Analytics Technology Industry Revenue (Million) Forecast, by Application 2019 & 2032
- Table 47: Global Spend Analytics Technology Industry Revenue Million Forecast, by Country 2019 & 2032
- Table 48: United Arab Emirates Spend Analytics Technology Industry Revenue (Million) Forecast, by Application 2019 & 2032
- Table 49: Saudi Arabia Spend Analytics Technology Industry Revenue (Million) Forecast, by Application 2019 & 2032
- Table 50: South Africa Spend Analytics Technology Industry Revenue (Million) Forecast, by Application 2019 & 2032
- Table 51: Rest of Middle East and Africa Spend Analytics Technology Industry Revenue (Million) Forecast, by Application 2019 & 2032
- Table 52: Global Spend Analytics Technology Industry Revenue Million Forecast, by Type 2019 & 2032
- Table 53: Global Spend Analytics Technology Industry Revenue Million Forecast, by Analysis 2019 & 2032
- Table 54: Global Spend Analytics Technology Industry Revenue Million Forecast, by Deployment 2019 & 2032
- Table 55: Global Spend Analytics Technology Industry Revenue Million Forecast, by End-user Industry 2019 & 2032
- Table 56: Global Spend Analytics Technology Industry Revenue Million Forecast, by Country 2019 & 2032
- Table 57: Global Spend Analytics Technology Industry Revenue Million Forecast, by Type 2019 & 2032
- Table 58: Global Spend Analytics Technology Industry Revenue Million Forecast, by Analysis 2019 & 2032
- Table 59: Global Spend Analytics Technology Industry Revenue Million Forecast, by Deployment 2019 & 2032
- Table 60: Global Spend Analytics Technology Industry Revenue Million Forecast, by End-user Industry 2019 & 2032
- Table 61: Global Spend Analytics Technology Industry Revenue Million Forecast, by Country 2019 & 2032
- Table 62: Global Spend Analytics Technology Industry Revenue Million Forecast, by Type 2019 & 2032
- Table 63: Global Spend Analytics Technology Industry Revenue Million Forecast, by Analysis 2019 & 2032
- Table 64: Global Spend Analytics Technology Industry Revenue Million Forecast, by Deployment 2019 & 2032
- Table 65: Global Spend Analytics Technology Industry Revenue Million Forecast, by End-user Industry 2019 & 2032
- Table 66: Global Spend Analytics Technology Industry Revenue Million Forecast, by Country 2019 & 2032
- Table 67: Global Spend Analytics Technology Industry Revenue Million Forecast, by Type 2019 & 2032
- Table 68: Global Spend Analytics Technology Industry Revenue Million Forecast, by Analysis 2019 & 2032
- Table 69: Global Spend Analytics Technology Industry Revenue Million Forecast, by Deployment 2019 & 2032
- Table 70: Global Spend Analytics Technology Industry Revenue Million Forecast, by End-user Industry 2019 & 2032
- Table 71: Global Spend Analytics Technology Industry Revenue Million Forecast, by Country 2019 & 2032
- Table 72: Global Spend Analytics Technology Industry Revenue Million Forecast, by Type 2019 & 2032
- Table 73: Global Spend Analytics Technology Industry Revenue Million Forecast, by Analysis 2019 & 2032
- Table 74: Global Spend Analytics Technology Industry Revenue Million Forecast, by Deployment 2019 & 2032
- Table 75: Global Spend Analytics Technology Industry Revenue Million Forecast, by End-user Industry 2019 & 2032
- Table 76: Global Spend Analytics Technology Industry Revenue Million Forecast, by Country 2019 & 2032
Frequently Asked Questions
1. What is the projected Compound Annual Growth Rate (CAGR) of the Spend Analytics Technology Industry?
The projected CAGR is approximately 17.90%.
2. Which companies are prominent players in the Spend Analytics Technology Industry?
Key companies in the market include SAS Institute Inc, Coupa Software, IBM Corporation, Genpact, Zycus Inc, Oracle Corporation, Empronc Solutions Pvt Ltd, JAGGAER Incorporation, Sievo Oy*List Not Exhaustive, Proactis Inc, SAP SE.
3. What are the main segments of the Spend Analytics Technology Industry?
The market segments include Type, Analysis, Deployment, End-user Industry.
4. Can you provide details about the market size?
The market size is estimated to be USD XX Million as of 2022.
5. What are some drivers contributing to market growth?
Rising Adoption in Procurement Process in Industries; Rising Adoption of Cloud Services and Increasing Penetration of IoT Applications.
6. What are the notable trends driving market growth?
Retail Segment is Expected to Hold Significant Share.
7. Are there any restraints impacting market growth?
Growing Data Breaches Cases.
8. Can you provide examples of recent developments in the market?
July 2022 - SAP SE announced the acquisition of Askdata, a startup specializing in search-driven analytics. SAP increases its capabilities to help enterprises make better-informed decisions by employing AI-driven natural language searches with the purchase of Askdata. Users may search, interact, and collaborate on real data to gain the most business insights.
9. What pricing options are available for accessing the report?
Pricing options include single-user, multi-user, and enterprise licenses priced at USD 4750, USD 5250, and USD 8750 respectively.
10. Is the market size provided in terms of value or volume?
The market size is provided in terms of value, measured in Million.
11. Are there any specific market keywords associated with the report?
Yes, the market keyword associated with the report is "Spend Analytics Technology Industry," which aids in identifying and referencing the specific market segment covered.
12. How do I determine which pricing option suits my needs best?
The pricing options vary based on user requirements and access needs. Individual users may opt for single-user licenses, while businesses requiring broader access may choose multi-user or enterprise licenses for cost-effective access to the report.
13. Are there any additional resources or data provided in the Spend Analytics Technology Industry report?
While the report offers comprehensive insights, it's advisable to review the specific contents or supplementary materials provided to ascertain if additional resources or data are available.
14. How can I stay updated on further developments or reports in the Spend Analytics Technology Industry?
To stay informed about further developments, trends, and reports in the Spend Analytics Technology Industry, consider subscribing to industry newsletters, following relevant companies and organizations, or regularly checking reputable industry news sources and publications.
Methodology
Step 1 - Identification of Relevant Samples Size from Population Database


Step 2 - Approaches for Defining Global Market Size (Value, Volume* & Price*)

Note*: In applicable scenarios
Step 3 - Data Sources
Primary Research
- Web Analytics
- Survey Reports
- Research Institute
- Latest Research Reports
- Opinion Leaders
Secondary Research
- Annual Reports
- White Paper
- Latest Press Release
- Industry Association
- Paid Database
- Investor Presentations

Step 4 - Data Triangulation
Involves using different sources of information in order to increase the validity of a study
These sources are likely to be stakeholders in a program - participants, other researchers, program staff, other community members, and so on.
Then we put all data in single framework & apply various statistical tools to find out the dynamic on the market.
During the analysis stage, feedback from the stakeholder groups would be compared to determine areas of agreement as well as areas of divergence


