
Key Insights
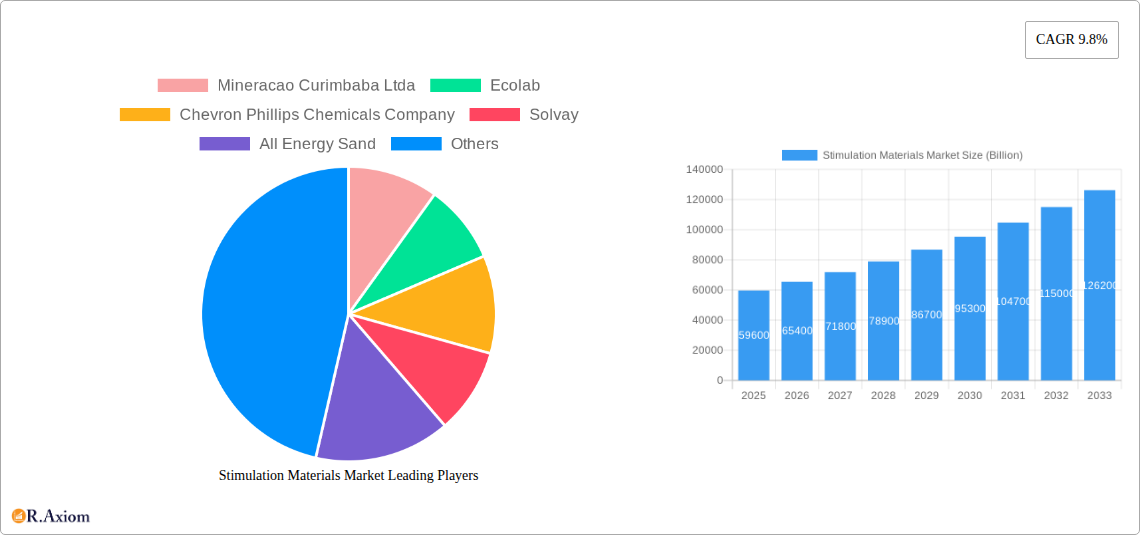
The global Stimulation Materials market, valued at $59.6 billion in 2025, is projected to experience robust growth, driven by a Compound Annual Growth Rate (CAGR) of 9.8% from 2025 to 2033. This expansion is fueled primarily by the increasing demand for oil and gas extraction, particularly in unconventional resources like shale gas and tight oil. Technological advancements in hydraulic fracturing techniques, leading to higher efficiency and effectiveness of stimulation treatments, are further bolstering market growth. The market is segmented by material type, primarily proppants (sand and ceramic) and chemicals used in the fracturing process. Proppants, crucial for maintaining fractures in the reservoir, dominate the market share due to their widespread use in various well completion strategies. However, the demand for ceramic proppants is expected to witness significant growth due to their superior strength and conductivity, particularly in high-pressure and high-temperature environments. Geographically, North America currently holds a substantial share, driven by extensive shale gas and oil production. However, Asia-Pacific and the Middle East are anticipated to showcase rapid growth in the coming years, spurred by increasing investments in exploration and production activities within these regions. Competitive pressures are significant, with major players like Schlumberger, Halliburton, and Baker Hughes leading the market, alongside specialized material suppliers like CoorsTek and Imerys. The market's growth trajectory is, however, subject to factors such as fluctuating oil and gas prices, environmental regulations concerning water usage and waste disposal, and the potential for technological disruptions.
The sustained growth in the Stimulation Materials market is inextricably linked to global energy demands and the ongoing exploration of unconventional hydrocarbon reserves. While the inherent volatility of the energy sector presents a challenge, the long-term outlook remains positive due to the persistent need for reliable energy sources. Strategic collaborations, technological innovations (e.g., development of more resilient proppants and eco-friendly chemicals), and mergers and acquisitions are likely to shape the competitive landscape in the coming years. Companies are focusing on developing advanced materials and services that improve fracture conductivity, reduce operational costs, and minimize environmental impact to gain a competitive edge. The market segmentation offers opportunities for specialized players focusing on specific niche applications or geographical regions. Successfully navigating the regulatory landscape and managing environmental concerns will be crucial for sustained success in this dynamic market.
Stimulation Materials Market: A Comprehensive Report (2019-2033)
This in-depth report provides a comprehensive analysis of the global Stimulation Materials Market, offering invaluable insights for stakeholders across the industry. With a study period spanning 2019-2033, a base year of 2025, and a forecast period of 2025-2033, this report meticulously examines market dynamics, competitive landscapes, and future growth potential. The market is segmented by Material Type (Proppants, Ceramic, Chemical) providing a granular understanding of each segment's performance and future prospects. The total market size is predicted to reach xx Billion by 2033.
Stimulation Materials Market Concentration & Innovation
The Stimulation Materials market exhibits a moderately concentrated structure, with a few major players holding significant market share. The top five companies account for approximately xx% of the global market in 2025. Market share fluctuations are influenced by factors including technological advancements, M&A activity, and fluctuating commodity prices. Innovation is a key driver, with companies investing heavily in R&D to develop higher-performing proppants, enhance chemical formulations, and improve stimulation techniques. Regulatory frameworks, particularly those concerning environmental protection and safety, significantly impact market operations. Product substitutes, such as alternative stimulation methods, present a competitive challenge, influencing the adoption rates of various stimulation materials. End-user trends, such as a growing preference for efficient and environmentally friendly solutions, are shaping product development and marketing strategies.
- Market Concentration: Top 5 companies hold approximately xx% market share in 2025.
- M&A Activity: Over the period 2019-2024, M&A activity resulted in xx Billion in deal values, primarily focused on consolidating market share and gaining access to new technologies.
- Innovation Drivers: Focus on developing high-strength proppants, environmentally friendly chemicals, and improved stimulation techniques.
- Regulatory Impact: Stringent environmental regulations are driving the adoption of more sustainable materials and practices.
- Substitute Products: Alternative stimulation methods, like hydraulic fracturing with alternative fluids, are emerging as competitive options.
Stimulation Materials Market Industry Trends & Insights
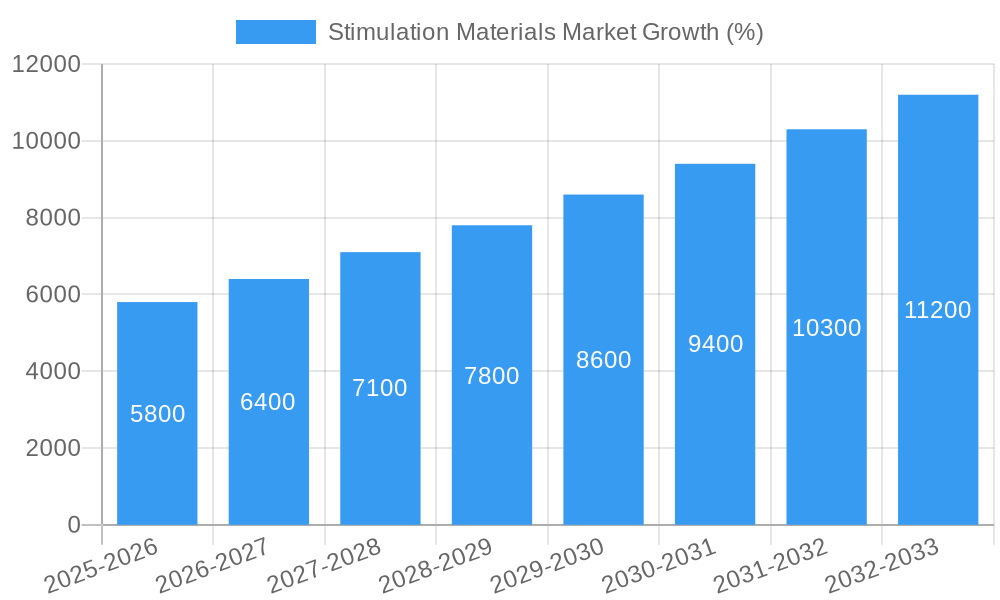
The Stimulation Materials market is projected to witness robust growth during the forecast period (2025-2033), driven by a CAGR of xx%. Several factors contribute to this growth. The increasing global demand for energy, particularly from unconventional oil and gas resources, fuels the demand for stimulation materials. Technological advancements, particularly in the development of high-performance proppants and more efficient chemicals, enhance well productivity and drive market expansion. Changing consumer preferences towards more sustainable and environmentally friendly products are also influencing the market dynamics. Intense competition among major players leads to continuous innovation, improved product offerings and pricing strategies. Market penetration in emerging economies with significant hydrocarbon reserves remains a significant growth opportunity.
Dominant Markets & Segments in Stimulation Materials Market
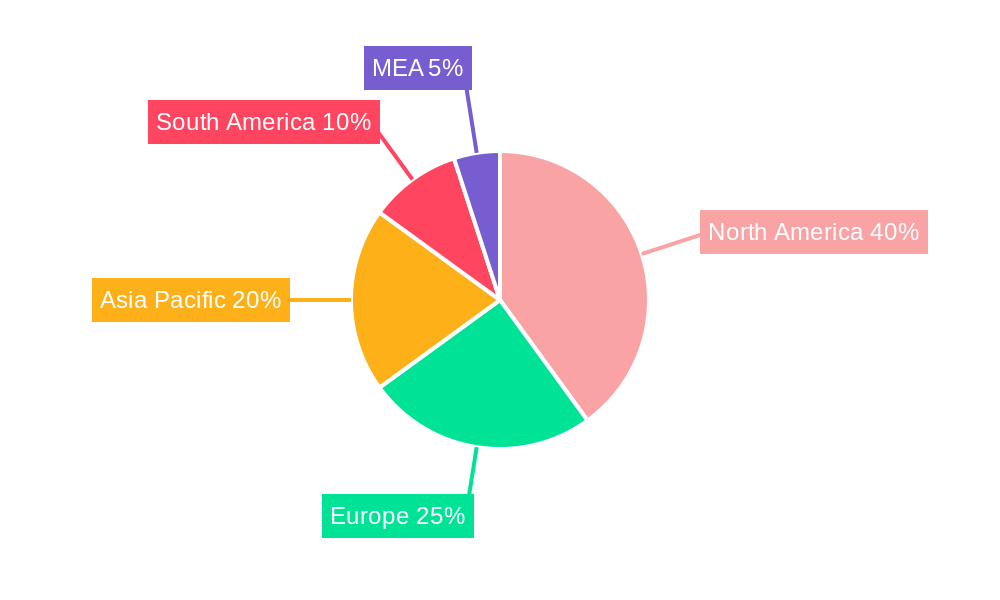
The North American region is currently the dominant market for stimulation materials, holding approximately xx% of the global market share in 2025. This dominance is largely attributed to the extensive shale gas and tight oil reserves in the United States and Canada. Key drivers include:
- Favorable Economic Policies: Supportive government policies and tax incentives in North America stimulate oil and gas exploration and production.
- Robust Infrastructure: Existing robust infrastructure for oil and gas production and transportation.
- Technological Advancements: Significant investments in R&D and technological innovations.
Within the material type segment, proppants currently holds the largest market share due to their extensive application in hydraulic fracturing. The chemical segment shows significant growth potential, driven by the increasing adoption of advanced fracturing fluids that enhance well productivity.
Stimulation Materials Market Product Developments
Recent product innovations include the development of high-strength proppants with enhanced conductivity and durability, and the introduction of eco-friendly fracturing fluids with reduced environmental impact. These innovations focus on maximizing well productivity while minimizing the environmental footprint. New applications are continuously being explored in unconventional reservoirs. Competitive advantages are primarily derived from superior product performance, cost-effectiveness, and environmental sustainability.
Report Scope & Segmentation Analysis
This report segments the Stimulation Materials market by Material Type: Proppants, Ceramic, and Chemical.
Proppants: This segment is anticipated to experience strong growth, driven by its wide-scale application in hydraulic fracturing. The market size is projected to reach xx Billion by 2033. Competition is intense, with companies focusing on differentiating their offerings through enhanced performance characteristics and cost optimization.
Ceramic: This segment is characterized by higher performance and durability compared to other proppants. Growth in this segment is expected to be driven by the increasing demand for higher well productivity in challenging geological formations. Market size is estimated to reach xx Billion by 2033.
Chemical: This segment encompasses a wide range of fracturing fluids and additives. Growth is propelled by the rising demand for environmentally friendly and efficient stimulation techniques. The market size is anticipated to reach xx Billion by 2033.
Key Drivers of Stimulation Materials Market Growth
Several factors drive the growth of the Stimulation Materials market. The increasing demand for energy and the expansion of unconventional hydrocarbon exploration and production are major contributors. Advancements in hydraulic fracturing technology and the development of high-performance stimulation materials further fuel market expansion. Government policies and incentives promoting energy independence also play a crucial role.
Challenges in the Stimulation Materials Market Sector
Challenges include fluctuating commodity prices which impact profitability and investment decisions. Environmental regulations concerning waste disposal and water usage pose significant hurdles for companies. Intense competition leads to pricing pressures. Supply chain disruptions, particularly concerning raw materials, can affect production and delivery timelines.
Emerging Opportunities in Stimulation Materials Market
Emerging opportunities include the exploration of new and unconventional hydrocarbon reserves, requiring innovative stimulation techniques. The growing demand for eco-friendly and sustainable materials presents opportunities for companies to develop and market environmentally conscious solutions. The expansion of stimulation services into emerging economies also offers significant growth potential.
Leading Players in the Stimulation Materials Market Market
- Mineracao Curimbaba Ltda
- Ecolab
- Chevron Phillips Chemicals Company
- Solvay
- All Energy Sand
- Baker Hughes
- Imerys
- CoorsTek Inc
- Baltic Ceramics Investments S A
- Weatherford International plc
- Saint-Gobain (Saint-Gobain Proppants)
- Halliburton
- Royal Dutch Shell PLC
- Carbo Ceramics Inc
- Hi-Crush Inc
- Badger Mining Corporation
- Schlumberger Limited
- Unimin Corporation
- Hexion Inc
Key Developments in Stimulation Materials Market Industry
- Jan 2023: Company X launched a new line of high-strength proppants.
- Mar 2022: Company Y acquired Company Z, expanding its market presence.
- Oct 2021: A significant regulatory change impacted the use of certain chemicals.
- Further key developments will be detailed within the full report.
Strategic Outlook for Stimulation Materials Market Market
The Stimulation Materials market is poised for continued growth, driven by sustained demand for energy and technological advancements. Opportunities lie in expanding into new markets, developing sustainable solutions, and leveraging digital technologies to optimize operations. Focusing on innovation and strategic partnerships will be crucial for companies to maintain a competitive edge in this dynamic market.
Stimulation Materials Market Segmentation
-
1. Material Type
-
1.1. Proppants
- 1.1.1. Frac Sand
- 1.1.2. Resin Coated
- 1.1.3. Ceramic
-
1.2. Chemical
- 1.2.1. Surfactants
- 1.2.2. Gelling Agents
- 1.2.3. Friction Reducers
- 1.2.4. Breakers
- 1.2.5. Crosslinking Agents
- 1.2.6. Corrosion and Scale Inhibitors
- 1.2.7. Biocides
- 1.2.8. Other Chemicals
-
1.1. Proppants
Stimulation Materials Market Segmentation By Geography
-
1. Asia Pacific
- 1.1. China
- 1.2. India
- 1.3. Japan
- 1.4. South Korea
- 1.5. Rest of Asia Pacific
-
2. North America
- 2.1. United States
- 2.2. Canada
- 2.3. Mexico
-
3. Europe
- 3.1. Germany
- 3.2. United Kingdom
- 3.3. France
- 3.4. Italy
- 3.5. Rest of Europe
-
4. South America
- 4.1. Brazil
- 4.2. Argentina
- 4.3. Rest of South America
- 5. Middle East
-
6. Saudi Arabia
- 6.1. South Africa
- 6.2. Rest of Middle East
Stimulation Materials Market REPORT HIGHLIGHTS
| Aspects | Details |
|---|---|
| Study Period | 2019-2033 |
| Base Year | 2024 |
| Estimated Year | 2025 |
| Forecast Period | 2025-2033 |
| Historical Period | 2019-2024 |
| Growth Rate | CAGR of 9.8% from 2019-2033 |
| Segmentation |
|
Table of Contents
- 1. Introduction
- 1.1. Research Scope
- 1.2. Market Segmentation
- 1.3. Research Methodology
- 1.4. Definitions and Assumptions
- 2. Executive Summary
- 2.1. Introduction
- 3. Market Dynamics
- 3.1. Introduction
- 3.2. Market Drivers
- 3.2.1. ; Development of Unconventional Gas Resources; Increase in Mature Oilfields
- 3.3. Market Restrains
- 3.3.1. ; Environmental and Regulation Challenges
- 3.4. Market Trends
- 3.4.1. Proppants Segment to Dominate the Market Demand
- 4. Market Factor Analysis
- 4.1. Porters Five Forces
- 4.2. Supply/Value Chain
- 4.3. PESTEL analysis
- 4.4. Market Entropy
- 4.5. Patent/Trademark Analysis
- 5. Global Stimulation Materials Market Analysis, Insights and Forecast, 2019-2031
- 5.1. Market Analysis, Insights and Forecast - by Material Type
- 5.1.1. Proppants
- 5.1.1.1. Frac Sand
- 5.1.1.2. Resin Coated
- 5.1.1.3. Ceramic
- 5.1.2. Chemical
- 5.1.2.1. Surfactants
- 5.1.2.2. Gelling Agents
- 5.1.2.3. Friction Reducers
- 5.1.2.4. Breakers
- 5.1.2.5. Crosslinking Agents
- 5.1.2.6. Corrosion and Scale Inhibitors
- 5.1.2.7. Biocides
- 5.1.2.8. Other Chemicals
- 5.1.1. Proppants
- 5.2. Market Analysis, Insights and Forecast - by Region
- 5.2.1. Asia Pacific
- 5.2.2. North America
- 5.2.3. Europe
- 5.2.4. South America
- 5.2.5. Middle East
- 5.2.6. Saudi Arabia
- 5.1. Market Analysis, Insights and Forecast - by Material Type
- 6. Asia Pacific Stimulation Materials Market Analysis, Insights and Forecast, 2019-2031
- 6.1. Market Analysis, Insights and Forecast - by Material Type
- 6.1.1. Proppants
- 6.1.1.1. Frac Sand
- 6.1.1.2. Resin Coated
- 6.1.1.3. Ceramic
- 6.1.2. Chemical
- 6.1.2.1. Surfactants
- 6.1.2.2. Gelling Agents
- 6.1.2.3. Friction Reducers
- 6.1.2.4. Breakers
- 6.1.2.5. Crosslinking Agents
- 6.1.2.6. Corrosion and Scale Inhibitors
- 6.1.2.7. Biocides
- 6.1.2.8. Other Chemicals
- 6.1.1. Proppants
- 6.1. Market Analysis, Insights and Forecast - by Material Type
- 7. North America Stimulation Materials Market Analysis, Insights and Forecast, 2019-2031
- 7.1. Market Analysis, Insights and Forecast - by Material Type
- 7.1.1. Proppants
- 7.1.1.1. Frac Sand
- 7.1.1.2. Resin Coated
- 7.1.1.3. Ceramic
- 7.1.2. Chemical
- 7.1.2.1. Surfactants
- 7.1.2.2. Gelling Agents
- 7.1.2.3. Friction Reducers
- 7.1.2.4. Breakers
- 7.1.2.5. Crosslinking Agents
- 7.1.2.6. Corrosion and Scale Inhibitors
- 7.1.2.7. Biocides
- 7.1.2.8. Other Chemicals
- 7.1.1. Proppants
- 7.1. Market Analysis, Insights and Forecast - by Material Type
- 8. Europe Stimulation Materials Market Analysis, Insights and Forecast, 2019-2031
- 8.1. Market Analysis, Insights and Forecast - by Material Type
- 8.1.1. Proppants
- 8.1.1.1. Frac Sand
- 8.1.1.2. Resin Coated
- 8.1.1.3. Ceramic
- 8.1.2. Chemical
- 8.1.2.1. Surfactants
- 8.1.2.2. Gelling Agents
- 8.1.2.3. Friction Reducers
- 8.1.2.4. Breakers
- 8.1.2.5. Crosslinking Agents
- 8.1.2.6. Corrosion and Scale Inhibitors
- 8.1.2.7. Biocides
- 8.1.2.8. Other Chemicals
- 8.1.1. Proppants
- 8.1. Market Analysis, Insights and Forecast - by Material Type
- 9. South America Stimulation Materials Market Analysis, Insights and Forecast, 2019-2031
- 9.1. Market Analysis, Insights and Forecast - by Material Type
- 9.1.1. Proppants
- 9.1.1.1. Frac Sand
- 9.1.1.2. Resin Coated
- 9.1.1.3. Ceramic
- 9.1.2. Chemical
- 9.1.2.1. Surfactants
- 9.1.2.2. Gelling Agents
- 9.1.2.3. Friction Reducers
- 9.1.2.4. Breakers
- 9.1.2.5. Crosslinking Agents
- 9.1.2.6. Corrosion and Scale Inhibitors
- 9.1.2.7. Biocides
- 9.1.2.8. Other Chemicals
- 9.1.1. Proppants
- 9.1. Market Analysis, Insights and Forecast - by Material Type
- 10. Middle East Stimulation Materials Market Analysis, Insights and Forecast, 2019-2031
- 10.1. Market Analysis, Insights and Forecast - by Material Type
- 10.1.1. Proppants
- 10.1.1.1. Frac Sand
- 10.1.1.2. Resin Coated
- 10.1.1.3. Ceramic
- 10.1.2. Chemical
- 10.1.2.1. Surfactants
- 10.1.2.2. Gelling Agents
- 10.1.2.3. Friction Reducers
- 10.1.2.4. Breakers
- 10.1.2.5. Crosslinking Agents
- 10.1.2.6. Corrosion and Scale Inhibitors
- 10.1.2.7. Biocides
- 10.1.2.8. Other Chemicals
- 10.1.1. Proppants
- 10.1. Market Analysis, Insights and Forecast - by Material Type
- 11. Saudi Arabia Stimulation Materials Market Analysis, Insights and Forecast, 2019-2031
- 11.1. Market Analysis, Insights and Forecast - by Material Type
- 11.1.1. Proppants
- 11.1.1.1. Frac Sand
- 11.1.1.2. Resin Coated
- 11.1.1.3. Ceramic
- 11.1.2. Chemical
- 11.1.2.1. Surfactants
- 11.1.2.2. Gelling Agents
- 11.1.2.3. Friction Reducers
- 11.1.2.4. Breakers
- 11.1.2.5. Crosslinking Agents
- 11.1.2.6. Corrosion and Scale Inhibitors
- 11.1.2.7. Biocides
- 11.1.2.8. Other Chemicals
- 11.1.1. Proppants
- 11.1. Market Analysis, Insights and Forecast - by Material Type
- 12. North America Stimulation Materials Market Analysis, Insights and Forecast, 2019-2031
- 12.1. Market Analysis, Insights and Forecast - By Country/Sub-region
- 12.1.1 United States
- 12.1.2 Canada
- 12.1.3 Mexico
- 13. Europe Stimulation Materials Market Analysis, Insights and Forecast, 2019-2031
- 13.1. Market Analysis, Insights and Forecast - By Country/Sub-region
- 13.1.1 Germany
- 13.1.2 France
- 13.1.3 Italy
- 13.1.4 United Kingdom
- 13.1.5 Netherlands
- 13.1.6 Rest of Europe
- 14. Asia Pacific Stimulation Materials Market Analysis, Insights and Forecast, 2019-2031
- 14.1. Market Analysis, Insights and Forecast - By Country/Sub-region
- 14.1.1 China
- 14.1.2 Japan
- 14.1.3 India
- 14.1.4 South Korea
- 14.1.5 Taiwan
- 14.1.6 Australia
- 14.1.7 Rest of Asia-Pacific
- 15. South America Stimulation Materials Market Analysis, Insights and Forecast, 2019-2031
- 15.1. Market Analysis, Insights and Forecast - By Country/Sub-region
- 15.1.1 Brazil
- 15.1.2 Argentina
- 15.1.3 Rest of South America
- 16. MEA Stimulation Materials Market Analysis, Insights and Forecast, 2019-2031
- 16.1. Market Analysis, Insights and Forecast - By Country/Sub-region
- 16.1.1 Middle East
- 16.1.2 Africa
- 17. Competitive Analysis
- 17.1. Global Market Share Analysis 2024
- 17.2. Company Profiles
- 17.2.1 Mineracao Curimbaba Ltda
- 17.2.1.1. Overview
- 17.2.1.2. Products
- 17.2.1.3. SWOT Analysis
- 17.2.1.4. Recent Developments
- 17.2.1.5. Financials (Based on Availability)
- 17.2.2 Ecolab
- 17.2.2.1. Overview
- 17.2.2.2. Products
- 17.2.2.3. SWOT Analysis
- 17.2.2.4. Recent Developments
- 17.2.2.5. Financials (Based on Availability)
- 17.2.3 Chevron Phillips Chemicals Company
- 17.2.3.1. Overview
- 17.2.3.2. Products
- 17.2.3.3. SWOT Analysis
- 17.2.3.4. Recent Developments
- 17.2.3.5. Financials (Based on Availability)
- 17.2.4 Solvay
- 17.2.4.1. Overview
- 17.2.4.2. Products
- 17.2.4.3. SWOT Analysis
- 17.2.4.4. Recent Developments
- 17.2.4.5. Financials (Based on Availability)
- 17.2.5 All Energy Sand
- 17.2.5.1. Overview
- 17.2.5.2. Products
- 17.2.5.3. SWOT Analysis
- 17.2.5.4. Recent Developments
- 17.2.5.5. Financials (Based on Availability)
- 17.2.6 Baker Hughes
- 17.2.6.1. Overview
- 17.2.6.2. Products
- 17.2.6.3. SWOT Analysis
- 17.2.6.4. Recent Developments
- 17.2.6.5. Financials (Based on Availability)
- 17.2.7 Imerys
- 17.2.7.1. Overview
- 17.2.7.2. Products
- 17.2.7.3. SWOT Analysis
- 17.2.7.4. Recent Developments
- 17.2.7.5. Financials (Based on Availability)
- 17.2.8 CoorsTek Inc
- 17.2.8.1. Overview
- 17.2.8.2. Products
- 17.2.8.3. SWOT Analysis
- 17.2.8.4. Recent Developments
- 17.2.8.5. Financials (Based on Availability)
- 17.2.9 Baltic Ceramics Investments S A
- 17.2.9.1. Overview
- 17.2.9.2. Products
- 17.2.9.3. SWOT Analysis
- 17.2.9.4. Recent Developments
- 17.2.9.5. Financials (Based on Availability)
- 17.2.10 Weatherford International plc
- 17.2.10.1. Overview
- 17.2.10.2. Products
- 17.2.10.3. SWOT Analysis
- 17.2.10.4. Recent Developments
- 17.2.10.5. Financials (Based on Availability)
- 17.2.11 Saint-Gobain (Saint-Gobain Proppants)
- 17.2.11.1. Overview
- 17.2.11.2. Products
- 17.2.11.3. SWOT Analysis
- 17.2.11.4. Recent Developments
- 17.2.11.5. Financials (Based on Availability)
- 17.2.12 Halliburton
- 17.2.12.1. Overview
- 17.2.12.2. Products
- 17.2.12.3. SWOT Analysis
- 17.2.12.4. Recent Developments
- 17.2.12.5. Financials (Based on Availability)
- 17.2.13 Royal Dutch Shell PLC
- 17.2.13.1. Overview
- 17.2.13.2. Products
- 17.2.13.3. SWOT Analysis
- 17.2.13.4. Recent Developments
- 17.2.13.5. Financials (Based on Availability)
- 17.2.14 Carbo Ceramics Inc
- 17.2.14.1. Overview
- 17.2.14.2. Products
- 17.2.14.3. SWOT Analysis
- 17.2.14.4. Recent Developments
- 17.2.14.5. Financials (Based on Availability)
- 17.2.15 Hi-Crush Inc
- 17.2.15.1. Overview
- 17.2.15.2. Products
- 17.2.15.3. SWOT Analysis
- 17.2.15.4. Recent Developments
- 17.2.15.5. Financials (Based on Availability)
- 17.2.16 Badger Mining Corporation
- 17.2.16.1. Overview
- 17.2.16.2. Products
- 17.2.16.3. SWOT Analysis
- 17.2.16.4. Recent Developments
- 17.2.16.5. Financials (Based on Availability)
- 17.2.17 Schlumberger Limited
- 17.2.17.1. Overview
- 17.2.17.2. Products
- 17.2.17.3. SWOT Analysis
- 17.2.17.4. Recent Developments
- 17.2.17.5. Financials (Based on Availability)
- 17.2.18 Unimin Corporation
- 17.2.18.1. Overview
- 17.2.18.2. Products
- 17.2.18.3. SWOT Analysis
- 17.2.18.4. Recent Developments
- 17.2.18.5. Financials (Based on Availability)
- 17.2.19 Hexion Inc
- 17.2.19.1. Overview
- 17.2.19.2. Products
- 17.2.19.3. SWOT Analysis
- 17.2.19.4. Recent Developments
- 17.2.19.5. Financials (Based on Availability)
- 17.2.1 Mineracao Curimbaba Ltda
List of Figures
- Figure 1: Global Stimulation Materials Market Revenue Breakdown (Billion, %) by Region 2024 & 2032
- Figure 2: Global Stimulation Materials Market Volume Breakdown (K Tons, %) by Region 2024 & 2032
- Figure 3: North America Stimulation Materials Market Revenue (Billion), by Country 2024 & 2032
- Figure 4: North America Stimulation Materials Market Volume (K Tons), by Country 2024 & 2032
- Figure 5: North America Stimulation Materials Market Revenue Share (%), by Country 2024 & 2032
- Figure 6: North America Stimulation Materials Market Volume Share (%), by Country 2024 & 2032
- Figure 7: Europe Stimulation Materials Market Revenue (Billion), by Country 2024 & 2032
- Figure 8: Europe Stimulation Materials Market Volume (K Tons), by Country 2024 & 2032
- Figure 9: Europe Stimulation Materials Market Revenue Share (%), by Country 2024 & 2032
- Figure 10: Europe Stimulation Materials Market Volume Share (%), by Country 2024 & 2032
- Figure 11: Asia Pacific Stimulation Materials Market Revenue (Billion), by Country 2024 & 2032
- Figure 12: Asia Pacific Stimulation Materials Market Volume (K Tons), by Country 2024 & 2032
- Figure 13: Asia Pacific Stimulation Materials Market Revenue Share (%), by Country 2024 & 2032
- Figure 14: Asia Pacific Stimulation Materials Market Volume Share (%), by Country 2024 & 2032
- Figure 15: South America Stimulation Materials Market Revenue (Billion), by Country 2024 & 2032
- Figure 16: South America Stimulation Materials Market Volume (K Tons), by Country 2024 & 2032
- Figure 17: South America Stimulation Materials Market Revenue Share (%), by Country 2024 & 2032
- Figure 18: South America Stimulation Materials Market Volume Share (%), by Country 2024 & 2032
- Figure 19: MEA Stimulation Materials Market Revenue (Billion), by Country 2024 & 2032
- Figure 20: MEA Stimulation Materials Market Volume (K Tons), by Country 2024 & 2032
- Figure 21: MEA Stimulation Materials Market Revenue Share (%), by Country 2024 & 2032
- Figure 22: MEA Stimulation Materials Market Volume Share (%), by Country 2024 & 2032
- Figure 23: Asia Pacific Stimulation Materials Market Revenue (Billion), by Material Type 2024 & 2032
- Figure 24: Asia Pacific Stimulation Materials Market Volume (K Tons), by Material Type 2024 & 2032
- Figure 25: Asia Pacific Stimulation Materials Market Revenue Share (%), by Material Type 2024 & 2032
- Figure 26: Asia Pacific Stimulation Materials Market Volume Share (%), by Material Type 2024 & 2032
- Figure 27: Asia Pacific Stimulation Materials Market Revenue (Billion), by Country 2024 & 2032
- Figure 28: Asia Pacific Stimulation Materials Market Volume (K Tons), by Country 2024 & 2032
- Figure 29: Asia Pacific Stimulation Materials Market Revenue Share (%), by Country 2024 & 2032
- Figure 30: Asia Pacific Stimulation Materials Market Volume Share (%), by Country 2024 & 2032
- Figure 31: North America Stimulation Materials Market Revenue (Billion), by Material Type 2024 & 2032
- Figure 32: North America Stimulation Materials Market Volume (K Tons), by Material Type 2024 & 2032
- Figure 33: North America Stimulation Materials Market Revenue Share (%), by Material Type 2024 & 2032
- Figure 34: North America Stimulation Materials Market Volume Share (%), by Material Type 2024 & 2032
- Figure 35: North America Stimulation Materials Market Revenue (Billion), by Country 2024 & 2032
- Figure 36: North America Stimulation Materials Market Volume (K Tons), by Country 2024 & 2032
- Figure 37: North America Stimulation Materials Market Revenue Share (%), by Country 2024 & 2032
- Figure 38: North America Stimulation Materials Market Volume Share (%), by Country 2024 & 2032
- Figure 39: Europe Stimulation Materials Market Revenue (Billion), by Material Type 2024 & 2032
- Figure 40: Europe Stimulation Materials Market Volume (K Tons), by Material Type 2024 & 2032
- Figure 41: Europe Stimulation Materials Market Revenue Share (%), by Material Type 2024 & 2032
- Figure 42: Europe Stimulation Materials Market Volume Share (%), by Material Type 2024 & 2032
- Figure 43: Europe Stimulation Materials Market Revenue (Billion), by Country 2024 & 2032
- Figure 44: Europe Stimulation Materials Market Volume (K Tons), by Country 2024 & 2032
- Figure 45: Europe Stimulation Materials Market Revenue Share (%), by Country 2024 & 2032
- Figure 46: Europe Stimulation Materials Market Volume Share (%), by Country 2024 & 2032
- Figure 47: South America Stimulation Materials Market Revenue (Billion), by Material Type 2024 & 2032
- Figure 48: South America Stimulation Materials Market Volume (K Tons), by Material Type 2024 & 2032
- Figure 49: South America Stimulation Materials Market Revenue Share (%), by Material Type 2024 & 2032
- Figure 50: South America Stimulation Materials Market Volume Share (%), by Material Type 2024 & 2032
- Figure 51: South America Stimulation Materials Market Revenue (Billion), by Country 2024 & 2032
- Figure 52: South America Stimulation Materials Market Volume (K Tons), by Country 2024 & 2032
- Figure 53: South America Stimulation Materials Market Revenue Share (%), by Country 2024 & 2032
- Figure 54: South America Stimulation Materials Market Volume Share (%), by Country 2024 & 2032
- Figure 55: Middle East Stimulation Materials Market Revenue (Billion), by Material Type 2024 & 2032
- Figure 56: Middle East Stimulation Materials Market Volume (K Tons), by Material Type 2024 & 2032
- Figure 57: Middle East Stimulation Materials Market Revenue Share (%), by Material Type 2024 & 2032
- Figure 58: Middle East Stimulation Materials Market Volume Share (%), by Material Type 2024 & 2032
- Figure 59: Middle East Stimulation Materials Market Revenue (Billion), by Country 2024 & 2032
- Figure 60: Middle East Stimulation Materials Market Volume (K Tons), by Country 2024 & 2032
- Figure 61: Middle East Stimulation Materials Market Revenue Share (%), by Country 2024 & 2032
- Figure 62: Middle East Stimulation Materials Market Volume Share (%), by Country 2024 & 2032
- Figure 63: Saudi Arabia Stimulation Materials Market Revenue (Billion), by Material Type 2024 & 2032
- Figure 64: Saudi Arabia Stimulation Materials Market Volume (K Tons), by Material Type 2024 & 2032
- Figure 65: Saudi Arabia Stimulation Materials Market Revenue Share (%), by Material Type 2024 & 2032
- Figure 66: Saudi Arabia Stimulation Materials Market Volume Share (%), by Material Type 2024 & 2032
- Figure 67: Saudi Arabia Stimulation Materials Market Revenue (Billion), by Country 2024 & 2032
- Figure 68: Saudi Arabia Stimulation Materials Market Volume (K Tons), by Country 2024 & 2032
- Figure 69: Saudi Arabia Stimulation Materials Market Revenue Share (%), by Country 2024 & 2032
- Figure 70: Saudi Arabia Stimulation Materials Market Volume Share (%), by Country 2024 & 2032
List of Tables
- Table 1: Global Stimulation Materials Market Revenue Billion Forecast, by Region 2019 & 2032
- Table 2: Global Stimulation Materials Market Volume K Tons Forecast, by Region 2019 & 2032
- Table 3: Global Stimulation Materials Market Revenue Billion Forecast, by Material Type 2019 & 2032
- Table 4: Global Stimulation Materials Market Volume K Tons Forecast, by Material Type 2019 & 2032
- Table 5: Global Stimulation Materials Market Revenue Billion Forecast, by Region 2019 & 2032
- Table 6: Global Stimulation Materials Market Volume K Tons Forecast, by Region 2019 & 2032
- Table 7: Global Stimulation Materials Market Revenue Billion Forecast, by Country 2019 & 2032
- Table 8: Global Stimulation Materials Market Volume K Tons Forecast, by Country 2019 & 2032
- Table 9: United States Stimulation Materials Market Revenue (Billion) Forecast, by Application 2019 & 2032
- Table 10: United States Stimulation Materials Market Volume (K Tons) Forecast, by Application 2019 & 2032
- Table 11: Canada Stimulation Materials Market Revenue (Billion) Forecast, by Application 2019 & 2032
- Table 12: Canada Stimulation Materials Market Volume (K Tons) Forecast, by Application 2019 & 2032
- Table 13: Mexico Stimulation Materials Market Revenue (Billion) Forecast, by Application 2019 & 2032
- Table 14: Mexico Stimulation Materials Market Volume (K Tons) Forecast, by Application 2019 & 2032
- Table 15: Global Stimulation Materials Market Revenue Billion Forecast, by Country 2019 & 2032
- Table 16: Global Stimulation Materials Market Volume K Tons Forecast, by Country 2019 & 2032
- Table 17: Germany Stimulation Materials Market Revenue (Billion) Forecast, by Application 2019 & 2032
- Table 18: Germany Stimulation Materials Market Volume (K Tons) Forecast, by Application 2019 & 2032
- Table 19: France Stimulation Materials Market Revenue (Billion) Forecast, by Application 2019 & 2032
- Table 20: France Stimulation Materials Market Volume (K Tons) Forecast, by Application 2019 & 2032
- Table 21: Italy Stimulation Materials Market Revenue (Billion) Forecast, by Application 2019 & 2032
- Table 22: Italy Stimulation Materials Market Volume (K Tons) Forecast, by Application 2019 & 2032
- Table 23: United Kingdom Stimulation Materials Market Revenue (Billion) Forecast, by Application 2019 & 2032
- Table 24: United Kingdom Stimulation Materials Market Volume (K Tons) Forecast, by Application 2019 & 2032
- Table 25: Netherlands Stimulation Materials Market Revenue (Billion) Forecast, by Application 2019 & 2032
- Table 26: Netherlands Stimulation Materials Market Volume (K Tons) Forecast, by Application 2019 & 2032
- Table 27: Rest of Europe Stimulation Materials Market Revenue (Billion) Forecast, by Application 2019 & 2032
- Table 28: Rest of Europe Stimulation Materials Market Volume (K Tons) Forecast, by Application 2019 & 2032
- Table 29: Global Stimulation Materials Market Revenue Billion Forecast, by Country 2019 & 2032
- Table 30: Global Stimulation Materials Market Volume K Tons Forecast, by Country 2019 & 2032
- Table 31: China Stimulation Materials Market Revenue (Billion) Forecast, by Application 2019 & 2032
- Table 32: China Stimulation Materials Market Volume (K Tons) Forecast, by Application 2019 & 2032
- Table 33: Japan Stimulation Materials Market Revenue (Billion) Forecast, by Application 2019 & 2032
- Table 34: Japan Stimulation Materials Market Volume (K Tons) Forecast, by Application 2019 & 2032
- Table 35: India Stimulation Materials Market Revenue (Billion) Forecast, by Application 2019 & 2032
- Table 36: India Stimulation Materials Market Volume (K Tons) Forecast, by Application 2019 & 2032
- Table 37: South Korea Stimulation Materials Market Revenue (Billion) Forecast, by Application 2019 & 2032
- Table 38: South Korea Stimulation Materials Market Volume (K Tons) Forecast, by Application 2019 & 2032
- Table 39: Taiwan Stimulation Materials Market Revenue (Billion) Forecast, by Application 2019 & 2032
- Table 40: Taiwan Stimulation Materials Market Volume (K Tons) Forecast, by Application 2019 & 2032
- Table 41: Australia Stimulation Materials Market Revenue (Billion) Forecast, by Application 2019 & 2032
- Table 42: Australia Stimulation Materials Market Volume (K Tons) Forecast, by Application 2019 & 2032
- Table 43: Rest of Asia-Pacific Stimulation Materials Market Revenue (Billion) Forecast, by Application 2019 & 2032
- Table 44: Rest of Asia-Pacific Stimulation Materials Market Volume (K Tons) Forecast, by Application 2019 & 2032
- Table 45: Global Stimulation Materials Market Revenue Billion Forecast, by Country 2019 & 2032
- Table 46: Global Stimulation Materials Market Volume K Tons Forecast, by Country 2019 & 2032
- Table 47: Brazil Stimulation Materials Market Revenue (Billion) Forecast, by Application 2019 & 2032
- Table 48: Brazil Stimulation Materials Market Volume (K Tons) Forecast, by Application 2019 & 2032
- Table 49: Argentina Stimulation Materials Market Revenue (Billion) Forecast, by Application 2019 & 2032
- Table 50: Argentina Stimulation Materials Market Volume (K Tons) Forecast, by Application 2019 & 2032
- Table 51: Rest of South America Stimulation Materials Market Revenue (Billion) Forecast, by Application 2019 & 2032
- Table 52: Rest of South America Stimulation Materials Market Volume (K Tons) Forecast, by Application 2019 & 2032
- Table 53: Global Stimulation Materials Market Revenue Billion Forecast, by Country 2019 & 2032
- Table 54: Global Stimulation Materials Market Volume K Tons Forecast, by Country 2019 & 2032
- Table 55: Middle East Stimulation Materials Market Revenue (Billion) Forecast, by Application 2019 & 2032
- Table 56: Middle East Stimulation Materials Market Volume (K Tons) Forecast, by Application 2019 & 2032
- Table 57: Africa Stimulation Materials Market Revenue (Billion) Forecast, by Application 2019 & 2032
- Table 58: Africa Stimulation Materials Market Volume (K Tons) Forecast, by Application 2019 & 2032
- Table 59: Global Stimulation Materials Market Revenue Billion Forecast, by Material Type 2019 & 2032
- Table 60: Global Stimulation Materials Market Volume K Tons Forecast, by Material Type 2019 & 2032
- Table 61: Global Stimulation Materials Market Revenue Billion Forecast, by Country 2019 & 2032
- Table 62: Global Stimulation Materials Market Volume K Tons Forecast, by Country 2019 & 2032
- Table 63: China Stimulation Materials Market Revenue (Billion) Forecast, by Application 2019 & 2032
- Table 64: China Stimulation Materials Market Volume (K Tons) Forecast, by Application 2019 & 2032
- Table 65: India Stimulation Materials Market Revenue (Billion) Forecast, by Application 2019 & 2032
- Table 66: India Stimulation Materials Market Volume (K Tons) Forecast, by Application 2019 & 2032
- Table 67: Japan Stimulation Materials Market Revenue (Billion) Forecast, by Application 2019 & 2032
- Table 68: Japan Stimulation Materials Market Volume (K Tons) Forecast, by Application 2019 & 2032
- Table 69: South Korea Stimulation Materials Market Revenue (Billion) Forecast, by Application 2019 & 2032
- Table 70: South Korea Stimulation Materials Market Volume (K Tons) Forecast, by Application 2019 & 2032
- Table 71: Rest of Asia Pacific Stimulation Materials Market Revenue (Billion) Forecast, by Application 2019 & 2032
- Table 72: Rest of Asia Pacific Stimulation Materials Market Volume (K Tons) Forecast, by Application 2019 & 2032
- Table 73: Global Stimulation Materials Market Revenue Billion Forecast, by Material Type 2019 & 2032
- Table 74: Global Stimulation Materials Market Volume K Tons Forecast, by Material Type 2019 & 2032
- Table 75: Global Stimulation Materials Market Revenue Billion Forecast, by Country 2019 & 2032
- Table 76: Global Stimulation Materials Market Volume K Tons Forecast, by Country 2019 & 2032
- Table 77: United States Stimulation Materials Market Revenue (Billion) Forecast, by Application 2019 & 2032
- Table 78: United States Stimulation Materials Market Volume (K Tons) Forecast, by Application 2019 & 2032
- Table 79: Canada Stimulation Materials Market Revenue (Billion) Forecast, by Application 2019 & 2032
- Table 80: Canada Stimulation Materials Market Volume (K Tons) Forecast, by Application 2019 & 2032
- Table 81: Mexico Stimulation Materials Market Revenue (Billion) Forecast, by Application 2019 & 2032
- Table 82: Mexico Stimulation Materials Market Volume (K Tons) Forecast, by Application 2019 & 2032
- Table 83: Global Stimulation Materials Market Revenue Billion Forecast, by Material Type 2019 & 2032
- Table 84: Global Stimulation Materials Market Volume K Tons Forecast, by Material Type 2019 & 2032
- Table 85: Global Stimulation Materials Market Revenue Billion Forecast, by Country 2019 & 2032
- Table 86: Global Stimulation Materials Market Volume K Tons Forecast, by Country 2019 & 2032
- Table 87: Germany Stimulation Materials Market Revenue (Billion) Forecast, by Application 2019 & 2032
- Table 88: Germany Stimulation Materials Market Volume (K Tons) Forecast, by Application 2019 & 2032
- Table 89: United Kingdom Stimulation Materials Market Revenue (Billion) Forecast, by Application 2019 & 2032
- Table 90: United Kingdom Stimulation Materials Market Volume (K Tons) Forecast, by Application 2019 & 2032
- Table 91: France Stimulation Materials Market Revenue (Billion) Forecast, by Application 2019 & 2032
- Table 92: France Stimulation Materials Market Volume (K Tons) Forecast, by Application 2019 & 2032
- Table 93: Italy Stimulation Materials Market Revenue (Billion) Forecast, by Application 2019 & 2032
- Table 94: Italy Stimulation Materials Market Volume (K Tons) Forecast, by Application 2019 & 2032
- Table 95: Rest of Europe Stimulation Materials Market Revenue (Billion) Forecast, by Application 2019 & 2032
- Table 96: Rest of Europe Stimulation Materials Market Volume (K Tons) Forecast, by Application 2019 & 2032
- Table 97: Global Stimulation Materials Market Revenue Billion Forecast, by Material Type 2019 & 2032
- Table 98: Global Stimulation Materials Market Volume K Tons Forecast, by Material Type 2019 & 2032
- Table 99: Global Stimulation Materials Market Revenue Billion Forecast, by Country 2019 & 2032
- Table 100: Global Stimulation Materials Market Volume K Tons Forecast, by Country 2019 & 2032
- Table 101: Brazil Stimulation Materials Market Revenue (Billion) Forecast, by Application 2019 & 2032
- Table 102: Brazil Stimulation Materials Market Volume (K Tons) Forecast, by Application 2019 & 2032
- Table 103: Argentina Stimulation Materials Market Revenue (Billion) Forecast, by Application 2019 & 2032
- Table 104: Argentina Stimulation Materials Market Volume (K Tons) Forecast, by Application 2019 & 2032
- Table 105: Rest of South America Stimulation Materials Market Revenue (Billion) Forecast, by Application 2019 & 2032
- Table 106: Rest of South America Stimulation Materials Market Volume (K Tons) Forecast, by Application 2019 & 2032
- Table 107: Global Stimulation Materials Market Revenue Billion Forecast, by Material Type 2019 & 2032
- Table 108: Global Stimulation Materials Market Volume K Tons Forecast, by Material Type 2019 & 2032
- Table 109: Global Stimulation Materials Market Revenue Billion Forecast, by Country 2019 & 2032
- Table 110: Global Stimulation Materials Market Volume K Tons Forecast, by Country 2019 & 2032
- Table 111: Global Stimulation Materials Market Revenue Billion Forecast, by Material Type 2019 & 2032
- Table 112: Global Stimulation Materials Market Volume K Tons Forecast, by Material Type 2019 & 2032
- Table 113: Global Stimulation Materials Market Revenue Billion Forecast, by Country 2019 & 2032
- Table 114: Global Stimulation Materials Market Volume K Tons Forecast, by Country 2019 & 2032
- Table 115: South Africa Stimulation Materials Market Revenue (Billion) Forecast, by Application 2019 & 2032
- Table 116: South Africa Stimulation Materials Market Volume (K Tons) Forecast, by Application 2019 & 2032
- Table 117: Rest of Middle East Stimulation Materials Market Revenue (Billion) Forecast, by Application 2019 & 2032
- Table 118: Rest of Middle East Stimulation Materials Market Volume (K Tons) Forecast, by Application 2019 & 2032
Frequently Asked Questions
1. What is the projected Compound Annual Growth Rate (CAGR) of the Stimulation Materials Market?
The projected CAGR is approximately 9.8%.
2. Which companies are prominent players in the Stimulation Materials Market?
Key companies in the market include Mineracao Curimbaba Ltda, Ecolab, Chevron Phillips Chemicals Company, Solvay, All Energy Sand, Baker Hughes, Imerys, CoorsTek Inc, Baltic Ceramics Investments S A, Weatherford International plc , Saint-Gobain (Saint-Gobain Proppants), Halliburton, Royal Dutch Shell PLC, Carbo Ceramics Inc, Hi-Crush Inc, Badger Mining Corporation, Schlumberger Limited, Unimin Corporation, Hexion Inc.
3. What are the main segments of the Stimulation Materials Market?
The market segments include Material Type.
4. Can you provide details about the market size?
The market size is estimated to be USD 59.6 Billion as of 2022.
5. What are some drivers contributing to market growth?
; Development of Unconventional Gas Resources; Increase in Mature Oilfields.
6. What are the notable trends driving market growth?
Proppants Segment to Dominate the Market Demand.
7. Are there any restraints impacting market growth?
; Environmental and Regulation Challenges.
8. Can you provide examples of recent developments in the market?
N/A
9. What pricing options are available for accessing the report?
Pricing options include single-user, multi-user, and enterprise licenses priced at USD 4750, USD 5250, and USD 8750 respectively.
10. Is the market size provided in terms of value or volume?
The market size is provided in terms of value, measured in Billion and volume, measured in K Tons.
11. Are there any specific market keywords associated with the report?
Yes, the market keyword associated with the report is "Stimulation Materials Market," which aids in identifying and referencing the specific market segment covered.
12. How do I determine which pricing option suits my needs best?
The pricing options vary based on user requirements and access needs. Individual users may opt for single-user licenses, while businesses requiring broader access may choose multi-user or enterprise licenses for cost-effective access to the report.
13. Are there any additional resources or data provided in the Stimulation Materials Market report?
While the report offers comprehensive insights, it's advisable to review the specific contents or supplementary materials provided to ascertain if additional resources or data are available.
14. How can I stay updated on further developments or reports in the Stimulation Materials Market?
To stay informed about further developments, trends, and reports in the Stimulation Materials Market, consider subscribing to industry newsletters, following relevant companies and organizations, or regularly checking reputable industry news sources and publications.
Methodology
Step 1 - Identification of Relevant Samples Size from Population Database


Step 2 - Approaches for Defining Global Market Size (Value, Volume* & Price*)

Note*: In applicable scenarios
Step 3 - Data Sources
Primary Research
- Web Analytics
- Survey Reports
- Research Institute
- Latest Research Reports
- Opinion Leaders
Secondary Research
- Annual Reports
- White Paper
- Latest Press Release
- Industry Association
- Paid Database
- Investor Presentations

Step 4 - Data Triangulation
Involves using different sources of information in order to increase the validity of a study
These sources are likely to be stakeholders in a program - participants, other researchers, program staff, other community members, and so on.
Then we put all data in single framework & apply various statistical tools to find out the dynamic on the market.
During the analysis stage, feedback from the stakeholder groups would be compared to determine areas of agreement as well as areas of divergence


