
Key Insights
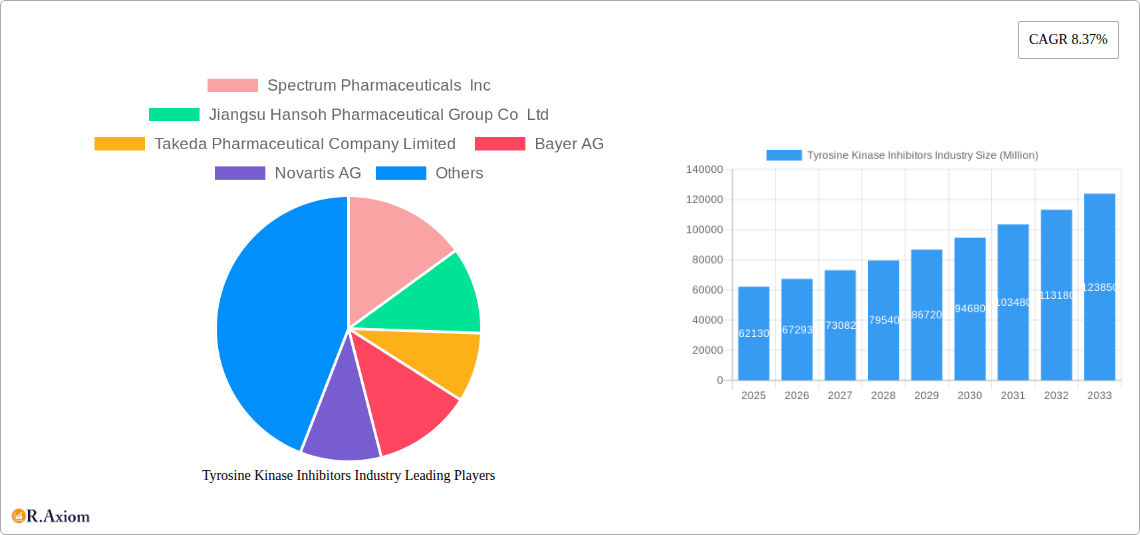
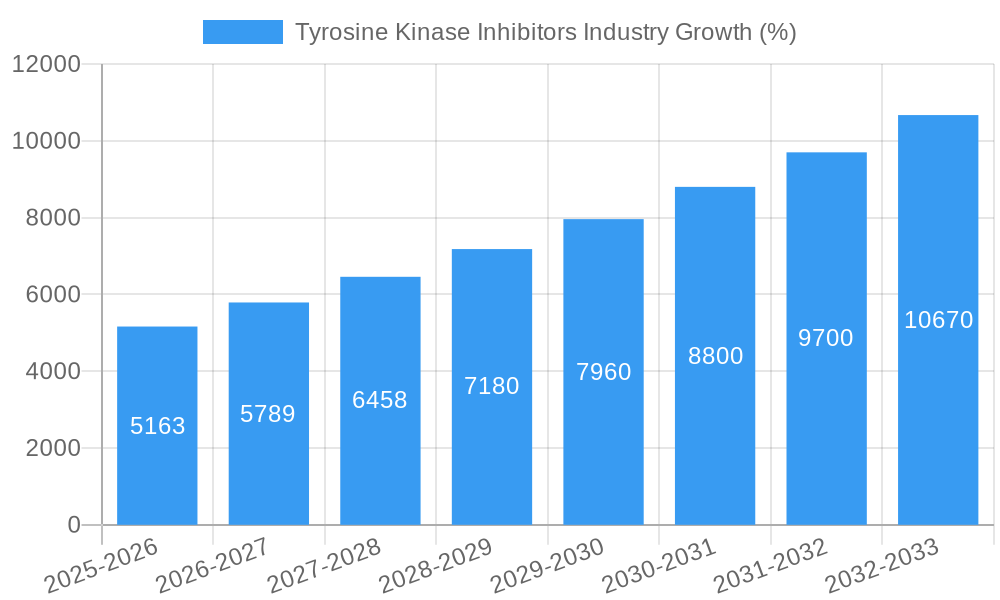
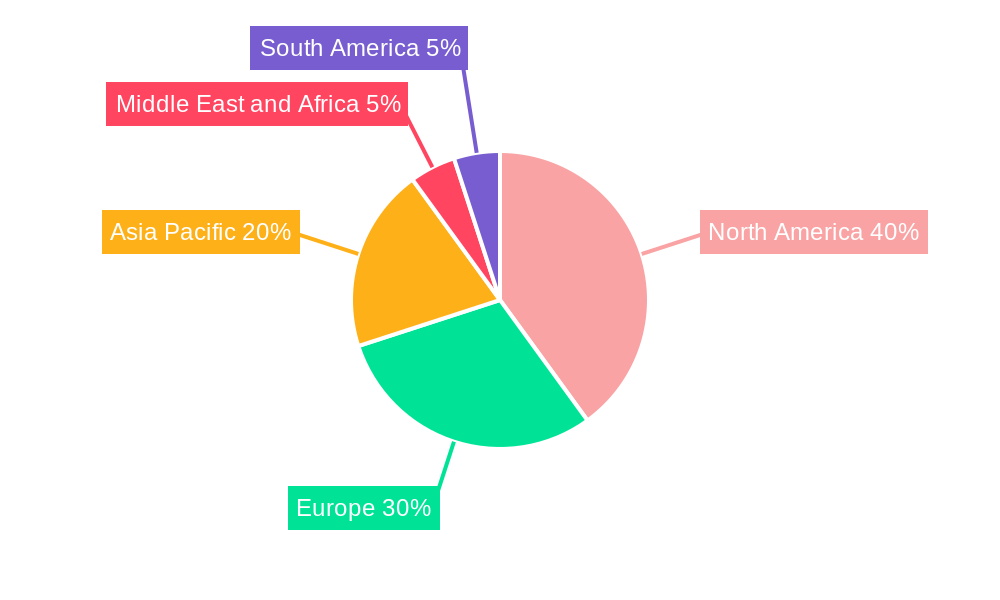
The Tyrosine Kinase Inhibitors (TKIs) market, valued at $62.13 billion in 2025, is projected to experience robust growth, driven by a compound annual growth rate (CAGR) of 8.37% from 2025 to 2033. This expansion is fueled by several key factors. The increasing prevalence of cancers like chronic myeloid leukemia (CML), lung cancer, breast cancer, and renal cell carcinoma, which are primary targets for TKIs, significantly boosts market demand. Furthermore, continuous advancements in TKI research and development are leading to the introduction of novel, more effective, and safer drugs with improved efficacy and reduced side effects. The market is segmented by type (BCR-ABL, EGFR, VEGFR, and others) and application (CML, lung cancer, breast cancer, renal cell cancer, and others), reflecting the diverse therapeutic applications of TKIs across various cancer types. The presence of major pharmaceutical players such as Novartis, Roche, Pfizer, and others ensures a competitive landscape driving innovation and accessibility. Geographic distribution shows strong presence across North America and Europe initially, but the Asia-Pacific region is expected to witness significant growth due to rising cancer incidence and increasing healthcare expenditure.
The competitive landscape is characterized by both established pharmaceutical giants and emerging players. Strategic collaborations, mergers, and acquisitions are shaping the market dynamics. However, challenges remain, including the high cost of TKIs, potential side effects, and the emergence of drug resistance. Overcoming these obstacles will require ongoing research into personalized medicine approaches and the development of next-generation TKIs. The forecast period (2025-2033) promises continued expansion, although the exact growth trajectory may be influenced by factors such as regulatory approvals, pricing strategies, and the success of new TKI candidates entering the market. The long-term outlook remains positive, driven by the unmet medical need for effective cancer therapies and the ongoing evolution of TKI technology.
Tyrosine Kinase Inhibitors (TKIs) Market: A Comprehensive Report (2019-2033)
This detailed report provides a comprehensive analysis of the Tyrosine Kinase Inhibitors (TKIs) industry, covering market size, segmentation, growth drivers, challenges, and key players. The study period spans from 2019 to 2033, with 2025 serving as the base and estimated year. This report is crucial for stakeholders seeking actionable insights into this dynamic market.
Tyrosine Kinase Inhibitors Industry Market Concentration & Innovation
The Tyrosine Kinase Inhibitors (TKIs) market exhibits a moderately concentrated landscape, dominated by a few multinational pharmaceutical giants alongside several regional players. Key players such as Takeda Pharmaceutical Company Limited, Bayer AG, Novartis AG, F Hoffmann-La Roche Ltd, AstraZeneca PLC, Eli Lilly and Company, Johnson and Johnson, Eisai Co Ltd, Boehringer Ingelheim International, Bristol-Myers Squibb Company, Pfizer Inc, Spectrum Pharmaceuticals Inc, and Jiangsu Hansoh Pharmaceutical Group Co Ltd hold significant market share, estimated at xx% collectively in 2025. Market share fluctuations are driven by new product launches, clinical trial outcomes, and pricing strategies.
Innovation is a key driver within the TKI market, fueled by ongoing research into novel drug targets and improved delivery mechanisms. Regulatory frameworks, like the FDA and EMA approvals, significantly impact market entry and growth. Generic competition and the emergence of biosimilars represent substantial pressure on the market. The high cost of TKI therapies influences end-user trends, with affordability and access being crucial considerations. M&A activity within the pharmaceutical sector, with deals valued at an estimated xx Million in 2024, further shapes the market landscape.
- Market Concentration: Highly concentrated with top 10 players holding xx% market share in 2025.
- Innovation Drivers: Research into novel targets, improved drug delivery, and personalized medicine.
- Regulatory Landscape: Stringent approvals from FDA, EMA, etc., influence market entry.
- M&A Activity: Significant M&A activity observed, with xx Million in deal value in 2024.
Tyrosine Kinase Inhibitors Industry Industry Trends & Insights
The global Tyrosine Kinase Inhibitors market is experiencing robust growth, driven by the increasing prevalence of cancers such as lung, breast, and renal cell carcinoma. Technological advancements, including targeted therapies and personalized medicine approaches, are leading to more effective treatments and improved patient outcomes. The rising demand for improved treatment efficacy and the growing geriatric population are boosting market growth. The Compound Annual Growth Rate (CAGR) is projected to be xx% from 2025 to 2033. The market penetration of TKIs in various cancer types varies significantly, with higher penetration rates in CML and lung cancer compared to other applications. Competitive dynamics are intense, with companies focusing on developing novel TKIs with enhanced efficacy and reduced side effects.
Dominant Markets & Segments in Tyrosine Kinase Inhibitors Industry
The Tyrosine Kinase Inhibitors (TKI) market is geographically diverse, with significant presence across North America, Europe, and Asia-Pacific. However, North America holds the largest market share driven by high healthcare expenditure, advanced healthcare infrastructure, and robust clinical trial activity.
Type:
- EGFR TKIs: This segment dominates due to the prevalence of EGFR-mutated lung cancer. Key growth drivers include the launch of newer generation EGFR TKIs with improved efficacy and safety profiles.
- VEGFR TKIs: Growth is driven by the rising incidence of renal cell cancer and other vascular-related cancers.
- BCR-ABL TKIs: This segment continues to grow due to the continued need for effective CML treatment.
- Other Types: This segment shows significant growth potential due to ongoing research and development in novel TKI targets.
Application:
- Lung Cancer: The largest segment driven by high prevalence and significant research focus.
- Chronic Myeloid Leukemia (CML): High efficacy of TKIs makes it a dominant application segment.
- Breast Cancer: Growth is propelled by the increasing use of TKIs in HER2-positive breast cancer.
- Renal Cell Cancer: Significant growth observed due to the effectiveness of VEGFR TKIs.
- Other Applications: This segment presents opportunities for future growth.
Key drivers for regional dominance include robust healthcare infrastructure, favorable regulatory policies, and high healthcare expenditure.
Tyrosine Kinase Inhibitors Industry Product Developments
Recent product innovations in the TKI space focus on overcoming drug resistance, improving efficacy, and reducing side effects. The development of next-generation TKIs with improved selectivity and potency is a key trend. Technological advancements such as targeted drug delivery systems are enhancing treatment efficacy and patient compliance. Companies are strategically focusing on developing TKIs for niche indications and unmet medical needs to gain a competitive advantage.
Report Scope & Segmentation Analysis
This report segments the TKI market by Type (BCR-ABL, EGFR, VEGFR, and Others) and Application (CML, Lung Cancer, Breast Cancer, Renal Cell Cancer, and Others). Each segment's growth projections, market sizes (in Million), and competitive dynamics are extensively analyzed. The report forecasts significant growth across all segments, with the EGFR and VEGFR TKI segments anticipated to exhibit the highest growth rates due to the increasing incidence of relevant cancers. The competitive landscape is characterized by intense rivalry among major players, with a focus on product innovation and strategic partnerships.
Key Drivers of Tyrosine Kinase Inhibitors Industry Growth
The TKI market is driven by several factors: the rising incidence of various cancers globally; the increasing efficacy of targeted therapies; and technological advancements in drug development and delivery. Favorable regulatory environments and rising healthcare expenditures further contribute to market growth.
Challenges in the Tyrosine Kinase Inhibitors Industry Sector
Challenges include the high cost of TKIs, the development of drug resistance, and the potential for severe side effects. Stringent regulatory processes and complex supply chains also pose challenges. Competition from generic and biosimilar drugs puts pressure on pricing and profitability. The estimated impact of these challenges on market growth in 2025 is approximately xx%.
Emerging Opportunities in Tyrosine Kinase Inhibitors Industry
Emerging opportunities include the development of novel TKIs targeting emerging cancer biomarkers, personalized medicine approaches for improved treatment efficacy, and the expansion into new and emerging markets. The development of combination therapies and improved drug delivery systems also presents significant opportunities.
Leading Players in the Tyrosine Kinase Inhibitors Industry Market
- Spectrum Pharmaceuticals Inc
- Jiangsu Hansoh Pharmaceutical Group Co Ltd
- Takeda Pharmaceutical Company Limited
- Bayer AG
- Novartis AG
- F Hoffmann-La Roche Ltd
- AstraZeneca PLC
- Eli Lilly and Company
- Johnson and Johnson
- Eisai Co Ltd
- Boehringer Ingelheim International
- Bristol-Myers Squibb Company
- Pfizer Inc
Key Developments in Tyrosine Kinase Inhibitors Industry Industry
- June 2022: The European Commission approved capmatinib (Tabrecta) for METex14-altered advanced NSCLC.
- February 2022: The European Commission approved tepotinib (TEPMETKO) for advanced NSCLC.
These approvals significantly impact market dynamics by introducing new treatment options and increasing competition.
Strategic Outlook for Tyrosine Kinase Inhibitors Industry Market
The TKI market is poised for sustained growth, driven by continuous innovation, increasing cancer prevalence, and advancements in personalized medicine. Opportunities exist in developing novel therapies targeting underserved populations and unmet medical needs. The market's future potential is significant, with continued expansion anticipated across various segments and geographical regions.
Tyrosine Kinase Inhibitors Industry Segmentation
-
1. Type
- 1.1. BCR-ABL Tyrosine Kinase Inhibitor
- 1.2. Epiderma
- 1.3. Vascular
- 1.4. Other Types
-
2. Application
- 2.1. Chronic Myeloid Leukemia (CML)
- 2.2. Lung Cancer
- 2.3. Breast Cancer
- 2.4. Renal Cell Cancer
- 2.5. Other Applications
Tyrosine Kinase Inhibitors Industry Segmentation By Geography
-
1. North America
- 1.1. United States
- 1.2. Canada
- 1.3. Mexico
-
2. Europe
- 2.1. Germany
- 2.2. United Kingdom
- 2.3. France
- 2.4. Italy
- 2.5. Spain
- 2.6. Rest of Europe
-
3. Asia Pacific
- 3.1. China
- 3.2. Japan
- 3.3. India
- 3.4. Australia
- 3.5. South Korea
- 3.6. Rest of Asia Pacific
-
4. Middle East and Africa
- 4.1. GCC
- 4.2. South Africa
- 4.3. Rest of Middle East and Africa
-
5. South America
- 5.1. Brazil
- 5.2. Argentina
- 5.3. Rest of South America
Tyrosine Kinase Inhibitors Industry REPORT HIGHLIGHTS
| Aspects | Details |
|---|---|
| Study Period | 2019-2033 |
| Base Year | 2024 |
| Estimated Year | 2025 |
| Forecast Period | 2025-2033 |
| Historical Period | 2019-2024 |
| Growth Rate | CAGR of 8.37% from 2019-2033 |
| Segmentation |
|
Table of Contents
- 1. Introduction
- 1.1. Research Scope
- 1.2. Market Segmentation
- 1.3. Research Methodology
- 1.4. Definitions and Assumptions
- 2. Executive Summary
- 2.1. Introduction
- 3. Market Dynamics
- 3.1. Introduction
- 3.2. Market Drivers
- 3.2.1. Increasing Prevalence of Cancer; Growing Research Activities and Investment in Tyrosine Kinase Inhibitors
- 3.3. Market Restrains
- 3.3.1. High Cost of Therapy
- 3.4. Market Trends
- 3.4.1. Breast Cancer Segment is Expected to Hold a Significant Market Share Over the Forecast Period
- 4. Market Factor Analysis
- 4.1. Porters Five Forces
- 4.2. Supply/Value Chain
- 4.3. PESTEL analysis
- 4.4. Market Entropy
- 4.5. Patent/Trademark Analysis
- 5. Global Tyrosine Kinase Inhibitors Industry Analysis, Insights and Forecast, 2019-2031
- 5.1. Market Analysis, Insights and Forecast - by Type
- 5.1.1. BCR-ABL Tyrosine Kinase Inhibitor
- 5.1.2. Epiderma
- 5.1.3. Vascular
- 5.1.4. Other Types
- 5.2. Market Analysis, Insights and Forecast - by Application
- 5.2.1. Chronic Myeloid Leukemia (CML)
- 5.2.2. Lung Cancer
- 5.2.3. Breast Cancer
- 5.2.4. Renal Cell Cancer
- 5.2.5. Other Applications
- 5.3. Market Analysis, Insights and Forecast - by Region
- 5.3.1. North America
- 5.3.2. Europe
- 5.3.3. Asia Pacific
- 5.3.4. Middle East and Africa
- 5.3.5. South America
- 5.1. Market Analysis, Insights and Forecast - by Type
- 6. North America Tyrosine Kinase Inhibitors Industry Analysis, Insights and Forecast, 2019-2031
- 6.1. Market Analysis, Insights and Forecast - by Type
- 6.1.1. BCR-ABL Tyrosine Kinase Inhibitor
- 6.1.2. Epiderma
- 6.1.3. Vascular
- 6.1.4. Other Types
- 6.2. Market Analysis, Insights and Forecast - by Application
- 6.2.1. Chronic Myeloid Leukemia (CML)
- 6.2.2. Lung Cancer
- 6.2.3. Breast Cancer
- 6.2.4. Renal Cell Cancer
- 6.2.5. Other Applications
- 6.1. Market Analysis, Insights and Forecast - by Type
- 7. Europe Tyrosine Kinase Inhibitors Industry Analysis, Insights and Forecast, 2019-2031
- 7.1. Market Analysis, Insights and Forecast - by Type
- 7.1.1. BCR-ABL Tyrosine Kinase Inhibitor
- 7.1.2. Epiderma
- 7.1.3. Vascular
- 7.1.4. Other Types
- 7.2. Market Analysis, Insights and Forecast - by Application
- 7.2.1. Chronic Myeloid Leukemia (CML)
- 7.2.2. Lung Cancer
- 7.2.3. Breast Cancer
- 7.2.4. Renal Cell Cancer
- 7.2.5. Other Applications
- 7.1. Market Analysis, Insights and Forecast - by Type
- 8. Asia Pacific Tyrosine Kinase Inhibitors Industry Analysis, Insights and Forecast, 2019-2031
- 8.1. Market Analysis, Insights and Forecast - by Type
- 8.1.1. BCR-ABL Tyrosine Kinase Inhibitor
- 8.1.2. Epiderma
- 8.1.3. Vascular
- 8.1.4. Other Types
- 8.2. Market Analysis, Insights and Forecast - by Application
- 8.2.1. Chronic Myeloid Leukemia (CML)
- 8.2.2. Lung Cancer
- 8.2.3. Breast Cancer
- 8.2.4. Renal Cell Cancer
- 8.2.5. Other Applications
- 8.1. Market Analysis, Insights and Forecast - by Type
- 9. Middle East and Africa Tyrosine Kinase Inhibitors Industry Analysis, Insights and Forecast, 2019-2031
- 9.1. Market Analysis, Insights and Forecast - by Type
- 9.1.1. BCR-ABL Tyrosine Kinase Inhibitor
- 9.1.2. Epiderma
- 9.1.3. Vascular
- 9.1.4. Other Types
- 9.2. Market Analysis, Insights and Forecast - by Application
- 9.2.1. Chronic Myeloid Leukemia (CML)
- 9.2.2. Lung Cancer
- 9.2.3. Breast Cancer
- 9.2.4. Renal Cell Cancer
- 9.2.5. Other Applications
- 9.1. Market Analysis, Insights and Forecast - by Type
- 10. South America Tyrosine Kinase Inhibitors Industry Analysis, Insights and Forecast, 2019-2031
- 10.1. Market Analysis, Insights and Forecast - by Type
- 10.1.1. BCR-ABL Tyrosine Kinase Inhibitor
- 10.1.2. Epiderma
- 10.1.3. Vascular
- 10.1.4. Other Types
- 10.2. Market Analysis, Insights and Forecast - by Application
- 10.2.1. Chronic Myeloid Leukemia (CML)
- 10.2.2. Lung Cancer
- 10.2.3. Breast Cancer
- 10.2.4. Renal Cell Cancer
- 10.2.5. Other Applications
- 10.1. Market Analysis, Insights and Forecast - by Type
- 11. North America Tyrosine Kinase Inhibitors Industry Analysis, Insights and Forecast, 2019-2031
- 11.1. Market Analysis, Insights and Forecast - By Country/Sub-region
- 11.1.1. undefined
- 12. Europe Tyrosine Kinase Inhibitors Industry Analysis, Insights and Forecast, 2019-2031
- 12.1. Market Analysis, Insights and Forecast - By Country/Sub-region
- 12.1.1. undefined
- 13. Asia Pacific Tyrosine Kinase Inhibitors Industry Analysis, Insights and Forecast, 2019-2031
- 13.1. Market Analysis, Insights and Forecast - By Country/Sub-region
- 13.1.1. undefined
- 14. Middle East and Africa Tyrosine Kinase Inhibitors Industry Analysis, Insights and Forecast, 2019-2031
- 14.1. Market Analysis, Insights and Forecast - By Country/Sub-region
- 14.1.1. undefined
- 15. South America Tyrosine Kinase Inhibitors Industry Analysis, Insights and Forecast, 2019-2031
- 15.1. Market Analysis, Insights and Forecast - By Country/Sub-region
- 15.1.1. undefined
- 16. Competitive Analysis
- 16.1. Global Market Share Analysis 2024
- 16.2. Company Profiles
- 16.2.1 Spectrum Pharmaceuticals Inc
- 16.2.1.1. Overview
- 16.2.1.2. Products
- 16.2.1.3. SWOT Analysis
- 16.2.1.4. Recent Developments
- 16.2.1.5. Financials (Based on Availability)
- 16.2.2 Jiangsu Hansoh Pharmaceutical Group Co Ltd
- 16.2.2.1. Overview
- 16.2.2.2. Products
- 16.2.2.3. SWOT Analysis
- 16.2.2.4. Recent Developments
- 16.2.2.5. Financials (Based on Availability)
- 16.2.3 Takeda Pharmaceutical Company Limited
- 16.2.3.1. Overview
- 16.2.3.2. Products
- 16.2.3.3. SWOT Analysis
- 16.2.3.4. Recent Developments
- 16.2.3.5. Financials (Based on Availability)
- 16.2.4 Bayer AG
- 16.2.4.1. Overview
- 16.2.4.2. Products
- 16.2.4.3. SWOT Analysis
- 16.2.4.4. Recent Developments
- 16.2.4.5. Financials (Based on Availability)
- 16.2.5 Novartis AG
- 16.2.5.1. Overview
- 16.2.5.2. Products
- 16.2.5.3. SWOT Analysis
- 16.2.5.4. Recent Developments
- 16.2.5.5. Financials (Based on Availability)
- 16.2.6 F Hoffmann-La Roche Ltd
- 16.2.6.1. Overview
- 16.2.6.2. Products
- 16.2.6.3. SWOT Analysis
- 16.2.6.4. Recent Developments
- 16.2.6.5. Financials (Based on Availability)
- 16.2.7 AstraZeneca PLC
- 16.2.7.1. Overview
- 16.2.7.2. Products
- 16.2.7.3. SWOT Analysis
- 16.2.7.4. Recent Developments
- 16.2.7.5. Financials (Based on Availability)
- 16.2.8 Eli Lilly and Company
- 16.2.8.1. Overview
- 16.2.8.2. Products
- 16.2.8.3. SWOT Analysis
- 16.2.8.4. Recent Developments
- 16.2.8.5. Financials (Based on Availability)
- 16.2.9 Johnson and Johnson
- 16.2.9.1. Overview
- 16.2.9.2. Products
- 16.2.9.3. SWOT Analysis
- 16.2.9.4. Recent Developments
- 16.2.9.5. Financials (Based on Availability)
- 16.2.10 Eisai Co Ltd
- 16.2.10.1. Overview
- 16.2.10.2. Products
- 16.2.10.3. SWOT Analysis
- 16.2.10.4. Recent Developments
- 16.2.10.5. Financials (Based on Availability)
- 16.2.11 Boehringer Ingelheim International
- 16.2.11.1. Overview
- 16.2.11.2. Products
- 16.2.11.3. SWOT Analysis
- 16.2.11.4. Recent Developments
- 16.2.11.5. Financials (Based on Availability)
- 16.2.12 Bristol-Myers Squibb Company
- 16.2.12.1. Overview
- 16.2.12.2. Products
- 16.2.12.3. SWOT Analysis
- 16.2.12.4. Recent Developments
- 16.2.12.5. Financials (Based on Availability)
- 16.2.13 Pfizer Inc
- 16.2.13.1. Overview
- 16.2.13.2. Products
- 16.2.13.3. SWOT Analysis
- 16.2.13.4. Recent Developments
- 16.2.13.5. Financials (Based on Availability)
- 16.2.1 Spectrum Pharmaceuticals Inc
List of Figures
- Figure 1: Global Tyrosine Kinase Inhibitors Industry Revenue Breakdown (Million, %) by Region 2024 & 2032
- Figure 2: Global Tyrosine Kinase Inhibitors Industry Volume Breakdown (K Unit, %) by Region 2024 & 2032
- Figure 3: North America Tyrosine Kinase Inhibitors Industry Revenue (Million), by Country 2024 & 2032
- Figure 4: North America Tyrosine Kinase Inhibitors Industry Volume (K Unit), by Country 2024 & 2032
- Figure 5: North America Tyrosine Kinase Inhibitors Industry Revenue Share (%), by Country 2024 & 2032
- Figure 6: North America Tyrosine Kinase Inhibitors Industry Volume Share (%), by Country 2024 & 2032
- Figure 7: Europe Tyrosine Kinase Inhibitors Industry Revenue (Million), by Country 2024 & 2032
- Figure 8: Europe Tyrosine Kinase Inhibitors Industry Volume (K Unit), by Country 2024 & 2032
- Figure 9: Europe Tyrosine Kinase Inhibitors Industry Revenue Share (%), by Country 2024 & 2032
- Figure 10: Europe Tyrosine Kinase Inhibitors Industry Volume Share (%), by Country 2024 & 2032
- Figure 11: Asia Pacific Tyrosine Kinase Inhibitors Industry Revenue (Million), by Country 2024 & 2032
- Figure 12: Asia Pacific Tyrosine Kinase Inhibitors Industry Volume (K Unit), by Country 2024 & 2032
- Figure 13: Asia Pacific Tyrosine Kinase Inhibitors Industry Revenue Share (%), by Country 2024 & 2032
- Figure 14: Asia Pacific Tyrosine Kinase Inhibitors Industry Volume Share (%), by Country 2024 & 2032
- Figure 15: Middle East and Africa Tyrosine Kinase Inhibitors Industry Revenue (Million), by Country 2024 & 2032
- Figure 16: Middle East and Africa Tyrosine Kinase Inhibitors Industry Volume (K Unit), by Country 2024 & 2032
- Figure 17: Middle East and Africa Tyrosine Kinase Inhibitors Industry Revenue Share (%), by Country 2024 & 2032
- Figure 18: Middle East and Africa Tyrosine Kinase Inhibitors Industry Volume Share (%), by Country 2024 & 2032
- Figure 19: South America Tyrosine Kinase Inhibitors Industry Revenue (Million), by Country 2024 & 2032
- Figure 20: South America Tyrosine Kinase Inhibitors Industry Volume (K Unit), by Country 2024 & 2032
- Figure 21: South America Tyrosine Kinase Inhibitors Industry Revenue Share (%), by Country 2024 & 2032
- Figure 22: South America Tyrosine Kinase Inhibitors Industry Volume Share (%), by Country 2024 & 2032
- Figure 23: North America Tyrosine Kinase Inhibitors Industry Revenue (Million), by Type 2024 & 2032
- Figure 24: North America Tyrosine Kinase Inhibitors Industry Volume (K Unit), by Type 2024 & 2032
- Figure 25: North America Tyrosine Kinase Inhibitors Industry Revenue Share (%), by Type 2024 & 2032
- Figure 26: North America Tyrosine Kinase Inhibitors Industry Volume Share (%), by Type 2024 & 2032
- Figure 27: North America Tyrosine Kinase Inhibitors Industry Revenue (Million), by Application 2024 & 2032
- Figure 28: North America Tyrosine Kinase Inhibitors Industry Volume (K Unit), by Application 2024 & 2032
- Figure 29: North America Tyrosine Kinase Inhibitors Industry Revenue Share (%), by Application 2024 & 2032
- Figure 30: North America Tyrosine Kinase Inhibitors Industry Volume Share (%), by Application 2024 & 2032
- Figure 31: North America Tyrosine Kinase Inhibitors Industry Revenue (Million), by Country 2024 & 2032
- Figure 32: North America Tyrosine Kinase Inhibitors Industry Volume (K Unit), by Country 2024 & 2032
- Figure 33: North America Tyrosine Kinase Inhibitors Industry Revenue Share (%), by Country 2024 & 2032
- Figure 34: North America Tyrosine Kinase Inhibitors Industry Volume Share (%), by Country 2024 & 2032
- Figure 35: Europe Tyrosine Kinase Inhibitors Industry Revenue (Million), by Type 2024 & 2032
- Figure 36: Europe Tyrosine Kinase Inhibitors Industry Volume (K Unit), by Type 2024 & 2032
- Figure 37: Europe Tyrosine Kinase Inhibitors Industry Revenue Share (%), by Type 2024 & 2032
- Figure 38: Europe Tyrosine Kinase Inhibitors Industry Volume Share (%), by Type 2024 & 2032
- Figure 39: Europe Tyrosine Kinase Inhibitors Industry Revenue (Million), by Application 2024 & 2032
- Figure 40: Europe Tyrosine Kinase Inhibitors Industry Volume (K Unit), by Application 2024 & 2032
- Figure 41: Europe Tyrosine Kinase Inhibitors Industry Revenue Share (%), by Application 2024 & 2032
- Figure 42: Europe Tyrosine Kinase Inhibitors Industry Volume Share (%), by Application 2024 & 2032
- Figure 43: Europe Tyrosine Kinase Inhibitors Industry Revenue (Million), by Country 2024 & 2032
- Figure 44: Europe Tyrosine Kinase Inhibitors Industry Volume (K Unit), by Country 2024 & 2032
- Figure 45: Europe Tyrosine Kinase Inhibitors Industry Revenue Share (%), by Country 2024 & 2032
- Figure 46: Europe Tyrosine Kinase Inhibitors Industry Volume Share (%), by Country 2024 & 2032
- Figure 47: Asia Pacific Tyrosine Kinase Inhibitors Industry Revenue (Million), by Type 2024 & 2032
- Figure 48: Asia Pacific Tyrosine Kinase Inhibitors Industry Volume (K Unit), by Type 2024 & 2032
- Figure 49: Asia Pacific Tyrosine Kinase Inhibitors Industry Revenue Share (%), by Type 2024 & 2032
- Figure 50: Asia Pacific Tyrosine Kinase Inhibitors Industry Volume Share (%), by Type 2024 & 2032
- Figure 51: Asia Pacific Tyrosine Kinase Inhibitors Industry Revenue (Million), by Application 2024 & 2032
- Figure 52: Asia Pacific Tyrosine Kinase Inhibitors Industry Volume (K Unit), by Application 2024 & 2032
- Figure 53: Asia Pacific Tyrosine Kinase Inhibitors Industry Revenue Share (%), by Application 2024 & 2032
- Figure 54: Asia Pacific Tyrosine Kinase Inhibitors Industry Volume Share (%), by Application 2024 & 2032
- Figure 55: Asia Pacific Tyrosine Kinase Inhibitors Industry Revenue (Million), by Country 2024 & 2032
- Figure 56: Asia Pacific Tyrosine Kinase Inhibitors Industry Volume (K Unit), by Country 2024 & 2032
- Figure 57: Asia Pacific Tyrosine Kinase Inhibitors Industry Revenue Share (%), by Country 2024 & 2032
- Figure 58: Asia Pacific Tyrosine Kinase Inhibitors Industry Volume Share (%), by Country 2024 & 2032
- Figure 59: Middle East and Africa Tyrosine Kinase Inhibitors Industry Revenue (Million), by Type 2024 & 2032
- Figure 60: Middle East and Africa Tyrosine Kinase Inhibitors Industry Volume (K Unit), by Type 2024 & 2032
- Figure 61: Middle East and Africa Tyrosine Kinase Inhibitors Industry Revenue Share (%), by Type 2024 & 2032
- Figure 62: Middle East and Africa Tyrosine Kinase Inhibitors Industry Volume Share (%), by Type 2024 & 2032
- Figure 63: Middle East and Africa Tyrosine Kinase Inhibitors Industry Revenue (Million), by Application 2024 & 2032
- Figure 64: Middle East and Africa Tyrosine Kinase Inhibitors Industry Volume (K Unit), by Application 2024 & 2032
- Figure 65: Middle East and Africa Tyrosine Kinase Inhibitors Industry Revenue Share (%), by Application 2024 & 2032
- Figure 66: Middle East and Africa Tyrosine Kinase Inhibitors Industry Volume Share (%), by Application 2024 & 2032
- Figure 67: Middle East and Africa Tyrosine Kinase Inhibitors Industry Revenue (Million), by Country 2024 & 2032
- Figure 68: Middle East and Africa Tyrosine Kinase Inhibitors Industry Volume (K Unit), by Country 2024 & 2032
- Figure 69: Middle East and Africa Tyrosine Kinase Inhibitors Industry Revenue Share (%), by Country 2024 & 2032
- Figure 70: Middle East and Africa Tyrosine Kinase Inhibitors Industry Volume Share (%), by Country 2024 & 2032
- Figure 71: South America Tyrosine Kinase Inhibitors Industry Revenue (Million), by Type 2024 & 2032
- Figure 72: South America Tyrosine Kinase Inhibitors Industry Volume (K Unit), by Type 2024 & 2032
- Figure 73: South America Tyrosine Kinase Inhibitors Industry Revenue Share (%), by Type 2024 & 2032
- Figure 74: South America Tyrosine Kinase Inhibitors Industry Volume Share (%), by Type 2024 & 2032
- Figure 75: South America Tyrosine Kinase Inhibitors Industry Revenue (Million), by Application 2024 & 2032
- Figure 76: South America Tyrosine Kinase Inhibitors Industry Volume (K Unit), by Application 2024 & 2032
- Figure 77: South America Tyrosine Kinase Inhibitors Industry Revenue Share (%), by Application 2024 & 2032
- Figure 78: South America Tyrosine Kinase Inhibitors Industry Volume Share (%), by Application 2024 & 2032
- Figure 79: South America Tyrosine Kinase Inhibitors Industry Revenue (Million), by Country 2024 & 2032
- Figure 80: South America Tyrosine Kinase Inhibitors Industry Volume (K Unit), by Country 2024 & 2032
- Figure 81: South America Tyrosine Kinase Inhibitors Industry Revenue Share (%), by Country 2024 & 2032
- Figure 82: South America Tyrosine Kinase Inhibitors Industry Volume Share (%), by Country 2024 & 2032
List of Tables
- Table 1: Global Tyrosine Kinase Inhibitors Industry Revenue Million Forecast, by Region 2019 & 2032
- Table 2: Global Tyrosine Kinase Inhibitors Industry Volume K Unit Forecast, by Region 2019 & 2032
- Table 3: Global Tyrosine Kinase Inhibitors Industry Revenue Million Forecast, by Type 2019 & 2032
- Table 4: Global Tyrosine Kinase Inhibitors Industry Volume K Unit Forecast, by Type 2019 & 2032
- Table 5: Global Tyrosine Kinase Inhibitors Industry Revenue Million Forecast, by Application 2019 & 2032
- Table 6: Global Tyrosine Kinase Inhibitors Industry Volume K Unit Forecast, by Application 2019 & 2032
- Table 7: Global Tyrosine Kinase Inhibitors Industry Revenue Million Forecast, by Region 2019 & 2032
- Table 8: Global Tyrosine Kinase Inhibitors Industry Volume K Unit Forecast, by Region 2019 & 2032
- Table 9: Global Tyrosine Kinase Inhibitors Industry Revenue Million Forecast, by Country 2019 & 2032
- Table 10: Global Tyrosine Kinase Inhibitors Industry Volume K Unit Forecast, by Country 2019 & 2032
- Table 11: Global Tyrosine Kinase Inhibitors Industry Revenue Million Forecast, by Country 2019 & 2032
- Table 12: Global Tyrosine Kinase Inhibitors Industry Volume K Unit Forecast, by Country 2019 & 2032
- Table 13: Global Tyrosine Kinase Inhibitors Industry Revenue Million Forecast, by Country 2019 & 2032
- Table 14: Global Tyrosine Kinase Inhibitors Industry Volume K Unit Forecast, by Country 2019 & 2032
- Table 15: Global Tyrosine Kinase Inhibitors Industry Revenue Million Forecast, by Country 2019 & 2032
- Table 16: Global Tyrosine Kinase Inhibitors Industry Volume K Unit Forecast, by Country 2019 & 2032
- Table 17: Global Tyrosine Kinase Inhibitors Industry Revenue Million Forecast, by Country 2019 & 2032
- Table 18: Global Tyrosine Kinase Inhibitors Industry Volume K Unit Forecast, by Country 2019 & 2032
- Table 19: Global Tyrosine Kinase Inhibitors Industry Revenue Million Forecast, by Type 2019 & 2032
- Table 20: Global Tyrosine Kinase Inhibitors Industry Volume K Unit Forecast, by Type 2019 & 2032
- Table 21: Global Tyrosine Kinase Inhibitors Industry Revenue Million Forecast, by Application 2019 & 2032
- Table 22: Global Tyrosine Kinase Inhibitors Industry Volume K Unit Forecast, by Application 2019 & 2032
- Table 23: Global Tyrosine Kinase Inhibitors Industry Revenue Million Forecast, by Country 2019 & 2032
- Table 24: Global Tyrosine Kinase Inhibitors Industry Volume K Unit Forecast, by Country 2019 & 2032
- Table 25: United States Tyrosine Kinase Inhibitors Industry Revenue (Million) Forecast, by Application 2019 & 2032
- Table 26: United States Tyrosine Kinase Inhibitors Industry Volume (K Unit) Forecast, by Application 2019 & 2032
- Table 27: Canada Tyrosine Kinase Inhibitors Industry Revenue (Million) Forecast, by Application 2019 & 2032
- Table 28: Canada Tyrosine Kinase Inhibitors Industry Volume (K Unit) Forecast, by Application 2019 & 2032
- Table 29: Mexico Tyrosine Kinase Inhibitors Industry Revenue (Million) Forecast, by Application 2019 & 2032
- Table 30: Mexico Tyrosine Kinase Inhibitors Industry Volume (K Unit) Forecast, by Application 2019 & 2032
- Table 31: Global Tyrosine Kinase Inhibitors Industry Revenue Million Forecast, by Type 2019 & 2032
- Table 32: Global Tyrosine Kinase Inhibitors Industry Volume K Unit Forecast, by Type 2019 & 2032
- Table 33: Global Tyrosine Kinase Inhibitors Industry Revenue Million Forecast, by Application 2019 & 2032
- Table 34: Global Tyrosine Kinase Inhibitors Industry Volume K Unit Forecast, by Application 2019 & 2032
- Table 35: Global Tyrosine Kinase Inhibitors Industry Revenue Million Forecast, by Country 2019 & 2032
- Table 36: Global Tyrosine Kinase Inhibitors Industry Volume K Unit Forecast, by Country 2019 & 2032
- Table 37: Germany Tyrosine Kinase Inhibitors Industry Revenue (Million) Forecast, by Application 2019 & 2032
- Table 38: Germany Tyrosine Kinase Inhibitors Industry Volume (K Unit) Forecast, by Application 2019 & 2032
- Table 39: United Kingdom Tyrosine Kinase Inhibitors Industry Revenue (Million) Forecast, by Application 2019 & 2032
- Table 40: United Kingdom Tyrosine Kinase Inhibitors Industry Volume (K Unit) Forecast, by Application 2019 & 2032
- Table 41: France Tyrosine Kinase Inhibitors Industry Revenue (Million) Forecast, by Application 2019 & 2032
- Table 42: France Tyrosine Kinase Inhibitors Industry Volume (K Unit) Forecast, by Application 2019 & 2032
- Table 43: Italy Tyrosine Kinase Inhibitors Industry Revenue (Million) Forecast, by Application 2019 & 2032
- Table 44: Italy Tyrosine Kinase Inhibitors Industry Volume (K Unit) Forecast, by Application 2019 & 2032
- Table 45: Spain Tyrosine Kinase Inhibitors Industry Revenue (Million) Forecast, by Application 2019 & 2032
- Table 46: Spain Tyrosine Kinase Inhibitors Industry Volume (K Unit) Forecast, by Application 2019 & 2032
- Table 47: Rest of Europe Tyrosine Kinase Inhibitors Industry Revenue (Million) Forecast, by Application 2019 & 2032
- Table 48: Rest of Europe Tyrosine Kinase Inhibitors Industry Volume (K Unit) Forecast, by Application 2019 & 2032
- Table 49: Global Tyrosine Kinase Inhibitors Industry Revenue Million Forecast, by Type 2019 & 2032
- Table 50: Global Tyrosine Kinase Inhibitors Industry Volume K Unit Forecast, by Type 2019 & 2032
- Table 51: Global Tyrosine Kinase Inhibitors Industry Revenue Million Forecast, by Application 2019 & 2032
- Table 52: Global Tyrosine Kinase Inhibitors Industry Volume K Unit Forecast, by Application 2019 & 2032
- Table 53: Global Tyrosine Kinase Inhibitors Industry Revenue Million Forecast, by Country 2019 & 2032
- Table 54: Global Tyrosine Kinase Inhibitors Industry Volume K Unit Forecast, by Country 2019 & 2032
- Table 55: China Tyrosine Kinase Inhibitors Industry Revenue (Million) Forecast, by Application 2019 & 2032
- Table 56: China Tyrosine Kinase Inhibitors Industry Volume (K Unit) Forecast, by Application 2019 & 2032
- Table 57: Japan Tyrosine Kinase Inhibitors Industry Revenue (Million) Forecast, by Application 2019 & 2032
- Table 58: Japan Tyrosine Kinase Inhibitors Industry Volume (K Unit) Forecast, by Application 2019 & 2032
- Table 59: India Tyrosine Kinase Inhibitors Industry Revenue (Million) Forecast, by Application 2019 & 2032
- Table 60: India Tyrosine Kinase Inhibitors Industry Volume (K Unit) Forecast, by Application 2019 & 2032
- Table 61: Australia Tyrosine Kinase Inhibitors Industry Revenue (Million) Forecast, by Application 2019 & 2032
- Table 62: Australia Tyrosine Kinase Inhibitors Industry Volume (K Unit) Forecast, by Application 2019 & 2032
- Table 63: South Korea Tyrosine Kinase Inhibitors Industry Revenue (Million) Forecast, by Application 2019 & 2032
- Table 64: South Korea Tyrosine Kinase Inhibitors Industry Volume (K Unit) Forecast, by Application 2019 & 2032
- Table 65: Rest of Asia Pacific Tyrosine Kinase Inhibitors Industry Revenue (Million) Forecast, by Application 2019 & 2032
- Table 66: Rest of Asia Pacific Tyrosine Kinase Inhibitors Industry Volume (K Unit) Forecast, by Application 2019 & 2032
- Table 67: Global Tyrosine Kinase Inhibitors Industry Revenue Million Forecast, by Type 2019 & 2032
- Table 68: Global Tyrosine Kinase Inhibitors Industry Volume K Unit Forecast, by Type 2019 & 2032
- Table 69: Global Tyrosine Kinase Inhibitors Industry Revenue Million Forecast, by Application 2019 & 2032
- Table 70: Global Tyrosine Kinase Inhibitors Industry Volume K Unit Forecast, by Application 2019 & 2032
- Table 71: Global Tyrosine Kinase Inhibitors Industry Revenue Million Forecast, by Country 2019 & 2032
- Table 72: Global Tyrosine Kinase Inhibitors Industry Volume K Unit Forecast, by Country 2019 & 2032
- Table 73: GCC Tyrosine Kinase Inhibitors Industry Revenue (Million) Forecast, by Application 2019 & 2032
- Table 74: GCC Tyrosine Kinase Inhibitors Industry Volume (K Unit) Forecast, by Application 2019 & 2032
- Table 75: South Africa Tyrosine Kinase Inhibitors Industry Revenue (Million) Forecast, by Application 2019 & 2032
- Table 76: South Africa Tyrosine Kinase Inhibitors Industry Volume (K Unit) Forecast, by Application 2019 & 2032
- Table 77: Rest of Middle East and Africa Tyrosine Kinase Inhibitors Industry Revenue (Million) Forecast, by Application 2019 & 2032
- Table 78: Rest of Middle East and Africa Tyrosine Kinase Inhibitors Industry Volume (K Unit) Forecast, by Application 2019 & 2032
- Table 79: Global Tyrosine Kinase Inhibitors Industry Revenue Million Forecast, by Type 2019 & 2032
- Table 80: Global Tyrosine Kinase Inhibitors Industry Volume K Unit Forecast, by Type 2019 & 2032
- Table 81: Global Tyrosine Kinase Inhibitors Industry Revenue Million Forecast, by Application 2019 & 2032
- Table 82: Global Tyrosine Kinase Inhibitors Industry Volume K Unit Forecast, by Application 2019 & 2032
- Table 83: Global Tyrosine Kinase Inhibitors Industry Revenue Million Forecast, by Country 2019 & 2032
- Table 84: Global Tyrosine Kinase Inhibitors Industry Volume K Unit Forecast, by Country 2019 & 2032
- Table 85: Brazil Tyrosine Kinase Inhibitors Industry Revenue (Million) Forecast, by Application 2019 & 2032
- Table 86: Brazil Tyrosine Kinase Inhibitors Industry Volume (K Unit) Forecast, by Application 2019 & 2032
- Table 87: Argentina Tyrosine Kinase Inhibitors Industry Revenue (Million) Forecast, by Application 2019 & 2032
- Table 88: Argentina Tyrosine Kinase Inhibitors Industry Volume (K Unit) Forecast, by Application 2019 & 2032
- Table 89: Rest of South America Tyrosine Kinase Inhibitors Industry Revenue (Million) Forecast, by Application 2019 & 2032
- Table 90: Rest of South America Tyrosine Kinase Inhibitors Industry Volume (K Unit) Forecast, by Application 2019 & 2032
Frequently Asked Questions
1. What is the projected Compound Annual Growth Rate (CAGR) of the Tyrosine Kinase Inhibitors Industry?
The projected CAGR is approximately 8.37%.
2. Which companies are prominent players in the Tyrosine Kinase Inhibitors Industry?
Key companies in the market include Spectrum Pharmaceuticals Inc, Jiangsu Hansoh Pharmaceutical Group Co Ltd, Takeda Pharmaceutical Company Limited , Bayer AG, Novartis AG, F Hoffmann-La Roche Ltd, AstraZeneca PLC, Eli Lilly and Company, Johnson and Johnson, Eisai Co Ltd, Boehringer Ingelheim International, Bristol-Myers Squibb Company, Pfizer Inc.
3. What are the main segments of the Tyrosine Kinase Inhibitors Industry?
The market segments include Type, Application.
4. Can you provide details about the market size?
The market size is estimated to be USD 62.13 Million as of 2022.
5. What are some drivers contributing to market growth?
Increasing Prevalence of Cancer; Growing Research Activities and Investment in Tyrosine Kinase Inhibitors.
6. What are the notable trends driving market growth?
Breast Cancer Segment is Expected to Hold a Significant Market Share Over the Forecast Period.
7. Are there any restraints impacting market growth?
High Cost of Therapy.
8. Can you provide examples of recent developments in the market?
In June 2022, The European Commission approved capmatinib (Tabrecta), a tyrosine kinase inhibitor, as a single agent for the treatment of patients with MET exon14 skipping (METex14) altered advanced non-small cell lung cancer (NSCLC) who require systemic therapy following prior treatment with immunotherapy and/or platinum-based chemotherapy.
9. What pricing options are available for accessing the report?
Pricing options include single-user, multi-user, and enterprise licenses priced at USD 4750, USD 5250, and USD 8750 respectively.
10. Is the market size provided in terms of value or volume?
The market size is provided in terms of value, measured in Million and volume, measured in K Unit.
11. Are there any specific market keywords associated with the report?
Yes, the market keyword associated with the report is "Tyrosine Kinase Inhibitors Industry," which aids in identifying and referencing the specific market segment covered.
12. How do I determine which pricing option suits my needs best?
The pricing options vary based on user requirements and access needs. Individual users may opt for single-user licenses, while businesses requiring broader access may choose multi-user or enterprise licenses for cost-effective access to the report.
13. Are there any additional resources or data provided in the Tyrosine Kinase Inhibitors Industry report?
While the report offers comprehensive insights, it's advisable to review the specific contents or supplementary materials provided to ascertain if additional resources or data are available.
14. How can I stay updated on further developments or reports in the Tyrosine Kinase Inhibitors Industry?
To stay informed about further developments, trends, and reports in the Tyrosine Kinase Inhibitors Industry, consider subscribing to industry newsletters, following relevant companies and organizations, or regularly checking reputable industry news sources and publications.
Methodology
Step 1 - Identification of Relevant Samples Size from Population Database


Step 2 - Approaches for Defining Global Market Size (Value, Volume* & Price*)

Note*: In applicable scenarios
Step 3 - Data Sources
Primary Research
- Web Analytics
- Survey Reports
- Research Institute
- Latest Research Reports
- Opinion Leaders
Secondary Research
- Annual Reports
- White Paper
- Latest Press Release
- Industry Association
- Paid Database
- Investor Presentations

Step 4 - Data Triangulation
Involves using different sources of information in order to increase the validity of a study
These sources are likely to be stakeholders in a program - participants, other researchers, program staff, other community members, and so on.
Then we put all data in single framework & apply various statistical tools to find out the dynamic on the market.
During the analysis stage, feedback from the stakeholder groups would be compared to determine areas of agreement as well as areas of divergence


