

Key Insights
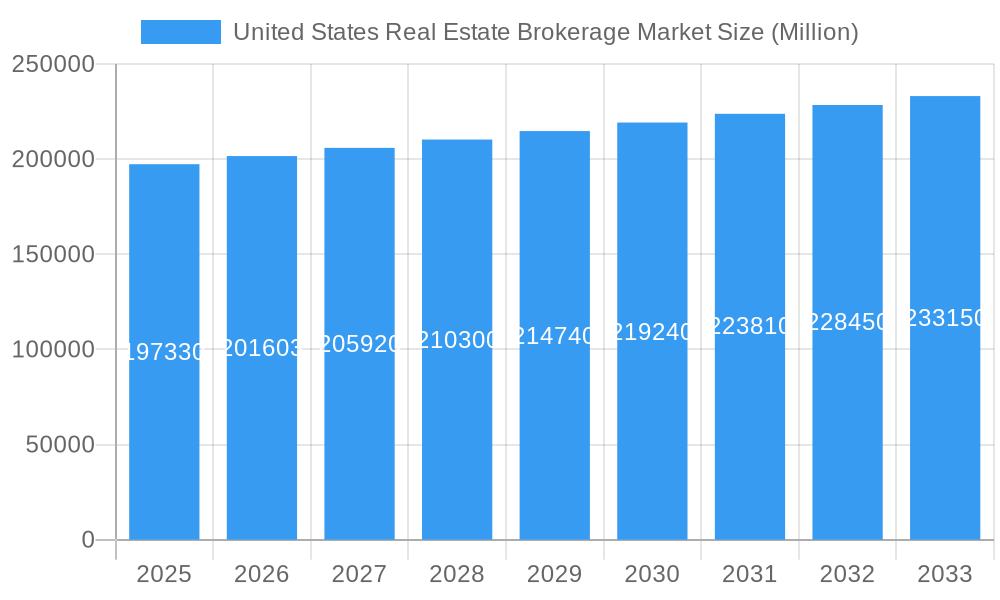
The United States real estate brokerage market, valued at $197.33 billion in 2025, is projected to experience steady growth, driven primarily by a robust housing market, increasing population density in key urban areas, and the ongoing adoption of technological advancements within the industry. The 2.10% Compound Annual Growth Rate (CAGR) from 2025 to 2033 indicates a consistent, albeit moderate, expansion. Key drivers include the rise of iBuyer models offering streamlined transactions, the increasing use of sophisticated data analytics for property valuation and market prediction, and the growing preference for online property search and virtual tours. Furthermore, the market's resilience against economic fluctuations and the ongoing demand for housing, even in periods of economic uncertainty, contributes to its sustained growth trajectory. The market is segmented by various service offerings (residential, commercial, etc.) and geographically across the US states. Major players like Keller Williams, RE/MAX, Coldwell Banker, and Berkshire Hathaway Home Services dominate the landscape, leveraging their established brand recognition and extensive networks to maintain market share. However, newer entrants and innovative business models continue to exert pressure, prompting established firms to adapt and innovate to maintain their competitive edge.
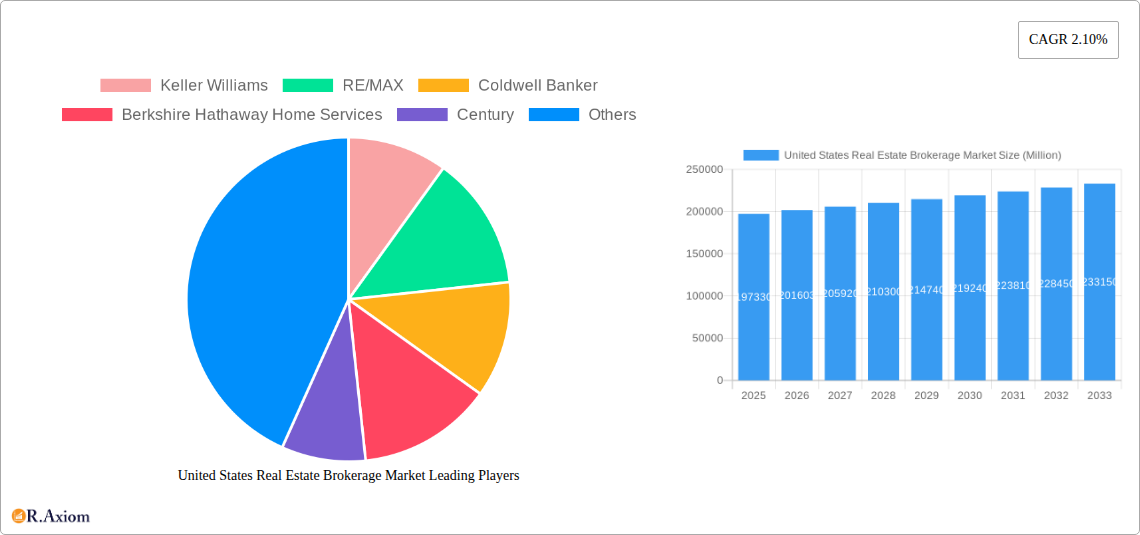
United States Real Estate Brokerage Market Market Size (In Billion)
Despite the overall positive outlook, certain factors could restrain market growth. Increasing interest rates might cool down the housing market's enthusiasm, impacting transaction volumes. Regulatory changes and increased compliance costs associated with broker activities could also affect profitability. The market faces competitive pressure not only from established brokerage firms but also from emerging PropTech companies offering disruptive technologies, potentially reshaping traditional brokerage services and attracting market share. Nevertheless, the long-term outlook for the US real estate brokerage market remains positive, driven by fundamental demographic and economic factors. The continuous demand for housing, coupled with advancements in technology that enhance the efficiency and convenience of real estate transactions, will likely support sustained market growth over the forecast period.
United States Real Estate Brokerage Market Company Market Share
United States Real Estate Brokerage Market: A Comprehensive Report (2019-2033)
This in-depth report provides a comprehensive analysis of the United States real estate brokerage market, covering the period 2019-2033. It delves into market dynamics, competitive landscapes, and future growth projections, offering valuable insights for industry stakeholders, investors, and strategic decision-makers. The report utilizes a robust methodology combining extensive secondary research with primary data points to provide a holistic view of the market. The market size is estimated at xx Million in 2025 and is projected to reach xx Million by 2033.
United States Real Estate Brokerage Market Market Concentration & Innovation
The U.S. real estate brokerage market exhibits a moderately concentrated structure, with several large players commanding significant market share. Key players include Keller Williams, RE/MAX, Coldwell Banker, Berkshire Hathaway Home Services, Century 21, Sotheby's International Realty, Compass, eXp Realty, Realogy Holdings Corp, and Redfin, along with 63 other companies. While these firms dominate, a fragmented landscape of smaller, regional brokerages also exists. Market share data for 2024 indicates that the top five players hold approximately xx% of the market collectively.
Innovation is driven by technological advancements, including the adoption of CRM systems, virtual tours, and online property listings. Regulatory frameworks, such as fair housing laws and licensing requirements, significantly impact market operations. The emergence of iBuying platforms and PropTech companies presents substantial competition, while consumer trends towards online property searches and remote work influence market demands. Significant M&A activity, like Compass's recent acquisitions of Parks Real Estate and Latter & Blum (detailed in the Key Developments section), further shapes the market landscape, with deal values in 2024 reaching an estimated xx Million. The increasing use of data analytics and AI-driven tools is also contributing to market transformation.
United States Real Estate Brokerage Market Industry Trends & Insights
The U.S. real estate brokerage market experienced a compound annual growth rate (CAGR) of xx% during the historical period (2019-2024), driven by factors such as population growth, increasing urbanization, and rising disposable incomes. Technological disruptions, including the rise of online platforms and mobile apps, have significantly altered consumer behavior, leading to increased market penetration of digital channels. Consumer preferences are shifting towards personalized experiences, enhanced transparency, and efficient transaction processes, leading to a competitive landscape that necessitates continuous innovation. Market penetration of online real estate portals continues to grow, while traditional brick-and-mortar brokerages are adapting through hybrid models integrating both online and offline services. The increasing use of virtual and augmented reality technologies is expected to further reshape the industry. The forecast period (2025-2033) anticipates a CAGR of xx%, driven by ongoing technological advancements, robust economic growth in specific segments, and evolving consumer preferences.
Dominant Markets & Segments in United States Real Estate Brokerage Market
The U.S. real estate brokerage market is geographically diverse, with significant activity across various regions. However, major metropolitan areas and high-growth states consistently exhibit high transaction volumes and robust market activity. The leading segments include:
- Residential: This segment dominates, driven by population growth and changing housing preferences.
- Commercial: This segment displays steady growth, fueled by increasing investment in commercial real estate.
Key drivers for dominance include:
- Strong economic growth: States with robust economies generally show higher real estate activity.
- Favorable demographics: Areas with a growing population and increasing household formation tend to experience greater demand.
- Infrastructure development: Improvements in infrastructure, such as transportation networks, enhance property values and attract investors.
- Government policies: Tax incentives or regulatory changes can influence market activity.
A detailed analysis reveals that the strongest markets are characterized by a convergence of these factors, resulting in higher transaction volumes and increased competition.
United States Real Estate Brokerage Market Product Developments
Recent product innovations center around technological advancements designed to streamline the real estate transaction process and enhance the client experience. This includes the integration of advanced data analytics, AI-powered tools for property valuation and market analysis, virtual and augmented reality applications for property tours, and improved CRM systems for enhanced client communication and relationship management. These innovations enhance efficiency, improve accuracy, and offer a more personalized and engaging experience for both buyers and sellers, creating significant competitive advantages for firms that adopt them effectively.
Report Scope & Segmentation Analysis
This report segments the U.S. real estate brokerage market based on several key factors:
By Property Type: Residential, Commercial, Industrial, Land. Each segment presents unique growth trajectories and competitive dynamics. For example, the residential segment holds the largest market share, while the commercial segment offers significant growth opportunities. Growth projections for each vary, with residential expected to maintain steady growth and commercial expected to see a xx% increase by 2033.
By Service Type: Sales, Leasing, Property Management. The sales segment dominates, but property management is a fast-growing segment. Competition is fierce across all service types, with firms differentiating based on service quality, technological capabilities and specialized expertise.
By Company Size: Large, Medium, Small. The large companies usually hold the majority of market share due to brand recognition, resources and geographical reach. The smaller companies focus on niches and superior client service.
Key Drivers of United States Real Estate Brokerage Market Growth
The U.S. real estate brokerage market's growth is driven by a combination of factors. Technological advancements, such as online platforms and AI-powered tools, are streamlining processes and enhancing efficiency. Economic growth, particularly in certain regions, fuels demand for housing and commercial properties. Furthermore, supportive government policies and regulatory frameworks contribute to market stability and growth, encouraging investment and property transactions. The increasing adoption of PropTech solutions is expected to further boost market growth.
Challenges in the United States Real Estate Brokerage Market Sector
The market faces several challenges. Intense competition among established firms and emerging PropTech companies puts pressure on margins and necessitates continuous innovation. Regulatory hurdles and compliance requirements increase operational costs. Economic downturns can significantly impact transaction volumes, leading to decreased revenues. Fluctuations in interest rates and mortgage availability influence market sentiment and purchasing power, thus impacting overall market growth. The overall impact of these challenges is estimated at a xx% reduction in market growth in certain periods.
Emerging Opportunities in United States Real Estate Brokerage Market
Several emerging opportunities exist. The expansion into niche markets, such as luxury properties or specific geographical areas, offers potential for growth. The adoption of innovative technologies, such as blockchain for secure transactions or AI-driven market analysis, can improve efficiency and enhance client experiences. Furthermore, a focus on providing customized and personalized services caters to evolving consumer preferences. These opportunities collectively contribute to the projected xx% market growth.
Leading Players in the United States Real Estate Brokerage Market Market
Key Developments in United States Real Estate Brokerage Market Industry
- May 2024: Compass Inc. acquired Parks Real Estate, expanding its agent network and technological reach.
- April 2024: Compass finalized its acquisition of Latter & Blum, strengthening its presence in the Gulf Coast region.
These acquisitions illustrate the ongoing consolidation within the industry and the importance of technological capabilities and geographic expansion strategies.
Strategic Outlook for United States Real Estate Brokerage Market Market
The U.S. real estate brokerage market is poised for continued growth, driven by technological innovation, demographic shifts, and evolving consumer preferences. Firms that embrace technological advancements, focus on client experience, and adapt to market dynamics will be best positioned to capitalize on the opportunities presented in the coming years. The market’s future growth is projected to be fueled by a combination of organic growth and strategic acquisitions, leading to increased market concentration among the leading players.
United States Real Estate Brokerage Market Segmentation
-
1. Type
- 1.1. Residential
- 1.2. Non-Residential
-
2. Service
- 2.1. Sales
- 2.2. Rental
United States Real Estate Brokerage Market Segmentation By Geography
- 1. United States
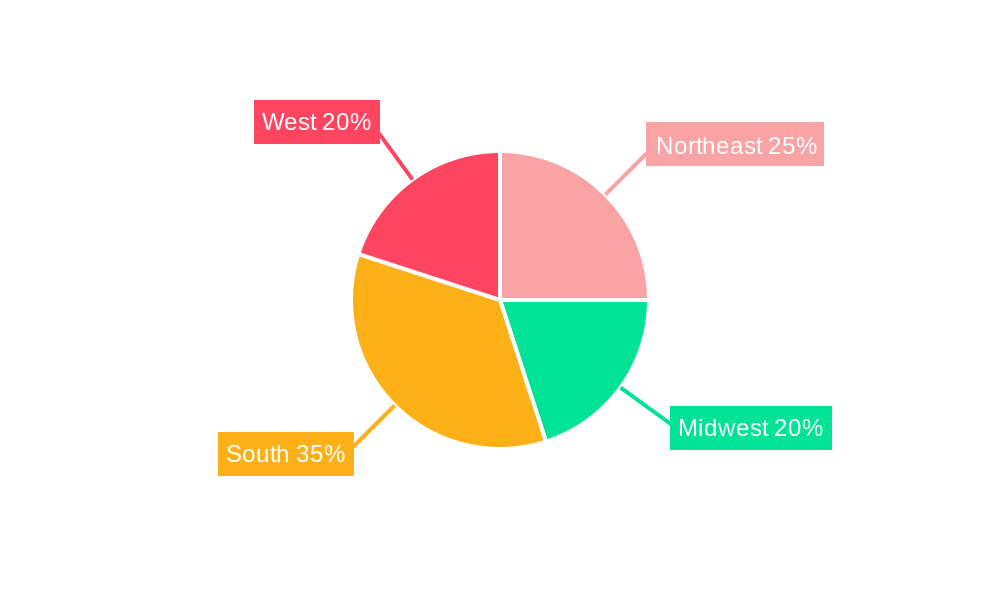
United States Real Estate Brokerage Market Regional Market Share
Geographic Coverage of United States Real Estate Brokerage Market
United States Real Estate Brokerage Market REPORT HIGHLIGHTS
| Aspects | Details |
|---|---|
| Study Period | 2020-2034 |
| Base Year | 2025 |
| Estimated Year | 2026 |
| Forecast Period | 2026-2034 |
| Historical Period | 2020-2025 |
| Growth Rate | CAGR of 2.10% from 2020-2034 |
| Segmentation |
|
Table of Contents
- 1. Introduction
- 1.1. Research Scope
- 1.2. Market Segmentation
- 1.3. Research Objective
- 1.4. Definitions and Assumptions
- 2. Executive Summary
- 2.1. Market Snapshot
- 3. Market Dynamics
- 3.1. Market Drivers
- 3.2. Market Restrains
- 3.3. Market Trends
- 3.4. Market Opportunities
- 4. Market Factor Analysis
- 4.1. Porters Five Forces
- 4.1.1. Bargaining Power of Suppliers
- 4.1.2. Bargaining Power of Buyers
- 4.1.3. Threat of New Entrants
- 4.1.4. Threat of Substitutes
- 4.1.5. Competitive Rivalry
- 4.2. PESTEL analysis
- 4.3. BCG Analysis
- 4.3.1. Stars (High Growth, High Market Share)
- 4.3.2. Cash Cows (Low Growth, High Market Share)
- 4.3.3. Question Mark (High Growth, Low Market Share)
- 4.3.4. Dogs (Low Growth, Low Market Share)
- 4.4. Ansoff Matrix Analysis
- 4.5. Supply Chain Analysis
- 4.6. Regulatory Landscape
- 4.7. Current Market Potential and Opportunity Assessment (TAM–SAM–SOM Framework)
- 4.8. RAX Analyst Note
- 4.1. Porters Five Forces
- 5. Market Analysis, Insights and Forecast 2021-2033
- 5.1. Market Analysis, Insights and Forecast - by Type
- 5.1.1. Residential
- 5.1.2. Non-Residential
- 5.2. Market Analysis, Insights and Forecast - by Service
- 5.2.1. Sales
- 5.2.2. Rental
- 5.3. Market Analysis, Insights and Forecast - by Region
- 5.3.1. United States
- 5.1. Market Analysis, Insights and Forecast - by Type
- 6. United States Real Estate Brokerage Market Analysis, Insights and Forecast, 2021-2033
- 6.1. Market Analysis, Insights and Forecast - by Type
- 6.1.1. Residential
- 6.1.2. Non-Residential
- 6.2. Market Analysis, Insights and Forecast - by Service
- 6.2.1. Sales
- 6.2.2. Rental
- 6.1. Market Analysis, Insights and Forecast - by Type
- 7. Competitive Analysis
- 7.1. Company Profiles
- 7.1.1 Keller Williams
- 7.1.1.1. Company Overview
- 7.1.1.2. Products
- 7.1.1.3. Company Financials
- 7.1.1.4. SWOT Analysis
- 7.1.2 RE/MAX
- 7.1.2.1. Company Overview
- 7.1.2.2. Products
- 7.1.2.3. Company Financials
- 7.1.2.4. SWOT Analysis
- 7.1.3 Coldwell Banker
- 7.1.3.1. Company Overview
- 7.1.3.2. Products
- 7.1.3.3. Company Financials
- 7.1.3.4. SWOT Analysis
- 7.1.4 Berkshire Hathaway Home Services
- 7.1.4.1. Company Overview
- 7.1.4.2. Products
- 7.1.4.3. Company Financials
- 7.1.4.4. SWOT Analysis
- 7.1.5 Century
- 7.1.5.1. Company Overview
- 7.1.5.2. Products
- 7.1.5.3. Company Financials
- 7.1.5.4. SWOT Analysis
- 7.1.6 Sotheby's International Realty
- 7.1.6.1. Company Overview
- 7.1.6.2. Products
- 7.1.6.3. Company Financials
- 7.1.6.4. SWOT Analysis
- 7.1.7 Compass
- 7.1.7.1. Company Overview
- 7.1.7.2. Products
- 7.1.7.3. Company Financials
- 7.1.7.4. SWOT Analysis
- 7.1.8 eXp Realty
- 7.1.8.1. Company Overview
- 7.1.8.2. Products
- 7.1.8.3. Company Financials
- 7.1.8.4. SWOT Analysis
- 7.1.9 Realogy Holdings Corp
- 7.1.9.1. Company Overview
- 7.1.9.2. Products
- 7.1.9.3. Company Financials
- 7.1.9.4. SWOT Analysis
- 7.1.10 Redfin**List Not Exhaustive 6 3 Other Companie
- 7.1.10.1. Company Overview
- 7.1.10.2. Products
- 7.1.10.3. Company Financials
- 7.1.10.4. SWOT Analysis
- 7.1.1 Keller Williams
- 7.2. Market Entropy
- 7.2.1 Company's Key Areas Served
- 7.2.2 Recent Developments
- 7.3. Company Market Share Analysis 2025
- 7.3.1 Top 5 Companies Market Share Analysis
- 7.3.2 Top 3 Companies Market Share Analysis
- 7.4. List of Potential Customers
- 8. Research Methodology
List of Figures
- Figure 1: United States Real Estate Brokerage Market Revenue Breakdown (Million, %) by Product 2025 & 2033
- Figure 2: United States Real Estate Brokerage Market Share (%) by Company 2025
List of Tables
- Table 1: United States Real Estate Brokerage Market Revenue Million Forecast, by Type 2020 & 2033
- Table 2: United States Real Estate Brokerage Market Volume Billion Forecast, by Type 2020 & 2033
- Table 3: United States Real Estate Brokerage Market Revenue Million Forecast, by Service 2020 & 2033
- Table 4: United States Real Estate Brokerage Market Volume Billion Forecast, by Service 2020 & 2033
- Table 5: United States Real Estate Brokerage Market Revenue Million Forecast, by Region 2020 & 2033
- Table 6: United States Real Estate Brokerage Market Volume Billion Forecast, by Region 2020 & 2033
- Table 7: United States Real Estate Brokerage Market Revenue Million Forecast, by Type 2020 & 2033
- Table 8: United States Real Estate Brokerage Market Volume Billion Forecast, by Type 2020 & 2033
- Table 9: United States Real Estate Brokerage Market Revenue Million Forecast, by Service 2020 & 2033
- Table 10: United States Real Estate Brokerage Market Volume Billion Forecast, by Service 2020 & 2033
- Table 11: United States Real Estate Brokerage Market Revenue Million Forecast, by Country 2020 & 2033
- Table 12: United States Real Estate Brokerage Market Volume Billion Forecast, by Country 2020 & 2033
Frequently Asked Questions
1. What is the projected Compound Annual Growth Rate (CAGR) of the United States Real Estate Brokerage Market?
The projected CAGR is approximately 2.10%.
2. Which companies are prominent players in the United States Real Estate Brokerage Market?
Key companies in the market include Keller Williams, RE/MAX, Coldwell Banker, Berkshire Hathaway Home Services, Century, Sotheby's International Realty, Compass, eXp Realty, Realogy Holdings Corp, Redfin**List Not Exhaustive 6 3 Other Companie.
3. What are the main segments of the United States Real Estate Brokerage Market?
The market segments include Type, Service.
4. Can you provide details about the market size?
The market size is estimated to be USD 197.33 Million as of 2022.
5. What are some drivers contributing to market growth?
4.; Increasing Urbanization Driving the Market4.; Regulatory Environment Driving the market.
6. What are the notable trends driving market growth?
Industrial Sector Leads Real Estate Absorption. Retail Tightens Vacancy Rates.
7. Are there any restraints impacting market growth?
4.; Increasing Urbanization Driving the Market4.; Regulatory Environment Driving the market.
8. Can you provide examples of recent developments in the market?
May 2024: Compass Inc., the leading residential real estate brokerage by sales volume in the United States, acquired Parks Real Estate, Tennessee's top residential real estate firm that boasts over 1,500 agents. Known for its strategic acquisitions and organic growth, Compass's collaboration with Parks Real Estate not only enriches its agent pool but also grants these agents access to Compass's cutting-edge technology and a vast national referral network.
9. What pricing options are available for accessing the report?
Pricing options include single-user, multi-user, and enterprise licenses priced at USD 3800, USD 4500, and USD 5800 respectively.
10. Is the market size provided in terms of value or volume?
The market size is provided in terms of value, measured in Million and volume, measured in Billion.
11. Are there any specific market keywords associated with the report?
Yes, the market keyword associated with the report is "United States Real Estate Brokerage Market," which aids in identifying and referencing the specific market segment covered.
12. How do I determine which pricing option suits my needs best?
The pricing options vary based on user requirements and access needs. Individual users may opt for single-user licenses, while businesses requiring broader access may choose multi-user or enterprise licenses for cost-effective access to the report.
13. Are there any additional resources or data provided in the United States Real Estate Brokerage Market report?
While the report offers comprehensive insights, it's advisable to review the specific contents or supplementary materials provided to ascertain if additional resources or data are available.
14. How can I stay updated on further developments or reports in the United States Real Estate Brokerage Market?
To stay informed about further developments, trends, and reports in the United States Real Estate Brokerage Market, consider subscribing to industry newsletters, following relevant companies and organizations, or regularly checking reputable industry news sources and publications.
Methodology
Step 1 - Identification of Relevant Samples Size from Population Database


Step 2 - Approaches for Defining Global Market Size (Value, Volume* & Price*)

Note*: In applicable scenarios
Step 3 - Data Sources
Primary Research
- Web Analytics
- Survey Reports
- Research Institute
- Latest Research Reports
- Opinion Leaders
Secondary Research
- Annual Reports
- White Paper
- Latest Press Release
- Industry Association
- Paid Database
- Investor Presentations

Step 4 - Data Triangulation
Involves using different sources of information in order to increase the validity of a study
These sources are likely to be stakeholders in a program - participants, other researchers, program staff, other community members, and so on.
Then we put all data in single framework & apply various statistical tools to find out the dynamic on the market.
During the analysis stage, feedback from the stakeholder groups would be compared to determine areas of agreement as well as areas of divergence