
Key Insights
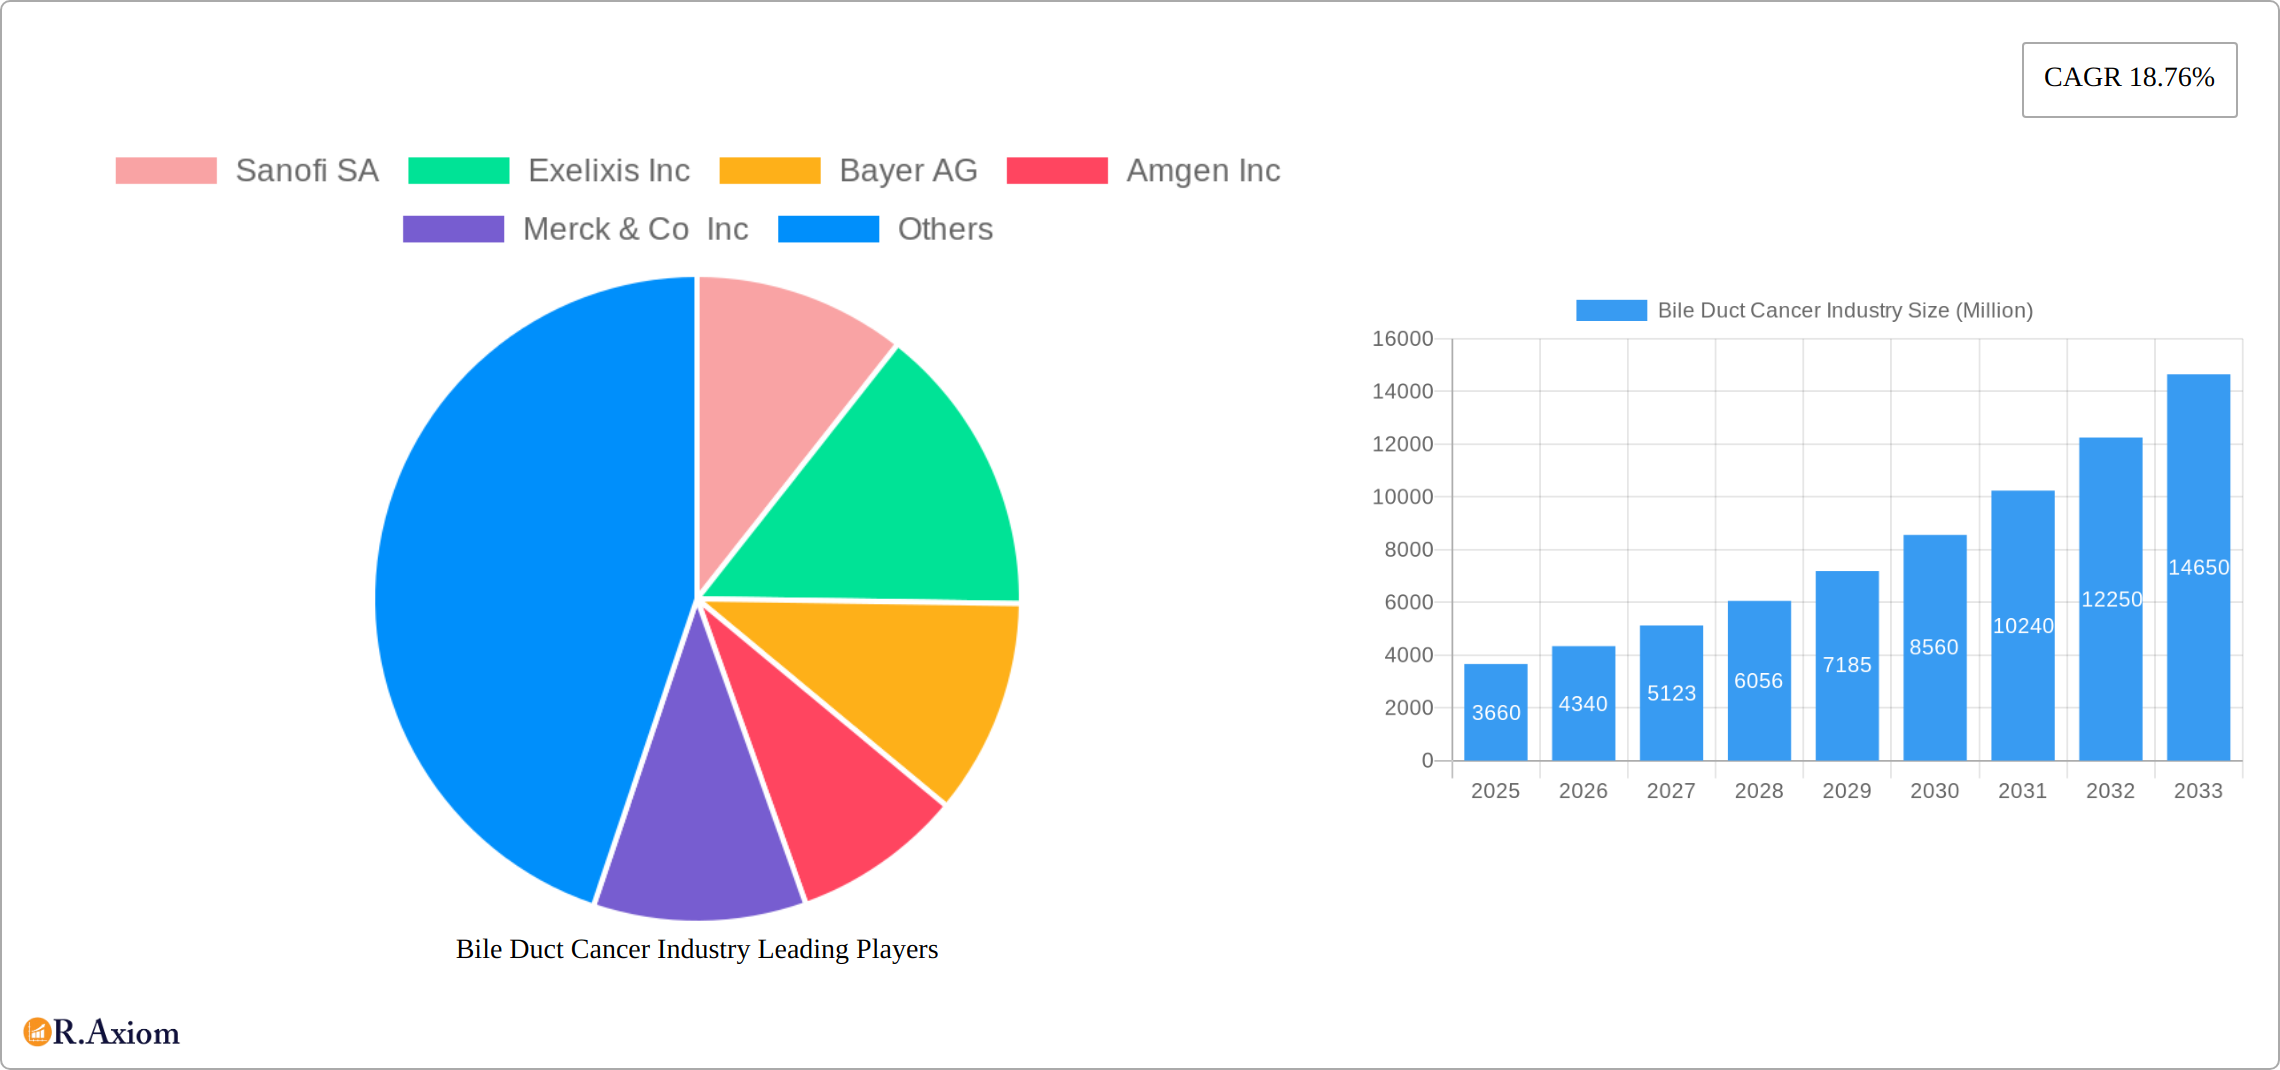
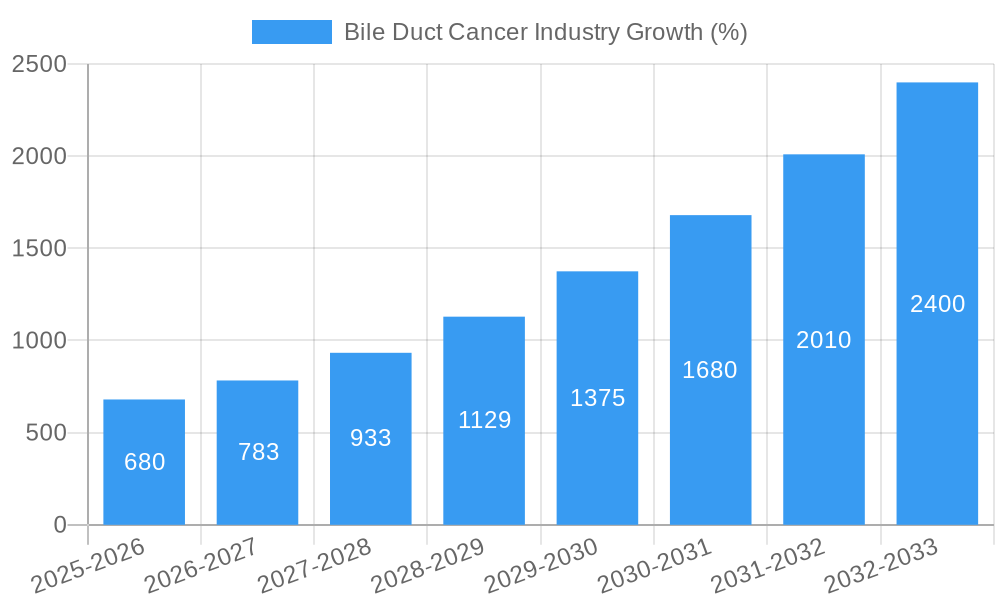
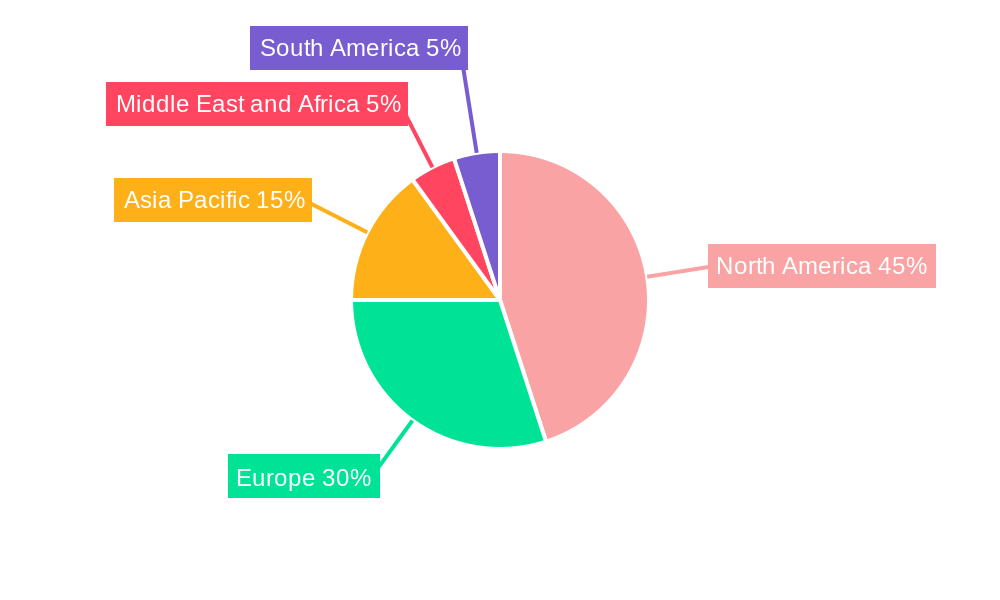
The bile duct cancer market, valued at $3.66 billion in 2025, is projected to experience robust growth, exhibiting a compound annual growth rate (CAGR) of 18.76% from 2025 to 2033. This significant expansion is driven by several factors. Rising prevalence of liver diseases like cirrhosis and hepatitis, leading to increased bile duct cancer incidence, is a primary driver. Advances in diagnostic technologies, enabling earlier and more accurate detection, contribute significantly to market growth. The development and adoption of novel targeted therapies, immunotherapies, and improved chemotherapeutic regimens offer improved treatment outcomes and patient survival rates, further fueling market expansion. The increasing geriatric population, a demographic group with higher susceptibility to bile duct cancer, also fuels market growth. However, challenges persist, including the high cost of advanced therapies, limiting accessibility in many regions. Furthermore, the complexity of bile duct cancer, with varying tumor types and responses to treatment, presents ongoing hurdles in developing universally effective therapies. Geographical variations in healthcare infrastructure and access to specialized care also impact market growth, with North America and Europe currently dominating the market due to advanced healthcare systems and higher research and development investments. However, the Asia-Pacific region is poised for substantial growth due to increasing awareness, rising healthcare spending and a burgeoning population.
Segmentation analysis reveals a diverse market landscape. Hepatocellular carcinoma (HCC) and cholangiocarcinoma represent the largest segments by cancer type, reflecting their high prevalence. In terms of therapy, targeted therapy is witnessing significant growth due to its ability to selectively target cancer cells, minimizing damage to healthy tissues. Immunotherapies, while still evolving, are becoming increasingly crucial, offering promising new approaches for treatment. The competitive landscape features a mix of established pharmaceutical giants like Sanofi, Roche, and Merck, alongside smaller, specialized biotech companies actively engaged in research and development of innovative bile duct cancer therapies. This competitive intensity fuels innovation and contributes to a continuously evolving treatment paradigm. The forecast period of 2025-2033 promises further advancements in diagnostic and therapeutic modalities, shaping the future of bile duct cancer treatment and market dynamics.
Bile Duct Cancer Industry: A Comprehensive Market Report (2019-2033)
This comprehensive report provides a detailed analysis of the Bile Duct Cancer industry, offering invaluable insights for stakeholders, investors, and industry professionals. The report covers the period from 2019 to 2033, with a focus on the base year 2025 and a forecast period spanning 2025-2033. The historical period analyzed is 2019-2024. The report projects a xx Million market value by 2033, exhibiting a CAGR of xx% during the forecast period.
Bile Duct Cancer Industry Market Concentration & Innovation
The Bile Duct Cancer industry exhibits a moderately concentrated market structure, with key players like Sanofi SA, Exelixis Inc, Bayer AG, and Amgen Inc holding significant market share. However, the landscape is dynamic, driven by ongoing innovation in targeted therapies and immunotherapies. The market share of these top players is estimated to be approximately xx% in 2025. Mergers and acquisitions (M&A) activities have played a significant role in shaping the market, with total M&A deal values estimated at xx Million in the past five years. These deals have primarily focused on expanding product portfolios and gaining access to novel technologies. The regulatory framework, although challenging, is fostering innovation through expedited approvals for promising treatments. The presence of alternative therapies and emerging technologies creates competitive pressure, pushing companies to innovate further. End-user trends, particularly increasing demand for personalized medicine and improved patient outcomes, drive the industry forward.
Bile Duct Cancer Industry Industry Trends & Insights
The Bile Duct Cancer industry is witnessing substantial growth fueled by several factors. The rising prevalence of bile duct cancer globally is a primary driver, coupled with increasing awareness and improved diagnostic capabilities. Technological advancements in targeted therapies, immunotherapy, and radiation therapy are revolutionizing treatment approaches, leading to improved survival rates and patient outcomes. Patient preferences are shifting towards less invasive therapies and personalized treatment plans, demanding greater innovation in drug development and delivery systems. The competitive landscape is characterized by intense R&D investments, strategic partnerships, and a focus on developing novel drug candidates. The market is expected to witness significant growth, driven by an increasing number of clinical trials focusing on new therapies and improved patient outcomes, which translates to a projected market size of xx Million by 2033. The high cost of treatment remains a significant challenge but is offset by the growing demand for effective treatments and the development of affordable alternatives.
Dominant Markets & Segments in Bile Duct Cancer Industry
Leading Region/Country: The North American market currently holds the largest market share, primarily due to high healthcare expenditure, advanced healthcare infrastructure, and increased awareness. However, the Asia-Pacific region is expected to experience significant growth in the forecast period due to rising prevalence rates and increasing healthcare investments.
Dominant Segments (By Type):
- Hepatocellular Carcinoma (HCC) currently dominates the market due to its high prevalence and the availability of several treatment options.
- Cholangiocarcinoma is showing significant growth potential due to rising incidence rates and unmet clinical needs.
- Hepatoblastoma represents a smaller segment but is attracting significant attention due to the development of targeted therapies.
Dominant Segments (By Therapy):
- Targeted therapy holds a significant share due to its effectiveness in selectively targeting cancer cells.
- Immunotherapy is rapidly gaining traction due to its potential to enhance the body's natural defense mechanisms.
- Chemotherapy remains a mainstay treatment, though newer approaches are emerging that minimize side effects.
The dominance of specific segments is driven by factors such as prevalence rates, the effectiveness of available therapies, and ongoing research and development efforts. Government initiatives supporting research and development in this area further contribute to the growth of the industry.
Bile Duct Cancer Industry Product Developments
The Bile Duct Cancer industry is experiencing a wave of innovation, driven by advancements in targeted therapies and a growing emphasis on personalized medicine. Recent breakthroughs include the development of novel antibody-drug conjugates (ADCs) and immune checkpoint inhibitors (ICIs), offering improved efficacy and reduced side effects compared to traditional chemotherapy regimens. These advancements are complemented by significant progress in understanding the genetic drivers of bile duct cancer, paving the way for truly personalized treatment approaches tailored to specific patient genetic profiles and tumor characteristics. This precision medicine focus not only enhances treatment effectiveness but also minimizes the adverse effects often associated with broader-spectrum therapies. Furthermore, research into novel drug delivery systems is improving therapeutic targeting and reducing systemic toxicity.
Report Scope & Segmentation Analysis
This report segments the Bile Duct Cancer market by type (Hepatocellular Carcinoma, Cholangiocarcinoma, Hepatoblastoma, Other Types) and by therapy (Targeted Therapy, Radiation Therapy, Immunotherapy, Chemotherapy). Each segment is analyzed in detail, with growth projections, market size estimates, and competitive landscapes provided for the forecast period (2025-2033). The analysis considers various factors influencing the growth of each segment, including prevalence rates, treatment efficacy, and technological advancements. The report also identifies key players and their respective market positions within each segment, providing comprehensive insights into competitive dynamics.
Key Drivers of Bile Duct Cancer Industry Growth
Several converging factors are fueling the growth of the Bile Duct Cancer industry. Firstly, substantial investment in research and development continues to yield innovative therapies with improved efficacy and safety profiles. Secondly, the rising global prevalence of bile duct cancer, coupled with improved diagnostic capabilities leading to earlier detection and diagnosis, is driving increased demand for effective treatments. Thirdly, increased healthcare spending, particularly in developing economies, is expanding access to advanced therapies. Finally, supportive regulatory environments and government funding for cancer research are further accelerating market expansion. The growing understanding of the disease's complex biology and the subsequent refinement of treatment strategies are also significant drivers.
Challenges in the Bile Duct Cancer Industry Sector
Despite significant progress, the Bile Duct Cancer industry faces considerable challenges. The high cost of innovative therapies presents a major barrier to access, particularly in resource-constrained settings. Furthermore, the inherent complexity of bile duct cancer, characterized by diverse subtypes and often late-stage diagnosis, necessitates highly specialized treatment strategies. Limited treatment options for certain subtypes of bile duct cancer, the development of drug resistance, and the need for more sophisticated personalized medicine approaches remain significant hurdles. The lengthy and complex clinical trial processes required for new drug approvals and potential supply chain disruptions also contribute to industry challenges.
Emerging Opportunities in Bile Duct Cancer Industry
Despite the challenges, the Bile Duct Cancer industry presents significant emerging opportunities. The continued development of novel targeted therapies and immunotherapies, coupled with the increasing adoption of advanced diagnostic tools and a growing understanding of personalized medicine, offer substantial growth potential. The expansion into emerging markets, where the prevalence of bile duct cancer is high and access to treatment is limited, represents a significant untapped market. Moreover, increased focus on early detection through improved screening methods and preventive strategies offers opportunities for reducing mortality rates and improving patient outcomes. The development of novel biomarkers for early detection and response prediction will further propel market growth.
Leading Players in the Bile Duct Cancer Industry Market
- Sanofi SA
- Exelixis Inc
- Bayer AG
- Amgen Inc
- Merck & Co Inc
- F Hoffmann-La Roche Ltd
- AstraZeneca PLC
- Eli Lilly and Company
- AbbVie Inc
- Bristol Myers Squibb Company
- Novartis AG
- Johnson & Johnson
- Eisai Co Ltd
- Celsion Corporation
- Pfizer Inc
Key Developments in Bile Duct Cancer Industry Industry
February 2023: AstraZeneca's Imfinzi (durvalumab) and Imjudo (tremelimumab) immunotherapy combinations received EU approval for advanced liver and lung cancers, significantly impacting the treatment landscape for hepatocellular carcinoma.
March 2023: The University of Southern California (USC) and Auransa Inc. initiated a Phase 1 clinical trial for AU409, a novel treatment for liver cancers and liver-dominant solid tumors, highlighting ongoing innovation in the field.
Strategic Outlook for Bile Duct Cancer Industry Market
The Bile Duct Cancer industry holds significant future potential driven by continuous innovation in targeted therapies, immunotherapy, and personalized medicine approaches. Expanding access to effective treatments in developing economies and a growing focus on early detection and prevention will further drive market growth. Strategic partnerships, acquisitions, and continuous research and development efforts by leading pharmaceutical companies are poised to reshape the treatment landscape and improve patient outcomes in the coming years.
Bile Duct Cancer Industry Segmentation
-
1. Type
- 1.1. Hepatocellular Carcinoma
- 1.2. Cholangio Carcinoma
- 1.3. Hepatoblastoma
- 1.4. Other Types
-
2. Therapy
- 2.1. Targeted Therapy
- 2.2. Radiation Therapy
- 2.3. Immunotherapy
- 2.4. Chemotherapy
-
3. End-user
- 3.1. Hospitals
- 3.2. Clinics
- 3.3. Research Institutions
Bile Duct Cancer Industry Segmentation By Geography
-
1. North America
- 1.1. United States
- 1.2. Canada
- 1.3. Mexico
-
2. Europe
- 2.1. Germany
- 2.2. United Kingdom
- 2.3. France
- 2.4. Italy
- 2.5. Spain
- 2.6. Rest of Europe
-
3. Asia Pacific
- 3.1. China
- 3.2. Japan
- 3.3. India
- 3.4. Australia
- 3.5. South Korea
- 3.6. Rest of Asia Pacific
-
4. Middle East and Africa
- 4.1. GCC
- 4.2. South Africa
- 4.3. Rest of Middle East and Africa
-
5. South America
- 5.1. Brazil
- 5.2. Argentina
- 5.3. Rest of South America
Bile Duct Cancer Industry REPORT HIGHLIGHTS
| Aspects | Details |
|---|---|
| Study Period | 2019-2033 |
| Base Year | 2024 |
| Estimated Year | 2025 |
| Forecast Period | 2025-2033 |
| Historical Period | 2019-2024 |
| Growth Rate | CAGR of 18.76% from 2019-2033 |
| Segmentation |
|
Table of Contents
- 1. Introduction
- 1.1. Research Scope
- 1.2. Market Segmentation
- 1.3. Research Methodology
- 1.4. Definitions and Assumptions
- 2. Executive Summary
- 2.1. Introduction
- 3. Market Dynamics
- 3.1. Introduction
- 3.2. Market Drivers
- 3.2.1. Rising Burden of Liver Cancer; Increasing R&D Investments for the Development of Novel Therapies; Government Initiatives to Increase the Cancer Awareness
- 3.3. Market Restrains
- 3.3.1. Side Effects Associated with Certain Medications Coupled with High Cost of Cancer Therapies; Stringent Regulatory Scenario
- 3.4. Market Trends
- 3.4.1. Hepatocellular Carcinoma Segment is Expected to Occupy a Significant Share Over the Forecast Period
- 4. Market Factor Analysis
- 4.1. Porters Five Forces
- 4.2. Supply/Value Chain
- 4.3. PESTEL analysis
- 4.4. Market Entropy
- 4.5. Patent/Trademark Analysis
- 5. Global Bile Duct Cancer Industry Analysis, Insights and Forecast, 2019-2031
- 5.1. Market Analysis, Insights and Forecast - by Type
- 5.1.1. Hepatocellular Carcinoma
- 5.1.2. Cholangio Carcinoma
- 5.1.3. Hepatoblastoma
- 5.1.4. Other Types
- 5.2. Market Analysis, Insights and Forecast - by Therapy
- 5.2.1. Targeted Therapy
- 5.2.2. Radiation Therapy
- 5.2.3. Immunotherapy
- 5.2.4. Chemotherapy
- 5.3. Market Analysis, Insights and Forecast - by End-user
- 5.3.1. Hospitals
- 5.3.2. Clinics
- 5.3.3. Research Institutions
- 5.4. Market Analysis, Insights and Forecast - by Region
- 5.4.1. North America
- 5.4.2. Europe
- 5.4.3. Asia Pacific
- 5.4.4. Middle East and Africa
- 5.4.5. South America
- 5.1. Market Analysis, Insights and Forecast - by Type
- 6. North America Bile Duct Cancer Industry Analysis, Insights and Forecast, 2019-2031
- 6.1. Market Analysis, Insights and Forecast - by Type
- 6.1.1. Hepatocellular Carcinoma
- 6.1.2. Cholangio Carcinoma
- 6.1.3. Hepatoblastoma
- 6.1.4. Other Types
- 6.2. Market Analysis, Insights and Forecast - by Therapy
- 6.2.1. Targeted Therapy
- 6.2.2. Radiation Therapy
- 6.2.3. Immunotherapy
- 6.2.4. Chemotherapy
- 6.3. Market Analysis, Insights and Forecast - by End-user
- 6.3.1. Hospitals
- 6.3.2. Clinics
- 6.3.3. Research Institutions
- 6.1. Market Analysis, Insights and Forecast - by Type
- 7. Europe Bile Duct Cancer Industry Analysis, Insights and Forecast, 2019-2031
- 7.1. Market Analysis, Insights and Forecast - by Type
- 7.1.1. Hepatocellular Carcinoma
- 7.1.2. Cholangio Carcinoma
- 7.1.3. Hepatoblastoma
- 7.1.4. Other Types
- 7.2. Market Analysis, Insights and Forecast - by Therapy
- 7.2.1. Targeted Therapy
- 7.2.2. Radiation Therapy
- 7.2.3. Immunotherapy
- 7.2.4. Chemotherapy
- 7.3. Market Analysis, Insights and Forecast - by End-user
- 7.3.1. Hospitals
- 7.3.2. Clinics
- 7.3.3. Research Institutions
- 7.1. Market Analysis, Insights and Forecast - by Type
- 8. Asia Pacific Bile Duct Cancer Industry Analysis, Insights and Forecast, 2019-2031
- 8.1. Market Analysis, Insights and Forecast - by Type
- 8.1.1. Hepatocellular Carcinoma
- 8.1.2. Cholangio Carcinoma
- 8.1.3. Hepatoblastoma
- 8.1.4. Other Types
- 8.2. Market Analysis, Insights and Forecast - by Therapy
- 8.2.1. Targeted Therapy
- 8.2.2. Radiation Therapy
- 8.2.3. Immunotherapy
- 8.2.4. Chemotherapy
- 8.3. Market Analysis, Insights and Forecast - by End-user
- 8.3.1. Hospitals
- 8.3.2. Clinics
- 8.3.3. Research Institutions
- 8.1. Market Analysis, Insights and Forecast - by Type
- 9. Middle East and Africa Bile Duct Cancer Industry Analysis, Insights and Forecast, 2019-2031
- 9.1. Market Analysis, Insights and Forecast - by Type
- 9.1.1. Hepatocellular Carcinoma
- 9.1.2. Cholangio Carcinoma
- 9.1.3. Hepatoblastoma
- 9.1.4. Other Types
- 9.2. Market Analysis, Insights and Forecast - by Therapy
- 9.2.1. Targeted Therapy
- 9.2.2. Radiation Therapy
- 9.2.3. Immunotherapy
- 9.2.4. Chemotherapy
- 9.3. Market Analysis, Insights and Forecast - by End-user
- 9.3.1. Hospitals
- 9.3.2. Clinics
- 9.3.3. Research Institutions
- 9.1. Market Analysis, Insights and Forecast - by Type
- 10. South America Bile Duct Cancer Industry Analysis, Insights and Forecast, 2019-2031
- 10.1. Market Analysis, Insights and Forecast - by Type
- 10.1.1. Hepatocellular Carcinoma
- 10.1.2. Cholangio Carcinoma
- 10.1.3. Hepatoblastoma
- 10.1.4. Other Types
- 10.2. Market Analysis, Insights and Forecast - by Therapy
- 10.2.1. Targeted Therapy
- 10.2.2. Radiation Therapy
- 10.2.3. Immunotherapy
- 10.2.4. Chemotherapy
- 10.3. Market Analysis, Insights and Forecast - by End-user
- 10.3.1. Hospitals
- 10.3.2. Clinics
- 10.3.3. Research Institutions
- 10.1. Market Analysis, Insights and Forecast - by Type
- 11. North America Bile Duct Cancer Industry Analysis, Insights and Forecast, 2019-2031
- 11.1. Market Analysis, Insights and Forecast - By Country/Sub-region
- 11.1.1 United States
- 11.1.2 Canada
- 11.1.3 Mexico
- 12. Europe Bile Duct Cancer Industry Analysis, Insights and Forecast, 2019-2031
- 12.1. Market Analysis, Insights and Forecast - By Country/Sub-region
- 12.1.1 Germany
- 12.1.2 United Kingdom
- 12.1.3 France
- 12.1.4 Italy
- 12.1.5 Spain
- 12.1.6 Rest of Europe
- 13. Asia Pacific Bile Duct Cancer Industry Analysis, Insights and Forecast, 2019-2031
- 13.1. Market Analysis, Insights and Forecast - By Country/Sub-region
- 13.1.1 China
- 13.1.2 Japan
- 13.1.3 India
- 13.1.4 Australia
- 13.1.5 South Korea
- 13.1.6 Rest of Asia Pacific
- 14. Middle East and Africa Bile Duct Cancer Industry Analysis, Insights and Forecast, 2019-2031
- 14.1. Market Analysis, Insights and Forecast - By Country/Sub-region
- 14.1.1 GCC
- 14.1.2 South Africa
- 14.1.3 Rest of Middle East and Africa
- 15. South America Bile Duct Cancer Industry Analysis, Insights and Forecast, 2019-2031
- 15.1. Market Analysis, Insights and Forecast - By Country/Sub-region
- 15.1.1 Brazil
- 15.1.2 Argentina
- 15.1.3 Rest of South America
- 16. Competitive Analysis
- 16.1. Global Market Share Analysis 2024
- 16.2. Company Profiles
- 16.2.1 Sanofi SA
- 16.2.1.1. Overview
- 16.2.1.2. Products
- 16.2.1.3. SWOT Analysis
- 16.2.1.4. Recent Developments
- 16.2.1.5. Financials (Based on Availability)
- 16.2.2 Exelixis Inc
- 16.2.2.1. Overview
- 16.2.2.2. Products
- 16.2.2.3. SWOT Analysis
- 16.2.2.4. Recent Developments
- 16.2.2.5. Financials (Based on Availability)
- 16.2.3 Bayer AG
- 16.2.3.1. Overview
- 16.2.3.2. Products
- 16.2.3.3. SWOT Analysis
- 16.2.3.4. Recent Developments
- 16.2.3.5. Financials (Based on Availability)
- 16.2.4 Amgen Inc
- 16.2.4.1. Overview
- 16.2.4.2. Products
- 16.2.4.3. SWOT Analysis
- 16.2.4.4. Recent Developments
- 16.2.4.5. Financials (Based on Availability)
- 16.2.5 Merck & Co Inc
- 16.2.5.1. Overview
- 16.2.5.2. Products
- 16.2.5.3. SWOT Analysis
- 16.2.5.4. Recent Developments
- 16.2.5.5. Financials (Based on Availability)
- 16.2.6 F Hoffmann-La Roche Ltd
- 16.2.6.1. Overview
- 16.2.6.2. Products
- 16.2.6.3. SWOT Analysis
- 16.2.6.4. Recent Developments
- 16.2.6.5. Financials (Based on Availability)
- 16.2.7 AstraZeneca PLC
- 16.2.7.1. Overview
- 16.2.7.2. Products
- 16.2.7.3. SWOT Analysis
- 16.2.7.4. Recent Developments
- 16.2.7.5. Financials (Based on Availability)
- 16.2.8 Eli Lilly and Company
- 16.2.8.1. Overview
- 16.2.8.2. Products
- 16.2.8.3. SWOT Analysis
- 16.2.8.4. Recent Developments
- 16.2.8.5. Financials (Based on Availability)
- 16.2.9 AbbVie Inc
- 16.2.9.1. Overview
- 16.2.9.2. Products
- 16.2.9.3. SWOT Analysis
- 16.2.9.4. Recent Developments
- 16.2.9.5. Financials (Based on Availability)
- 16.2.10 Bristol Myers Squibb Company
- 16.2.10.1. Overview
- 16.2.10.2. Products
- 16.2.10.3. SWOT Analysis
- 16.2.10.4. Recent Developments
- 16.2.10.5. Financials (Based on Availability)
- 16.2.11 Novartis AG
- 16.2.11.1. Overview
- 16.2.11.2. Products
- 16.2.11.3. SWOT Analysis
- 16.2.11.4. Recent Developments
- 16.2.11.5. Financials (Based on Availability)
- 16.2.12 Johnson & Johnson
- 16.2.12.1. Overview
- 16.2.12.2. Products
- 16.2.12.3. SWOT Analysis
- 16.2.12.4. Recent Developments
- 16.2.12.5. Financials (Based on Availability)
- 16.2.13 Eisai Co Ltd
- 16.2.13.1. Overview
- 16.2.13.2. Products
- 16.2.13.3. SWOT Analysis
- 16.2.13.4. Recent Developments
- 16.2.13.5. Financials (Based on Availability)
- 16.2.14 Celsion Corporation
- 16.2.14.1. Overview
- 16.2.14.2. Products
- 16.2.14.3. SWOT Analysis
- 16.2.14.4. Recent Developments
- 16.2.14.5. Financials (Based on Availability)
- 16.2.15 Pfizer Inc
- 16.2.15.1. Overview
- 16.2.15.2. Products
- 16.2.15.3. SWOT Analysis
- 16.2.15.4. Recent Developments
- 16.2.15.5. Financials (Based on Availability)
- 16.2.1 Sanofi SA
List of Figures
- Figure 1: Global Bile Duct Cancer Industry Revenue Breakdown (Million, %) by Region 2024 & 2032
- Figure 2: Global Bile Duct Cancer Industry Volume Breakdown (K Unit, %) by Region 2024 & 2032
- Figure 3: North America Bile Duct Cancer Industry Revenue (Million), by Country 2024 & 2032
- Figure 4: North America Bile Duct Cancer Industry Volume (K Unit), by Country 2024 & 2032
- Figure 5: North America Bile Duct Cancer Industry Revenue Share (%), by Country 2024 & 2032
- Figure 6: North America Bile Duct Cancer Industry Volume Share (%), by Country 2024 & 2032
- Figure 7: Europe Bile Duct Cancer Industry Revenue (Million), by Country 2024 & 2032
- Figure 8: Europe Bile Duct Cancer Industry Volume (K Unit), by Country 2024 & 2032
- Figure 9: Europe Bile Duct Cancer Industry Revenue Share (%), by Country 2024 & 2032
- Figure 10: Europe Bile Duct Cancer Industry Volume Share (%), by Country 2024 & 2032
- Figure 11: Asia Pacific Bile Duct Cancer Industry Revenue (Million), by Country 2024 & 2032
- Figure 12: Asia Pacific Bile Duct Cancer Industry Volume (K Unit), by Country 2024 & 2032
- Figure 13: Asia Pacific Bile Duct Cancer Industry Revenue Share (%), by Country 2024 & 2032
- Figure 14: Asia Pacific Bile Duct Cancer Industry Volume Share (%), by Country 2024 & 2032
- Figure 15: Middle East and Africa Bile Duct Cancer Industry Revenue (Million), by Country 2024 & 2032
- Figure 16: Middle East and Africa Bile Duct Cancer Industry Volume (K Unit), by Country 2024 & 2032
- Figure 17: Middle East and Africa Bile Duct Cancer Industry Revenue Share (%), by Country 2024 & 2032
- Figure 18: Middle East and Africa Bile Duct Cancer Industry Volume Share (%), by Country 2024 & 2032
- Figure 19: South America Bile Duct Cancer Industry Revenue (Million), by Country 2024 & 2032
- Figure 20: South America Bile Duct Cancer Industry Volume (K Unit), by Country 2024 & 2032
- Figure 21: South America Bile Duct Cancer Industry Revenue Share (%), by Country 2024 & 2032
- Figure 22: South America Bile Duct Cancer Industry Volume Share (%), by Country 2024 & 2032
- Figure 23: North America Bile Duct Cancer Industry Revenue (Million), by Type 2024 & 2032
- Figure 24: North America Bile Duct Cancer Industry Volume (K Unit), by Type 2024 & 2032
- Figure 25: North America Bile Duct Cancer Industry Revenue Share (%), by Type 2024 & 2032
- Figure 26: North America Bile Duct Cancer Industry Volume Share (%), by Type 2024 & 2032
- Figure 27: North America Bile Duct Cancer Industry Revenue (Million), by Therapy 2024 & 2032
- Figure 28: North America Bile Duct Cancer Industry Volume (K Unit), by Therapy 2024 & 2032
- Figure 29: North America Bile Duct Cancer Industry Revenue Share (%), by Therapy 2024 & 2032
- Figure 30: North America Bile Duct Cancer Industry Volume Share (%), by Therapy 2024 & 2032
- Figure 31: North America Bile Duct Cancer Industry Revenue (Million), by End-user 2024 & 2032
- Figure 32: North America Bile Duct Cancer Industry Volume (K Unit), by End-user 2024 & 2032
- Figure 33: North America Bile Duct Cancer Industry Revenue Share (%), by End-user 2024 & 2032
- Figure 34: North America Bile Duct Cancer Industry Volume Share (%), by End-user 2024 & 2032
- Figure 35: North America Bile Duct Cancer Industry Revenue (Million), by Country 2024 & 2032
- Figure 36: North America Bile Duct Cancer Industry Volume (K Unit), by Country 2024 & 2032
- Figure 37: North America Bile Duct Cancer Industry Revenue Share (%), by Country 2024 & 2032
- Figure 38: North America Bile Duct Cancer Industry Volume Share (%), by Country 2024 & 2032
- Figure 39: Europe Bile Duct Cancer Industry Revenue (Million), by Type 2024 & 2032
- Figure 40: Europe Bile Duct Cancer Industry Volume (K Unit), by Type 2024 & 2032
- Figure 41: Europe Bile Duct Cancer Industry Revenue Share (%), by Type 2024 & 2032
- Figure 42: Europe Bile Duct Cancer Industry Volume Share (%), by Type 2024 & 2032
- Figure 43: Europe Bile Duct Cancer Industry Revenue (Million), by Therapy 2024 & 2032
- Figure 44: Europe Bile Duct Cancer Industry Volume (K Unit), by Therapy 2024 & 2032
- Figure 45: Europe Bile Duct Cancer Industry Revenue Share (%), by Therapy 2024 & 2032
- Figure 46: Europe Bile Duct Cancer Industry Volume Share (%), by Therapy 2024 & 2032
- Figure 47: Europe Bile Duct Cancer Industry Revenue (Million), by End-user 2024 & 2032
- Figure 48: Europe Bile Duct Cancer Industry Volume (K Unit), by End-user 2024 & 2032
- Figure 49: Europe Bile Duct Cancer Industry Revenue Share (%), by End-user 2024 & 2032
- Figure 50: Europe Bile Duct Cancer Industry Volume Share (%), by End-user 2024 & 2032
- Figure 51: Europe Bile Duct Cancer Industry Revenue (Million), by Country 2024 & 2032
- Figure 52: Europe Bile Duct Cancer Industry Volume (K Unit), by Country 2024 & 2032
- Figure 53: Europe Bile Duct Cancer Industry Revenue Share (%), by Country 2024 & 2032
- Figure 54: Europe Bile Duct Cancer Industry Volume Share (%), by Country 2024 & 2032
- Figure 55: Asia Pacific Bile Duct Cancer Industry Revenue (Million), by Type 2024 & 2032
- Figure 56: Asia Pacific Bile Duct Cancer Industry Volume (K Unit), by Type 2024 & 2032
- Figure 57: Asia Pacific Bile Duct Cancer Industry Revenue Share (%), by Type 2024 & 2032
- Figure 58: Asia Pacific Bile Duct Cancer Industry Volume Share (%), by Type 2024 & 2032
- Figure 59: Asia Pacific Bile Duct Cancer Industry Revenue (Million), by Therapy 2024 & 2032
- Figure 60: Asia Pacific Bile Duct Cancer Industry Volume (K Unit), by Therapy 2024 & 2032
- Figure 61: Asia Pacific Bile Duct Cancer Industry Revenue Share (%), by Therapy 2024 & 2032
- Figure 62: Asia Pacific Bile Duct Cancer Industry Volume Share (%), by Therapy 2024 & 2032
- Figure 63: Asia Pacific Bile Duct Cancer Industry Revenue (Million), by End-user 2024 & 2032
- Figure 64: Asia Pacific Bile Duct Cancer Industry Volume (K Unit), by End-user 2024 & 2032
- Figure 65: Asia Pacific Bile Duct Cancer Industry Revenue Share (%), by End-user 2024 & 2032
- Figure 66: Asia Pacific Bile Duct Cancer Industry Volume Share (%), by End-user 2024 & 2032
- Figure 67: Asia Pacific Bile Duct Cancer Industry Revenue (Million), by Country 2024 & 2032
- Figure 68: Asia Pacific Bile Duct Cancer Industry Volume (K Unit), by Country 2024 & 2032
- Figure 69: Asia Pacific Bile Duct Cancer Industry Revenue Share (%), by Country 2024 & 2032
- Figure 70: Asia Pacific Bile Duct Cancer Industry Volume Share (%), by Country 2024 & 2032
- Figure 71: Middle East and Africa Bile Duct Cancer Industry Revenue (Million), by Type 2024 & 2032
- Figure 72: Middle East and Africa Bile Duct Cancer Industry Volume (K Unit), by Type 2024 & 2032
- Figure 73: Middle East and Africa Bile Duct Cancer Industry Revenue Share (%), by Type 2024 & 2032
- Figure 74: Middle East and Africa Bile Duct Cancer Industry Volume Share (%), by Type 2024 & 2032
- Figure 75: Middle East and Africa Bile Duct Cancer Industry Revenue (Million), by Therapy 2024 & 2032
- Figure 76: Middle East and Africa Bile Duct Cancer Industry Volume (K Unit), by Therapy 2024 & 2032
- Figure 77: Middle East and Africa Bile Duct Cancer Industry Revenue Share (%), by Therapy 2024 & 2032
- Figure 78: Middle East and Africa Bile Duct Cancer Industry Volume Share (%), by Therapy 2024 & 2032
- Figure 79: Middle East and Africa Bile Duct Cancer Industry Revenue (Million), by End-user 2024 & 2032
- Figure 80: Middle East and Africa Bile Duct Cancer Industry Volume (K Unit), by End-user 2024 & 2032
- Figure 81: Middle East and Africa Bile Duct Cancer Industry Revenue Share (%), by End-user 2024 & 2032
- Figure 82: Middle East and Africa Bile Duct Cancer Industry Volume Share (%), by End-user 2024 & 2032
- Figure 83: Middle East and Africa Bile Duct Cancer Industry Revenue (Million), by Country 2024 & 2032
- Figure 84: Middle East and Africa Bile Duct Cancer Industry Volume (K Unit), by Country 2024 & 2032
- Figure 85: Middle East and Africa Bile Duct Cancer Industry Revenue Share (%), by Country 2024 & 2032
- Figure 86: Middle East and Africa Bile Duct Cancer Industry Volume Share (%), by Country 2024 & 2032
- Figure 87: South America Bile Duct Cancer Industry Revenue (Million), by Type 2024 & 2032
- Figure 88: South America Bile Duct Cancer Industry Volume (K Unit), by Type 2024 & 2032
- Figure 89: South America Bile Duct Cancer Industry Revenue Share (%), by Type 2024 & 2032
- Figure 90: South America Bile Duct Cancer Industry Volume Share (%), by Type 2024 & 2032
- Figure 91: South America Bile Duct Cancer Industry Revenue (Million), by Therapy 2024 & 2032
- Figure 92: South America Bile Duct Cancer Industry Volume (K Unit), by Therapy 2024 & 2032
- Figure 93: South America Bile Duct Cancer Industry Revenue Share (%), by Therapy 2024 & 2032
- Figure 94: South America Bile Duct Cancer Industry Volume Share (%), by Therapy 2024 & 2032
- Figure 95: South America Bile Duct Cancer Industry Revenue (Million), by End-user 2024 & 2032
- Figure 96: South America Bile Duct Cancer Industry Volume (K Unit), by End-user 2024 & 2032
- Figure 97: South America Bile Duct Cancer Industry Revenue Share (%), by End-user 2024 & 2032
- Figure 98: South America Bile Duct Cancer Industry Volume Share (%), by End-user 2024 & 2032
- Figure 99: South America Bile Duct Cancer Industry Revenue (Million), by Country 2024 & 2032
- Figure 100: South America Bile Duct Cancer Industry Volume (K Unit), by Country 2024 & 2032
- Figure 101: South America Bile Duct Cancer Industry Revenue Share (%), by Country 2024 & 2032
- Figure 102: South America Bile Duct Cancer Industry Volume Share (%), by Country 2024 & 2032
List of Tables
- Table 1: Global Bile Duct Cancer Industry Revenue Million Forecast, by Region 2019 & 2032
- Table 2: Global Bile Duct Cancer Industry Volume K Unit Forecast, by Region 2019 & 2032
- Table 3: Global Bile Duct Cancer Industry Revenue Million Forecast, by Type 2019 & 2032
- Table 4: Global Bile Duct Cancer Industry Volume K Unit Forecast, by Type 2019 & 2032
- Table 5: Global Bile Duct Cancer Industry Revenue Million Forecast, by Therapy 2019 & 2032
- Table 6: Global Bile Duct Cancer Industry Volume K Unit Forecast, by Therapy 2019 & 2032
- Table 7: Global Bile Duct Cancer Industry Revenue Million Forecast, by End-user 2019 & 2032
- Table 8: Global Bile Duct Cancer Industry Volume K Unit Forecast, by End-user 2019 & 2032
- Table 9: Global Bile Duct Cancer Industry Revenue Million Forecast, by Region 2019 & 2032
- Table 10: Global Bile Duct Cancer Industry Volume K Unit Forecast, by Region 2019 & 2032
- Table 11: Global Bile Duct Cancer Industry Revenue Million Forecast, by Country 2019 & 2032
- Table 12: Global Bile Duct Cancer Industry Volume K Unit Forecast, by Country 2019 & 2032
- Table 13: United States Bile Duct Cancer Industry Revenue (Million) Forecast, by Application 2019 & 2032
- Table 14: United States Bile Duct Cancer Industry Volume (K Unit) Forecast, by Application 2019 & 2032
- Table 15: Canada Bile Duct Cancer Industry Revenue (Million) Forecast, by Application 2019 & 2032
- Table 16: Canada Bile Duct Cancer Industry Volume (K Unit) Forecast, by Application 2019 & 2032
- Table 17: Mexico Bile Duct Cancer Industry Revenue (Million) Forecast, by Application 2019 & 2032
- Table 18: Mexico Bile Duct Cancer Industry Volume (K Unit) Forecast, by Application 2019 & 2032
- Table 19: Global Bile Duct Cancer Industry Revenue Million Forecast, by Country 2019 & 2032
- Table 20: Global Bile Duct Cancer Industry Volume K Unit Forecast, by Country 2019 & 2032
- Table 21: Germany Bile Duct Cancer Industry Revenue (Million) Forecast, by Application 2019 & 2032
- Table 22: Germany Bile Duct Cancer Industry Volume (K Unit) Forecast, by Application 2019 & 2032
- Table 23: United Kingdom Bile Duct Cancer Industry Revenue (Million) Forecast, by Application 2019 & 2032
- Table 24: United Kingdom Bile Duct Cancer Industry Volume (K Unit) Forecast, by Application 2019 & 2032
- Table 25: France Bile Duct Cancer Industry Revenue (Million) Forecast, by Application 2019 & 2032
- Table 26: France Bile Duct Cancer Industry Volume (K Unit) Forecast, by Application 2019 & 2032
- Table 27: Italy Bile Duct Cancer Industry Revenue (Million) Forecast, by Application 2019 & 2032
- Table 28: Italy Bile Duct Cancer Industry Volume (K Unit) Forecast, by Application 2019 & 2032
- Table 29: Spain Bile Duct Cancer Industry Revenue (Million) Forecast, by Application 2019 & 2032
- Table 30: Spain Bile Duct Cancer Industry Volume (K Unit) Forecast, by Application 2019 & 2032
- Table 31: Rest of Europe Bile Duct Cancer Industry Revenue (Million) Forecast, by Application 2019 & 2032
- Table 32: Rest of Europe Bile Duct Cancer Industry Volume (K Unit) Forecast, by Application 2019 & 2032
- Table 33: Global Bile Duct Cancer Industry Revenue Million Forecast, by Country 2019 & 2032
- Table 34: Global Bile Duct Cancer Industry Volume K Unit Forecast, by Country 2019 & 2032
- Table 35: China Bile Duct Cancer Industry Revenue (Million) Forecast, by Application 2019 & 2032
- Table 36: China Bile Duct Cancer Industry Volume (K Unit) Forecast, by Application 2019 & 2032
- Table 37: Japan Bile Duct Cancer Industry Revenue (Million) Forecast, by Application 2019 & 2032
- Table 38: Japan Bile Duct Cancer Industry Volume (K Unit) Forecast, by Application 2019 & 2032
- Table 39: India Bile Duct Cancer Industry Revenue (Million) Forecast, by Application 2019 & 2032
- Table 40: India Bile Duct Cancer Industry Volume (K Unit) Forecast, by Application 2019 & 2032
- Table 41: Australia Bile Duct Cancer Industry Revenue (Million) Forecast, by Application 2019 & 2032
- Table 42: Australia Bile Duct Cancer Industry Volume (K Unit) Forecast, by Application 2019 & 2032
- Table 43: South Korea Bile Duct Cancer Industry Revenue (Million) Forecast, by Application 2019 & 2032
- Table 44: South Korea Bile Duct Cancer Industry Volume (K Unit) Forecast, by Application 2019 & 2032
- Table 45: Rest of Asia Pacific Bile Duct Cancer Industry Revenue (Million) Forecast, by Application 2019 & 2032
- Table 46: Rest of Asia Pacific Bile Duct Cancer Industry Volume (K Unit) Forecast, by Application 2019 & 2032
- Table 47: Global Bile Duct Cancer Industry Revenue Million Forecast, by Country 2019 & 2032
- Table 48: Global Bile Duct Cancer Industry Volume K Unit Forecast, by Country 2019 & 2032
- Table 49: GCC Bile Duct Cancer Industry Revenue (Million) Forecast, by Application 2019 & 2032
- Table 50: GCC Bile Duct Cancer Industry Volume (K Unit) Forecast, by Application 2019 & 2032
- Table 51: South Africa Bile Duct Cancer Industry Revenue (Million) Forecast, by Application 2019 & 2032
- Table 52: South Africa Bile Duct Cancer Industry Volume (K Unit) Forecast, by Application 2019 & 2032
- Table 53: Rest of Middle East and Africa Bile Duct Cancer Industry Revenue (Million) Forecast, by Application 2019 & 2032
- Table 54: Rest of Middle East and Africa Bile Duct Cancer Industry Volume (K Unit) Forecast, by Application 2019 & 2032
- Table 55: Global Bile Duct Cancer Industry Revenue Million Forecast, by Country 2019 & 2032
- Table 56: Global Bile Duct Cancer Industry Volume K Unit Forecast, by Country 2019 & 2032
- Table 57: Brazil Bile Duct Cancer Industry Revenue (Million) Forecast, by Application 2019 & 2032
- Table 58: Brazil Bile Duct Cancer Industry Volume (K Unit) Forecast, by Application 2019 & 2032
- Table 59: Argentina Bile Duct Cancer Industry Revenue (Million) Forecast, by Application 2019 & 2032
- Table 60: Argentina Bile Duct Cancer Industry Volume (K Unit) Forecast, by Application 2019 & 2032
- Table 61: Rest of South America Bile Duct Cancer Industry Revenue (Million) Forecast, by Application 2019 & 2032
- Table 62: Rest of South America Bile Duct Cancer Industry Volume (K Unit) Forecast, by Application 2019 & 2032
- Table 63: Global Bile Duct Cancer Industry Revenue Million Forecast, by Type 2019 & 2032
- Table 64: Global Bile Duct Cancer Industry Volume K Unit Forecast, by Type 2019 & 2032
- Table 65: Global Bile Duct Cancer Industry Revenue Million Forecast, by Therapy 2019 & 2032
- Table 66: Global Bile Duct Cancer Industry Volume K Unit Forecast, by Therapy 2019 & 2032
- Table 67: Global Bile Duct Cancer Industry Revenue Million Forecast, by End-user 2019 & 2032
- Table 68: Global Bile Duct Cancer Industry Volume K Unit Forecast, by End-user 2019 & 2032
- Table 69: Global Bile Duct Cancer Industry Revenue Million Forecast, by Country 2019 & 2032
- Table 70: Global Bile Duct Cancer Industry Volume K Unit Forecast, by Country 2019 & 2032
- Table 71: United States Bile Duct Cancer Industry Revenue (Million) Forecast, by Application 2019 & 2032
- Table 72: United States Bile Duct Cancer Industry Volume (K Unit) Forecast, by Application 2019 & 2032
- Table 73: Canada Bile Duct Cancer Industry Revenue (Million) Forecast, by Application 2019 & 2032
- Table 74: Canada Bile Duct Cancer Industry Volume (K Unit) Forecast, by Application 2019 & 2032
- Table 75: Mexico Bile Duct Cancer Industry Revenue (Million) Forecast, by Application 2019 & 2032
- Table 76: Mexico Bile Duct Cancer Industry Volume (K Unit) Forecast, by Application 2019 & 2032
- Table 77: Global Bile Duct Cancer Industry Revenue Million Forecast, by Type 2019 & 2032
- Table 78: Global Bile Duct Cancer Industry Volume K Unit Forecast, by Type 2019 & 2032
- Table 79: Global Bile Duct Cancer Industry Revenue Million Forecast, by Therapy 2019 & 2032
- Table 80: Global Bile Duct Cancer Industry Volume K Unit Forecast, by Therapy 2019 & 2032
- Table 81: Global Bile Duct Cancer Industry Revenue Million Forecast, by End-user 2019 & 2032
- Table 82: Global Bile Duct Cancer Industry Volume K Unit Forecast, by End-user 2019 & 2032
- Table 83: Global Bile Duct Cancer Industry Revenue Million Forecast, by Country 2019 & 2032
- Table 84: Global Bile Duct Cancer Industry Volume K Unit Forecast, by Country 2019 & 2032
- Table 85: Germany Bile Duct Cancer Industry Revenue (Million) Forecast, by Application 2019 & 2032
- Table 86: Germany Bile Duct Cancer Industry Volume (K Unit) Forecast, by Application 2019 & 2032
- Table 87: United Kingdom Bile Duct Cancer Industry Revenue (Million) Forecast, by Application 2019 & 2032
- Table 88: United Kingdom Bile Duct Cancer Industry Volume (K Unit) Forecast, by Application 2019 & 2032
- Table 89: France Bile Duct Cancer Industry Revenue (Million) Forecast, by Application 2019 & 2032
- Table 90: France Bile Duct Cancer Industry Volume (K Unit) Forecast, by Application 2019 & 2032
- Table 91: Italy Bile Duct Cancer Industry Revenue (Million) Forecast, by Application 2019 & 2032
- Table 92: Italy Bile Duct Cancer Industry Volume (K Unit) Forecast, by Application 2019 & 2032
- Table 93: Spain Bile Duct Cancer Industry Revenue (Million) Forecast, by Application 2019 & 2032
- Table 94: Spain Bile Duct Cancer Industry Volume (K Unit) Forecast, by Application 2019 & 2032
- Table 95: Rest of Europe Bile Duct Cancer Industry Revenue (Million) Forecast, by Application 2019 & 2032
- Table 96: Rest of Europe Bile Duct Cancer Industry Volume (K Unit) Forecast, by Application 2019 & 2032
- Table 97: Global Bile Duct Cancer Industry Revenue Million Forecast, by Type 2019 & 2032
- Table 98: Global Bile Duct Cancer Industry Volume K Unit Forecast, by Type 2019 & 2032
- Table 99: Global Bile Duct Cancer Industry Revenue Million Forecast, by Therapy 2019 & 2032
- Table 100: Global Bile Duct Cancer Industry Volume K Unit Forecast, by Therapy 2019 & 2032
- Table 101: Global Bile Duct Cancer Industry Revenue Million Forecast, by End-user 2019 & 2032
- Table 102: Global Bile Duct Cancer Industry Volume K Unit Forecast, by End-user 2019 & 2032
- Table 103: Global Bile Duct Cancer Industry Revenue Million Forecast, by Country 2019 & 2032
- Table 104: Global Bile Duct Cancer Industry Volume K Unit Forecast, by Country 2019 & 2032
- Table 105: China Bile Duct Cancer Industry Revenue (Million) Forecast, by Application 2019 & 2032
- Table 106: China Bile Duct Cancer Industry Volume (K Unit) Forecast, by Application 2019 & 2032
- Table 107: Japan Bile Duct Cancer Industry Revenue (Million) Forecast, by Application 2019 & 2032
- Table 108: Japan Bile Duct Cancer Industry Volume (K Unit) Forecast, by Application 2019 & 2032
- Table 109: India Bile Duct Cancer Industry Revenue (Million) Forecast, by Application 2019 & 2032
- Table 110: India Bile Duct Cancer Industry Volume (K Unit) Forecast, by Application 2019 & 2032
- Table 111: Australia Bile Duct Cancer Industry Revenue (Million) Forecast, by Application 2019 & 2032
- Table 112: Australia Bile Duct Cancer Industry Volume (K Unit) Forecast, by Application 2019 & 2032
- Table 113: South Korea Bile Duct Cancer Industry Revenue (Million) Forecast, by Application 2019 & 2032
- Table 114: South Korea Bile Duct Cancer Industry Volume (K Unit) Forecast, by Application 2019 & 2032
- Table 115: Rest of Asia Pacific Bile Duct Cancer Industry Revenue (Million) Forecast, by Application 2019 & 2032
- Table 116: Rest of Asia Pacific Bile Duct Cancer Industry Volume (K Unit) Forecast, by Application 2019 & 2032
- Table 117: Global Bile Duct Cancer Industry Revenue Million Forecast, by Type 2019 & 2032
- Table 118: Global Bile Duct Cancer Industry Volume K Unit Forecast, by Type 2019 & 2032
- Table 119: Global Bile Duct Cancer Industry Revenue Million Forecast, by Therapy 2019 & 2032
- Table 120: Global Bile Duct Cancer Industry Volume K Unit Forecast, by Therapy 2019 & 2032
- Table 121: Global Bile Duct Cancer Industry Revenue Million Forecast, by End-user 2019 & 2032
- Table 122: Global Bile Duct Cancer Industry Volume K Unit Forecast, by End-user 2019 & 2032
- Table 123: Global Bile Duct Cancer Industry Revenue Million Forecast, by Country 2019 & 2032
- Table 124: Global Bile Duct Cancer Industry Volume K Unit Forecast, by Country 2019 & 2032
- Table 125: GCC Bile Duct Cancer Industry Revenue (Million) Forecast, by Application 2019 & 2032
- Table 126: GCC Bile Duct Cancer Industry Volume (K Unit) Forecast, by Application 2019 & 2032
- Table 127: South Africa Bile Duct Cancer Industry Revenue (Million) Forecast, by Application 2019 & 2032
- Table 128: South Africa Bile Duct Cancer Industry Volume (K Unit) Forecast, by Application 2019 & 2032
- Table 129: Rest of Middle East and Africa Bile Duct Cancer Industry Revenue (Million) Forecast, by Application 2019 & 2032
- Table 130: Rest of Middle East and Africa Bile Duct Cancer Industry Volume (K Unit) Forecast, by Application 2019 & 2032
- Table 131: Global Bile Duct Cancer Industry Revenue Million Forecast, by Type 2019 & 2032
- Table 132: Global Bile Duct Cancer Industry Volume K Unit Forecast, by Type 2019 & 2032
- Table 133: Global Bile Duct Cancer Industry Revenue Million Forecast, by Therapy 2019 & 2032
- Table 134: Global Bile Duct Cancer Industry Volume K Unit Forecast, by Therapy 2019 & 2032
- Table 135: Global Bile Duct Cancer Industry Revenue Million Forecast, by End-user 2019 & 2032
- Table 136: Global Bile Duct Cancer Industry Volume K Unit Forecast, by End-user 2019 & 2032
- Table 137: Global Bile Duct Cancer Industry Revenue Million Forecast, by Country 2019 & 2032
- Table 138: Global Bile Duct Cancer Industry Volume K Unit Forecast, by Country 2019 & 2032
- Table 139: Brazil Bile Duct Cancer Industry Revenue (Million) Forecast, by Application 2019 & 2032
- Table 140: Brazil Bile Duct Cancer Industry Volume (K Unit) Forecast, by Application 2019 & 2032
- Table 141: Argentina Bile Duct Cancer Industry Revenue (Million) Forecast, by Application 2019 & 2032
- Table 142: Argentina Bile Duct Cancer Industry Volume (K Unit) Forecast, by Application 2019 & 2032
- Table 143: Rest of South America Bile Duct Cancer Industry Revenue (Million) Forecast, by Application 2019 & 2032
- Table 144: Rest of South America Bile Duct Cancer Industry Volume (K Unit) Forecast, by Application 2019 & 2032
Frequently Asked Questions
1. What is the projected Compound Annual Growth Rate (CAGR) of the Bile Duct Cancer Industry?
The projected CAGR is approximately 18.76%.
2. Which companies are prominent players in the Bile Duct Cancer Industry?
Key companies in the market include Sanofi SA, Exelixis Inc, Bayer AG, Amgen Inc, Merck & Co Inc, F Hoffmann-La Roche Ltd, AstraZeneca PLC, Eli Lilly and Company, AbbVie Inc, Bristol Myers Squibb Company, Novartis AG, Johnson & Johnson, Eisai Co Ltd, Celsion Corporation, Pfizer Inc.
3. What are the main segments of the Bile Duct Cancer Industry?
The market segments include Type, Therapy, End-user.
4. Can you provide details about the market size?
The market size is estimated to be USD 3.66 Million as of 2022.
5. What are some drivers contributing to market growth?
Rising Burden of Liver Cancer; Increasing R&D Investments for the Development of Novel Therapies; Government Initiatives to Increase the Cancer Awareness.
6. What are the notable trends driving market growth?
Hepatocellular Carcinoma Segment is Expected to Occupy a Significant Share Over the Forecast Period.
7. Are there any restraints impacting market growth?
Side Effects Associated with Certain Medications Coupled with High Cost of Cancer Therapies; Stringent Regulatory Scenario.
8. Can you provide examples of recent developments in the market?
March 2023: The University of Southern California (USC) collaborated with Auransa Inc. on a phase 1 clinical trial to evaluate a new kind of treatment for cancers of the liver and solid tumors with liver-dominant disease. The drug, known as AU409, was developed by Auransa, a clinical-stage drug development company focused on identifying novel drug candidates for oncology, inflammatory diseases, and diseases of the central nervous system.
9. What pricing options are available for accessing the report?
Pricing options include single-user, multi-user, and enterprise licenses priced at USD 4750, USD 5250, and USD 8750 respectively.
10. Is the market size provided in terms of value or volume?
The market size is provided in terms of value, measured in Million and volume, measured in K Unit.
11. Are there any specific market keywords associated with the report?
Yes, the market keyword associated with the report is "Bile Duct Cancer Industry," which aids in identifying and referencing the specific market segment covered.
12. How do I determine which pricing option suits my needs best?
The pricing options vary based on user requirements and access needs. Individual users may opt for single-user licenses, while businesses requiring broader access may choose multi-user or enterprise licenses for cost-effective access to the report.
13. Are there any additional resources or data provided in the Bile Duct Cancer Industry report?
While the report offers comprehensive insights, it's advisable to review the specific contents or supplementary materials provided to ascertain if additional resources or data are available.
14. How can I stay updated on further developments or reports in the Bile Duct Cancer Industry?
To stay informed about further developments, trends, and reports in the Bile Duct Cancer Industry, consider subscribing to industry newsletters, following relevant companies and organizations, or regularly checking reputable industry news sources and publications.
Methodology
Step 1 - Identification of Relevant Samples Size from Population Database


Step 2 - Approaches for Defining Global Market Size (Value, Volume* & Price*)

Note*: In applicable scenarios
Step 3 - Data Sources
Primary Research
- Web Analytics
- Survey Reports
- Research Institute
- Latest Research Reports
- Opinion Leaders
Secondary Research
- Annual Reports
- White Paper
- Latest Press Release
- Industry Association
- Paid Database
- Investor Presentations

Step 4 - Data Triangulation
Involves using different sources of information in order to increase the validity of a study
These sources are likely to be stakeholders in a program - participants, other researchers, program staff, other community members, and so on.
Then we put all data in single framework & apply various statistical tools to find out the dynamic on the market.
During the analysis stage, feedback from the stakeholder groups would be compared to determine areas of agreement as well as areas of divergence


