
Key Insights
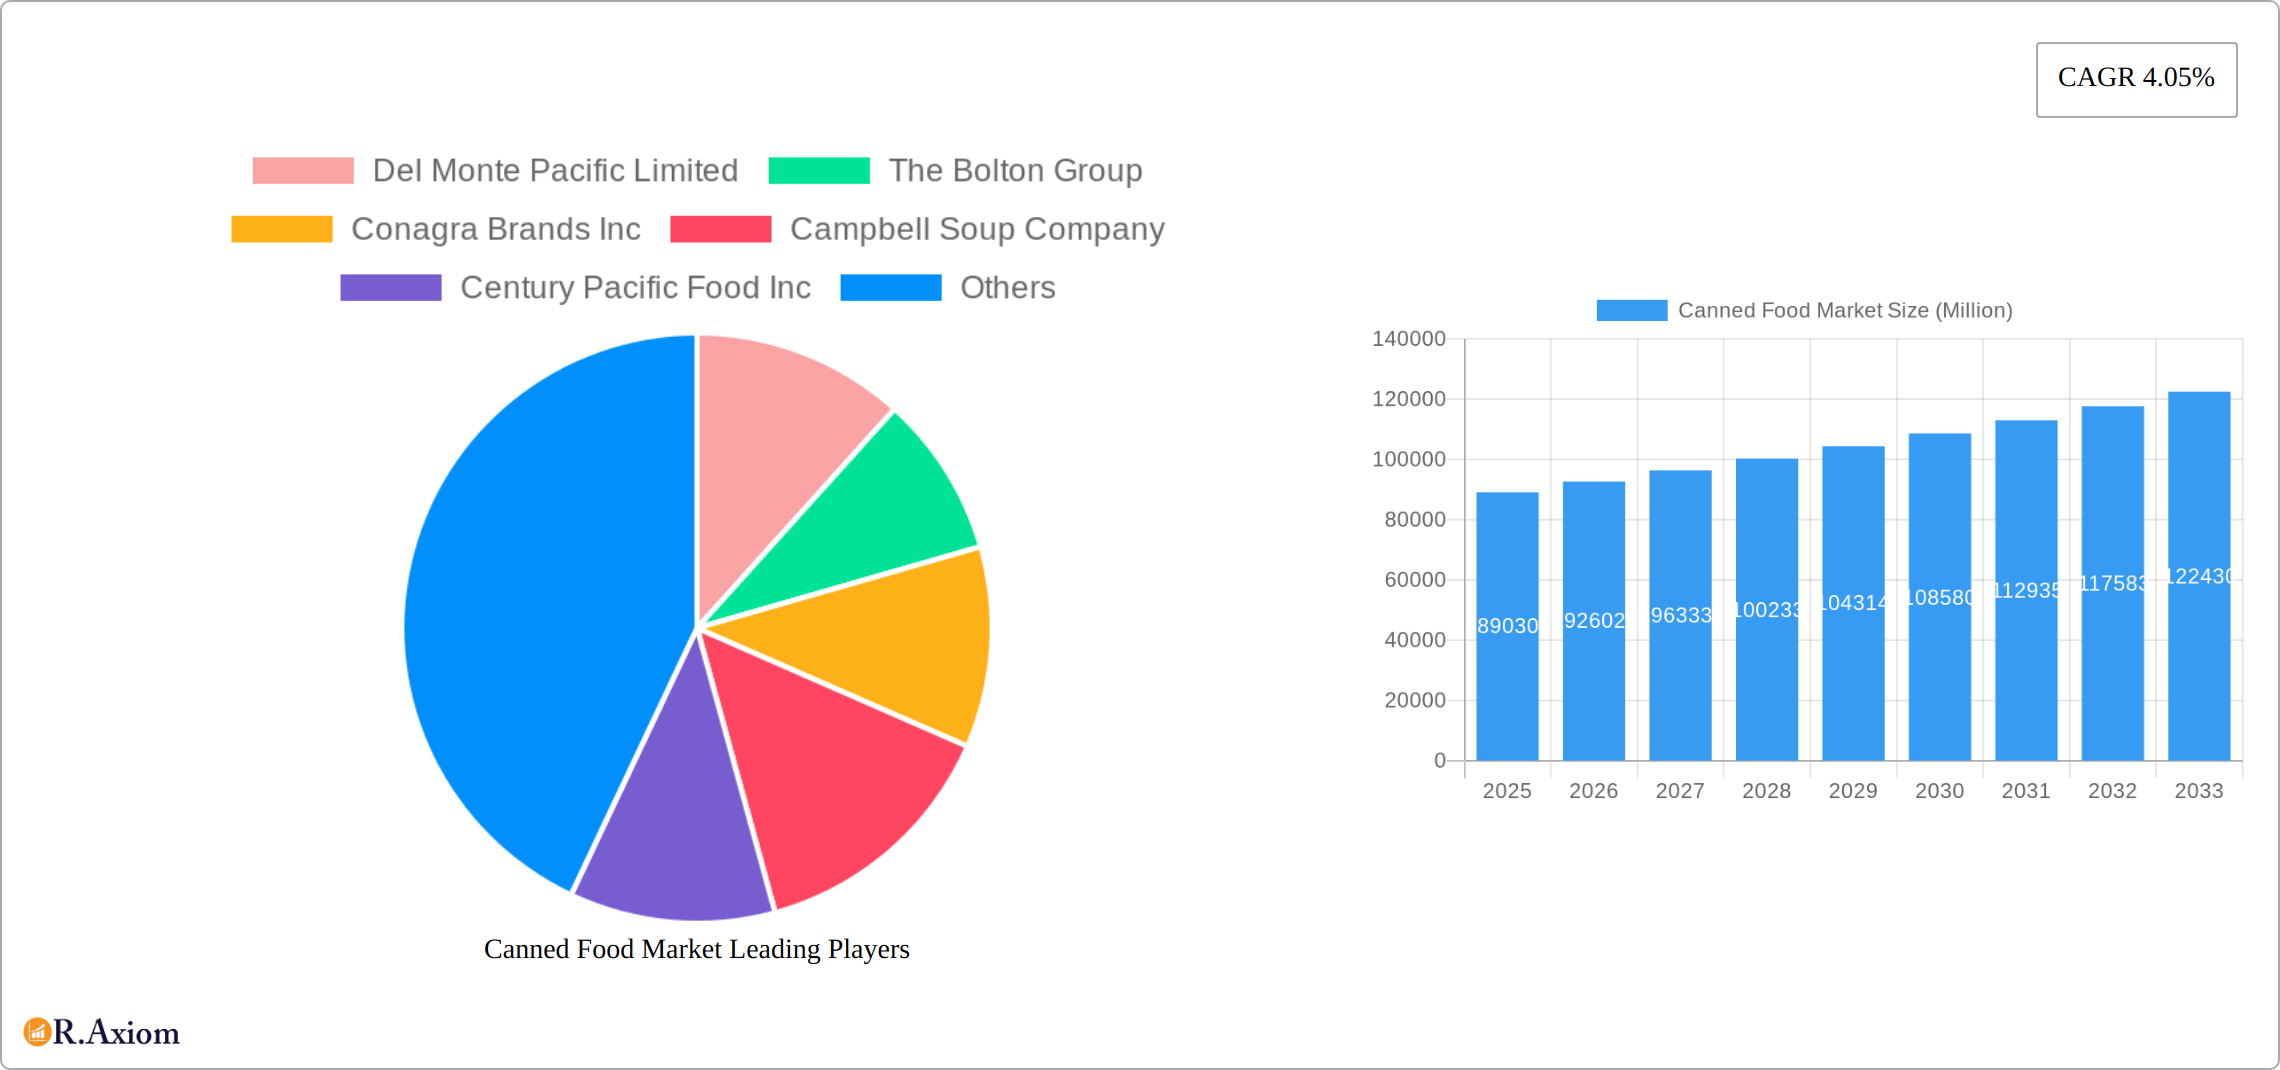
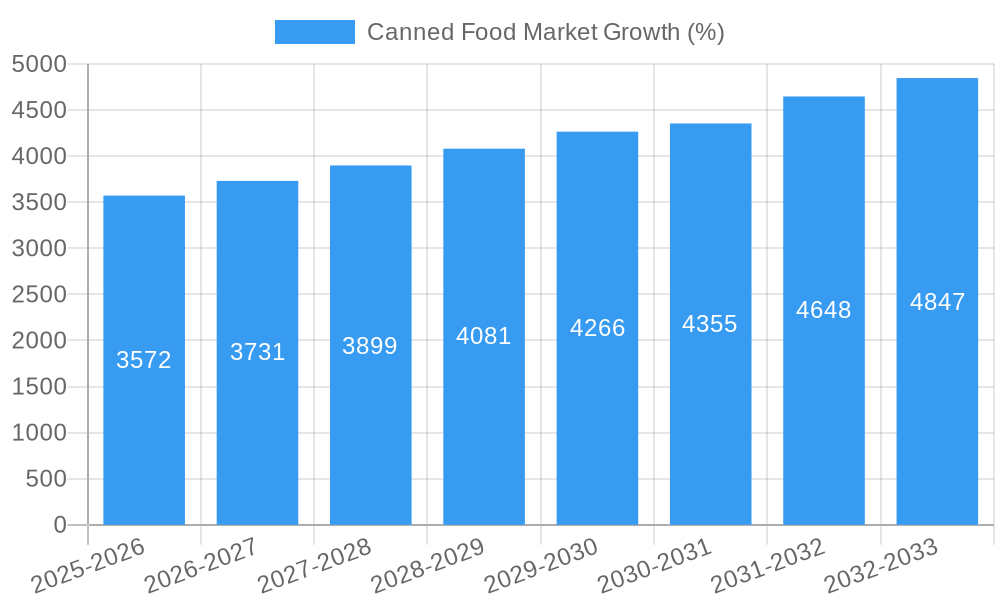
The global canned food market, valued at $89.03 billion in 2025, is projected to experience steady growth with a compound annual growth rate (CAGR) of 4.05% from 2025 to 2033. This growth is driven by several key factors. Increasing urbanization and busy lifestyles are fueling the demand for convenient and shelf-stable food options. The rising popularity of ready-to-eat meals and the growing preference for healthy and nutritious food, particularly among health-conscious consumers, is further boosting market expansion. Furthermore, advancements in food processing and packaging technologies are contributing to improved product quality and extended shelf life, enhancing consumer appeal. The canned food industry is also benefiting from strategic partnerships and mergers and acquisitions, fostering innovation and expanding product portfolios. Major players like Del Monte, Conagra Brands, and Dole are investing significantly in research and development to introduce innovative products and cater to evolving consumer preferences, such as organic and low-sodium options. The robust presence of established companies, coupled with the entry of smaller players focusing on niche segments, ensures competitive intensity, leading to increased product diversity and enhanced market penetration.
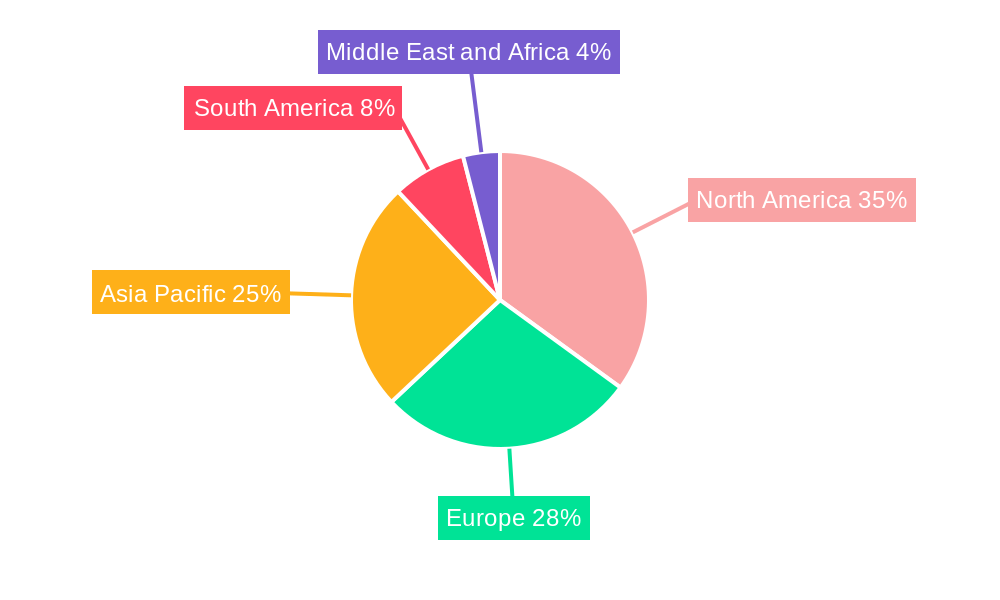
However, certain challenges persist. Fluctuations in raw material prices, particularly agricultural commodities, can impact production costs and profitability. Stringent regulations and safety standards related to food processing and packaging also pose challenges for manufacturers. Moreover, changing consumer preferences toward fresh and minimally processed foods may pose a challenge to the growth of the canned food market in the long term. Nevertheless, the market is expected to remain resilient, driven by its inherent convenience and affordability, especially in developing economies where access to fresh produce might be limited. Segmentation analysis reveals significant market share for canned meat products and canned fish/seafood, reflecting strong consumer demand across various geographies. North America and Europe currently hold dominant market positions, although the Asia-Pacific region shows significant potential for future growth given its expanding population and rising disposable incomes. The distribution channel analysis demonstrates a strong reliance on supermarkets and hypermarkets, though online retail is emerging as a significant avenue for growth in the coming years.
Canned Food Market: A Comprehensive Analysis (2019-2033)
This in-depth report provides a comprehensive analysis of the global canned food market, offering valuable insights for industry stakeholders, investors, and market entrants. The study covers the period from 2019 to 2033, with 2025 serving as the base and estimated year. We delve into market dynamics, segmentation, key players, and future growth prospects, providing actionable intelligence for strategic decision-making. The report projects a xx Million market value by 2033, exhibiting a CAGR of xx% during the forecast period (2025-2033).
Canned Food Market Concentration & Innovation
This section analyzes the competitive landscape, innovation drivers, and regulatory influences within the canned food market. The market exhibits moderate concentration, with key players such as Del Monte Pacific Limited, Conagra Brands Inc, and Campbell Soup Company holding significant market share. However, smaller, niche players are also contributing significantly to innovation, particularly in sustainable and organic product offerings. The combined market share of the top 5 players is estimated at xx% in 2025.
- Mergers & Acquisitions (M&A): The canned food sector has witnessed significant M&A activity in recent years, with deal values totaling xx Million in 2024. These activities reflect consolidation trends and efforts to expand product portfolios and market reach. For example, The Bolton Group's acquisition of Wild Planet Foods signifies a strategic move towards the growing demand for sustainable seafood.
- Innovation Drivers: Consumer demand for healthier, convenient, and ethically sourced canned food products is a key innovation driver. This includes the rise of organic, plant-based, and sustainably sourced options. Technological advancements in packaging and processing are also contributing to innovation.
- Regulatory Framework: Stringent food safety regulations and labeling requirements are influencing product development and manufacturing processes. Sustainability certifications and ethical sourcing standards are gaining importance, shaping consumer choices and industry practices.
- Product Substitutes: Fresh produce and frozen foods pose as major substitutes for canned foods; however, the convenience and longer shelf life of canned foods remain a significant advantage.
- End-User Trends: Growing urbanization, increasing disposable incomes, and changing lifestyles contribute to the demand for convenient and affordable food options, thus boosting the canned food market.
Canned Food Market Industry Trends & Insights
The canned food market is experiencing dynamic shifts driven by evolving consumer preferences, technological advancements, and intensifying competition. The market is witnessing a surge in demand for premium and specialized canned food products, along with increased focus on health and sustainability. This is reflected in the rising popularity of organic, gluten-free, and low-sodium options. The market is also experiencing technological disruptions in areas such as packaging, automation, and supply chain management. The significant expansion of e-commerce channels offers new avenues for market penetration and growth.
Dominant Markets & Segments in Canned Food Market
The global canned food market is a dynamic landscape characterized by diverse regional consumption patterns and preferences. While North America and Europe currently hold significant market shares, driven by established distribution networks and strong consumer demand for convenient and affordable food options, the Asia-Pacific region exhibits exceptional growth potential. This surge is fueled by rapid urbanization, a burgeoning middle class with increasing disposable income, and a shift towards convenient meal solutions.
Leading Segments: A Detailed Look
- Product Type: Traditional segments like canned vegetables and fruits remain dominant due to their affordability and widespread acceptance. However, the canned fish/seafood segment is experiencing robust growth, driven by rising health consciousness and the recognition of seafood's nutritional benefits. Further diversification is evident with increasing demand for canned meat products and specialized options catering to specific dietary needs and preferences.
- Distribution Channel: Supermarkets and hypermarkets continue to be major distribution channels, but the online retail sector is experiencing explosive growth, mirroring the broader e-commerce boom and consumer preference for home delivery. Convenience stores and smaller grocery stores also play a vital role in localized markets.
Regional Market Dynamics:
- North America: This region's dominance stems from high per capita consumption, robust retail infrastructure, and a well-established consumer preference for the convenience and long shelf life that canned foods offer. Innovation in product offerings and packaging also plays a significant role.
- Europe: Similar to North America, Europe demonstrates strong and consistent demand for canned foods, underpinned by extensive retail networks and mature consumer markets. Consumer preferences, however, are increasingly influenced by factors such as sustainability and health-conscious choices.
- Asia-Pacific: This region presents significant untapped potential, with rapid economic expansion, increasing urbanization driving demand for convenient food solutions, and evolving consumer lifestyles fueling considerable growth. Market penetration in this region is expected to accelerate in the coming years.
Canned Food Market Product Developments
Recent product developments reflect a focus on health, convenience, and sustainability. Innovations include the introduction of organic and plant-based options, as well as products with reduced sodium and added nutrients. Improved packaging technologies enhance shelf life and reduce environmental impact. The market is also seeing increased use of retort pouch technology offering flexible packaging alternatives.
Report Scope & Segmentation Analysis
This report segments the canned food market by product type (Canned Meat Products, Canned Fish/Seafood, Canned Vegetables, Canned Fruits, Other Types) and distribution channel (Supermarkets/Hypermarkets, Convenience/Grocery Stores, Online Retail Stores, Other Distribution Channels). Each segment’s growth projections, market sizes, and competitive dynamics are detailed within the report. For example, the canned fish/seafood segment is projected to exhibit a xx% CAGR during the forecast period due to its health benefits, while online retail channels are expected to witness robust growth driven by increased e-commerce adoption.
Key Drivers of Canned Food Market Growth
The canned food market is propelled by several factors, including:
- Rising Urbanization: Increasing urbanization leads to higher demand for convenient food options, significantly impacting canned food consumption.
- Technological Advancements: Innovations in packaging and processing enhance shelf life and product quality, further boosting the market.
- Government Regulations: Food safety regulations and labeling mandates influence product development and market expansion.
Challenges in the Canned Food Market Sector
The canned food market faces several challenges, including:
- Fluctuating Raw Material Prices: Volatility in agricultural commodity prices impacts production costs and profitability.
- Supply Chain Disruptions: Global supply chain vulnerabilities impact the availability and timely delivery of raw materials and finished products.
- Intense Competition: The market is characterized by intense competition among established players and emerging brands.
Emerging Opportunities in Canned Food Market
Emerging opportunities exist in:
- Premium & Specialized Products: Growing demand for organic, plant-based, and gourmet canned food items presents lucrative opportunities.
- Sustainable Packaging: Focus on eco-friendly packaging solutions meets the rising consumer concern for environmental sustainability.
- E-commerce Expansion: The growing popularity of online grocery shopping presents significant expansion potential for the industry.
Leading Players in the Canned Food Market Market
- Del Monte Pacific Limited
- The Bolton Group
- Conagra Brands Inc
- Campbell Soup Company
- Century Pacific Food Inc
- Thai Union Group PCL
- Dole Holding Company LLC
- JBS S A (SAMPCO)
- Bonduelle SA
- Kraft Heinz Company
Key Developments in Canned Food Market Industry
- October 2022: Campbell Soup Company launched four new spicy Chunky Soup flavors.
- September 2022: Campbell's Pacific Foods introduced new organic ready-to-serve soups and plant-based chills.
- August 2021: The Bolton Group acquired Wild Planet Foods.
Strategic Outlook for Canned Food Market Market
The canned food market is projected to experience sustained growth driven by consumer preferences for convenience, health consciousness, and sustainability. Emerging market opportunities in premium products, sustainable packaging, and e-commerce will further shape the industry's trajectory. Strategic investments in innovation, supply chain optimization, and brand building will be crucial for success in this dynamic market.
Canned Food Market Segmentation
-
1. Type
- 1.1. Canned Meat Products
- 1.2. Canned Fish/Seafood
- 1.3. Canned Vegetables
- 1.4. Canned Fruits
- 1.5. Other Types
-
2. Distribution Channel
- 2.1. Supermarkets/Hypermarkets
- 2.2. Convenience/Grocery Stores
- 2.3. Online Retail Stores
- 2.4. Other Distribution Channels
Canned Food Market Segmentation By Geography
-
1. North America
- 1.1. United States
- 1.2. Canada
- 1.3. Mexico
- 1.4. Rest of North America
-
2. Europe
- 2.1. Spain
- 2.2. United Kingdom
- 2.3. Germany
- 2.4. France
- 2.5. Italy
- 2.6. Netherlands
- 2.7. Rest of Europe
-
3. Asia Pacific
- 3.1. China
- 3.2. Japan
- 3.3. India
- 3.4. Australia
- 3.5. Rest of Asia Pacific
-
4. South America
- 4.1. Brazil
- 4.2. Argentina
- 4.3. Rest of South America
-
5. Middle East and Africa
- 5.1. South Africa
- 5.2. Saudi Arabia
- 5.3. Rest of Middle East and Africa
Canned Food Market REPORT HIGHLIGHTS
| Aspects | Details |
|---|---|
| Study Period | 2019-2033 |
| Base Year | 2024 |
| Estimated Year | 2025 |
| Forecast Period | 2025-2033 |
| Historical Period | 2019-2024 |
| Growth Rate | CAGR of 4.05% from 2019-2033 |
| Segmentation |
|
Table of Contents
- 1. Introduction
- 1.1. Research Scope
- 1.2. Market Segmentation
- 1.3. Research Methodology
- 1.4. Definitions and Assumptions
- 2. Executive Summary
- 2.1. Introduction
- 3. Market Dynamics
- 3.1. Introduction
- 3.2. Market Drivers
- 3.2.1. Increasing urbanization and globalization contribute to changing dietary habits and a greater demand for convenient food options
- 3.3. Market Restrains
- 3.3.1. Shelf Life Limitations and Changing Consumer Preferences
- 3.4. Market Trends
- 3.4.1. Increasing variety of canned foods including gourmet and premium options
- 4. Market Factor Analysis
- 4.1. Porters Five Forces
- 4.2. Supply/Value Chain
- 4.3. PESTEL analysis
- 4.4. Market Entropy
- 4.5. Patent/Trademark Analysis
- 5. Global Canned Food Market Analysis, Insights and Forecast, 2019-2031
- 5.1. Market Analysis, Insights and Forecast - by Type
- 5.1.1. Canned Meat Products
- 5.1.2. Canned Fish/Seafood
- 5.1.3. Canned Vegetables
- 5.1.4. Canned Fruits
- 5.1.5. Other Types
- 5.2. Market Analysis, Insights and Forecast - by Distribution Channel
- 5.2.1. Supermarkets/Hypermarkets
- 5.2.2. Convenience/Grocery Stores
- 5.2.3. Online Retail Stores
- 5.2.4. Other Distribution Channels
- 5.3. Market Analysis, Insights and Forecast - by Region
- 5.3.1. North America
- 5.3.2. Europe
- 5.3.3. Asia Pacific
- 5.3.4. South America
- 5.3.5. Middle East and Africa
- 5.1. Market Analysis, Insights and Forecast - by Type
- 6. North America Canned Food Market Analysis, Insights and Forecast, 2019-2031
- 6.1. Market Analysis, Insights and Forecast - by Type
- 6.1.1. Canned Meat Products
- 6.1.2. Canned Fish/Seafood
- 6.1.3. Canned Vegetables
- 6.1.4. Canned Fruits
- 6.1.5. Other Types
- 6.2. Market Analysis, Insights and Forecast - by Distribution Channel
- 6.2.1. Supermarkets/Hypermarkets
- 6.2.2. Convenience/Grocery Stores
- 6.2.3. Online Retail Stores
- 6.2.4. Other Distribution Channels
- 6.1. Market Analysis, Insights and Forecast - by Type
- 7. Europe Canned Food Market Analysis, Insights and Forecast, 2019-2031
- 7.1. Market Analysis, Insights and Forecast - by Type
- 7.1.1. Canned Meat Products
- 7.1.2. Canned Fish/Seafood
- 7.1.3. Canned Vegetables
- 7.1.4. Canned Fruits
- 7.1.5. Other Types
- 7.2. Market Analysis, Insights and Forecast - by Distribution Channel
- 7.2.1. Supermarkets/Hypermarkets
- 7.2.2. Convenience/Grocery Stores
- 7.2.3. Online Retail Stores
- 7.2.4. Other Distribution Channels
- 7.1. Market Analysis, Insights and Forecast - by Type
- 8. Asia Pacific Canned Food Market Analysis, Insights and Forecast, 2019-2031
- 8.1. Market Analysis, Insights and Forecast - by Type
- 8.1.1. Canned Meat Products
- 8.1.2. Canned Fish/Seafood
- 8.1.3. Canned Vegetables
- 8.1.4. Canned Fruits
- 8.1.5. Other Types
- 8.2. Market Analysis, Insights and Forecast - by Distribution Channel
- 8.2.1. Supermarkets/Hypermarkets
- 8.2.2. Convenience/Grocery Stores
- 8.2.3. Online Retail Stores
- 8.2.4. Other Distribution Channels
- 8.1. Market Analysis, Insights and Forecast - by Type
- 9. South America Canned Food Market Analysis, Insights and Forecast, 2019-2031
- 9.1. Market Analysis, Insights and Forecast - by Type
- 9.1.1. Canned Meat Products
- 9.1.2. Canned Fish/Seafood
- 9.1.3. Canned Vegetables
- 9.1.4. Canned Fruits
- 9.1.5. Other Types
- 9.2. Market Analysis, Insights and Forecast - by Distribution Channel
- 9.2.1. Supermarkets/Hypermarkets
- 9.2.2. Convenience/Grocery Stores
- 9.2.3. Online Retail Stores
- 9.2.4. Other Distribution Channels
- 9.1. Market Analysis, Insights and Forecast - by Type
- 10. Middle East and Africa Canned Food Market Analysis, Insights and Forecast, 2019-2031
- 10.1. Market Analysis, Insights and Forecast - by Type
- 10.1.1. Canned Meat Products
- 10.1.2. Canned Fish/Seafood
- 10.1.3. Canned Vegetables
- 10.1.4. Canned Fruits
- 10.1.5. Other Types
- 10.2. Market Analysis, Insights and Forecast - by Distribution Channel
- 10.2.1. Supermarkets/Hypermarkets
- 10.2.2. Convenience/Grocery Stores
- 10.2.3. Online Retail Stores
- 10.2.4. Other Distribution Channels
- 10.1. Market Analysis, Insights and Forecast - by Type
- 11. North America Canned Food Market Analysis, Insights and Forecast, 2019-2031
- 11.1. Market Analysis, Insights and Forecast - By Country/Sub-region
- 11.1.1 United States
- 11.1.2 Canada
- 11.1.3 Mexico
- 11.1.4 Rest of North America
- 12. Europe Canned Food Market Analysis, Insights and Forecast, 2019-2031
- 12.1. Market Analysis, Insights and Forecast - By Country/Sub-region
- 12.1.1 Spain
- 12.1.2 United Kingdom
- 12.1.3 Germany
- 12.1.4 France
- 12.1.5 Italy
- 12.1.6 Russia
- 12.1.7 Rest of Europe
- 13. Asia Pacific Canned Food Market Analysis, Insights and Forecast, 2019-2031
- 13.1. Market Analysis, Insights and Forecast - By Country/Sub-region
- 13.1.1 China
- 13.1.2 Japan
- 13.1.3 India
- 13.1.4 Australia
- 13.1.5 Rest of Asia Pacific
- 14. South America Canned Food Market Analysis, Insights and Forecast, 2019-2031
- 14.1. Market Analysis, Insights and Forecast - By Country/Sub-region
- 14.1.1 Brazil
- 14.1.2 Argentina
- 14.1.3 Rest of South America
- 15. Middle East and Africa Canned Food Market Analysis, Insights and Forecast, 2019-2031
- 15.1. Market Analysis, Insights and Forecast - By Country/Sub-region
- 15.1.1 South Africa
- 15.1.2 Saudi Arabia
- 15.1.3 Rest of Middle East and Africa
- 16. Competitive Analysis
- 16.1. Global Market Share Analysis 2024
- 16.2. Company Profiles
- 16.2.1 Del Monte Pacific Limited
- 16.2.1.1. Overview
- 16.2.1.2. Products
- 16.2.1.3. SWOT Analysis
- 16.2.1.4. Recent Developments
- 16.2.1.5. Financials (Based on Availability)
- 16.2.2 The Bolton Group
- 16.2.2.1. Overview
- 16.2.2.2. Products
- 16.2.2.3. SWOT Analysis
- 16.2.2.4. Recent Developments
- 16.2.2.5. Financials (Based on Availability)
- 16.2.3 Conagra Brands Inc
- 16.2.3.1. Overview
- 16.2.3.2. Products
- 16.2.3.3. SWOT Analysis
- 16.2.3.4. Recent Developments
- 16.2.3.5. Financials (Based on Availability)
- 16.2.4 Campbell Soup Company
- 16.2.4.1. Overview
- 16.2.4.2. Products
- 16.2.4.3. SWOT Analysis
- 16.2.4.4. Recent Developments
- 16.2.4.5. Financials (Based on Availability)
- 16.2.5 Century Pacific Food Inc
- 16.2.5.1. Overview
- 16.2.5.2. Products
- 16.2.5.3. SWOT Analysis
- 16.2.5.4. Recent Developments
- 16.2.5.5. Financials (Based on Availability)
- 16.2.6 Thai Union Group PCL
- 16.2.6.1. Overview
- 16.2.6.2. Products
- 16.2.6.3. SWOT Analysis
- 16.2.6.4. Recent Developments
- 16.2.6.5. Financials (Based on Availability)
- 16.2.7 Dole Holding Company LLC
- 16.2.7.1. Overview
- 16.2.7.2. Products
- 16.2.7.3. SWOT Analysis
- 16.2.7.4. Recent Developments
- 16.2.7.5. Financials (Based on Availability)
- 16.2.8 JBS S A (SAMPCO)
- 16.2.8.1. Overview
- 16.2.8.2. Products
- 16.2.8.3. SWOT Analysis
- 16.2.8.4. Recent Developments
- 16.2.8.5. Financials (Based on Availability)
- 16.2.9 Bonduelle SA
- 16.2.9.1. Overview
- 16.2.9.2. Products
- 16.2.9.3. SWOT Analysis
- 16.2.9.4. Recent Developments
- 16.2.9.5. Financials (Based on Availability)
- 16.2.10 Kraft Heinz Company
- 16.2.10.1. Overview
- 16.2.10.2. Products
- 16.2.10.3. SWOT Analysis
- 16.2.10.4. Recent Developments
- 16.2.10.5. Financials (Based on Availability)
- 16.2.1 Del Monte Pacific Limited
List of Figures
- Figure 1: Global Canned Food Market Revenue Breakdown (Million, %) by Region 2024 & 2032
- Figure 2: Global Canned Food Market Volume Breakdown (K Tons, %) by Region 2024 & 2032
- Figure 3: North America Canned Food Market Revenue (Million), by Country 2024 & 2032
- Figure 4: North America Canned Food Market Volume (K Tons), by Country 2024 & 2032
- Figure 5: North America Canned Food Market Revenue Share (%), by Country 2024 & 2032
- Figure 6: North America Canned Food Market Volume Share (%), by Country 2024 & 2032
- Figure 7: Europe Canned Food Market Revenue (Million), by Country 2024 & 2032
- Figure 8: Europe Canned Food Market Volume (K Tons), by Country 2024 & 2032
- Figure 9: Europe Canned Food Market Revenue Share (%), by Country 2024 & 2032
- Figure 10: Europe Canned Food Market Volume Share (%), by Country 2024 & 2032
- Figure 11: Asia Pacific Canned Food Market Revenue (Million), by Country 2024 & 2032
- Figure 12: Asia Pacific Canned Food Market Volume (K Tons), by Country 2024 & 2032
- Figure 13: Asia Pacific Canned Food Market Revenue Share (%), by Country 2024 & 2032
- Figure 14: Asia Pacific Canned Food Market Volume Share (%), by Country 2024 & 2032
- Figure 15: South America Canned Food Market Revenue (Million), by Country 2024 & 2032
- Figure 16: South America Canned Food Market Volume (K Tons), by Country 2024 & 2032
- Figure 17: South America Canned Food Market Revenue Share (%), by Country 2024 & 2032
- Figure 18: South America Canned Food Market Volume Share (%), by Country 2024 & 2032
- Figure 19: Middle East and Africa Canned Food Market Revenue (Million), by Country 2024 & 2032
- Figure 20: Middle East and Africa Canned Food Market Volume (K Tons), by Country 2024 & 2032
- Figure 21: Middle East and Africa Canned Food Market Revenue Share (%), by Country 2024 & 2032
- Figure 22: Middle East and Africa Canned Food Market Volume Share (%), by Country 2024 & 2032
- Figure 23: North America Canned Food Market Revenue (Million), by Type 2024 & 2032
- Figure 24: North America Canned Food Market Volume (K Tons), by Type 2024 & 2032
- Figure 25: North America Canned Food Market Revenue Share (%), by Type 2024 & 2032
- Figure 26: North America Canned Food Market Volume Share (%), by Type 2024 & 2032
- Figure 27: North America Canned Food Market Revenue (Million), by Distribution Channel 2024 & 2032
- Figure 28: North America Canned Food Market Volume (K Tons), by Distribution Channel 2024 & 2032
- Figure 29: North America Canned Food Market Revenue Share (%), by Distribution Channel 2024 & 2032
- Figure 30: North America Canned Food Market Volume Share (%), by Distribution Channel 2024 & 2032
- Figure 31: North America Canned Food Market Revenue (Million), by Country 2024 & 2032
- Figure 32: North America Canned Food Market Volume (K Tons), by Country 2024 & 2032
- Figure 33: North America Canned Food Market Revenue Share (%), by Country 2024 & 2032
- Figure 34: North America Canned Food Market Volume Share (%), by Country 2024 & 2032
- Figure 35: Europe Canned Food Market Revenue (Million), by Type 2024 & 2032
- Figure 36: Europe Canned Food Market Volume (K Tons), by Type 2024 & 2032
- Figure 37: Europe Canned Food Market Revenue Share (%), by Type 2024 & 2032
- Figure 38: Europe Canned Food Market Volume Share (%), by Type 2024 & 2032
- Figure 39: Europe Canned Food Market Revenue (Million), by Distribution Channel 2024 & 2032
- Figure 40: Europe Canned Food Market Volume (K Tons), by Distribution Channel 2024 & 2032
- Figure 41: Europe Canned Food Market Revenue Share (%), by Distribution Channel 2024 & 2032
- Figure 42: Europe Canned Food Market Volume Share (%), by Distribution Channel 2024 & 2032
- Figure 43: Europe Canned Food Market Revenue (Million), by Country 2024 & 2032
- Figure 44: Europe Canned Food Market Volume (K Tons), by Country 2024 & 2032
- Figure 45: Europe Canned Food Market Revenue Share (%), by Country 2024 & 2032
- Figure 46: Europe Canned Food Market Volume Share (%), by Country 2024 & 2032
- Figure 47: Asia Pacific Canned Food Market Revenue (Million), by Type 2024 & 2032
- Figure 48: Asia Pacific Canned Food Market Volume (K Tons), by Type 2024 & 2032
- Figure 49: Asia Pacific Canned Food Market Revenue Share (%), by Type 2024 & 2032
- Figure 50: Asia Pacific Canned Food Market Volume Share (%), by Type 2024 & 2032
- Figure 51: Asia Pacific Canned Food Market Revenue (Million), by Distribution Channel 2024 & 2032
- Figure 52: Asia Pacific Canned Food Market Volume (K Tons), by Distribution Channel 2024 & 2032
- Figure 53: Asia Pacific Canned Food Market Revenue Share (%), by Distribution Channel 2024 & 2032
- Figure 54: Asia Pacific Canned Food Market Volume Share (%), by Distribution Channel 2024 & 2032
- Figure 55: Asia Pacific Canned Food Market Revenue (Million), by Country 2024 & 2032
- Figure 56: Asia Pacific Canned Food Market Volume (K Tons), by Country 2024 & 2032
- Figure 57: Asia Pacific Canned Food Market Revenue Share (%), by Country 2024 & 2032
- Figure 58: Asia Pacific Canned Food Market Volume Share (%), by Country 2024 & 2032
- Figure 59: South America Canned Food Market Revenue (Million), by Type 2024 & 2032
- Figure 60: South America Canned Food Market Volume (K Tons), by Type 2024 & 2032
- Figure 61: South America Canned Food Market Revenue Share (%), by Type 2024 & 2032
- Figure 62: South America Canned Food Market Volume Share (%), by Type 2024 & 2032
- Figure 63: South America Canned Food Market Revenue (Million), by Distribution Channel 2024 & 2032
- Figure 64: South America Canned Food Market Volume (K Tons), by Distribution Channel 2024 & 2032
- Figure 65: South America Canned Food Market Revenue Share (%), by Distribution Channel 2024 & 2032
- Figure 66: South America Canned Food Market Volume Share (%), by Distribution Channel 2024 & 2032
- Figure 67: South America Canned Food Market Revenue (Million), by Country 2024 & 2032
- Figure 68: South America Canned Food Market Volume (K Tons), by Country 2024 & 2032
- Figure 69: South America Canned Food Market Revenue Share (%), by Country 2024 & 2032
- Figure 70: South America Canned Food Market Volume Share (%), by Country 2024 & 2032
- Figure 71: Middle East and Africa Canned Food Market Revenue (Million), by Type 2024 & 2032
- Figure 72: Middle East and Africa Canned Food Market Volume (K Tons), by Type 2024 & 2032
- Figure 73: Middle East and Africa Canned Food Market Revenue Share (%), by Type 2024 & 2032
- Figure 74: Middle East and Africa Canned Food Market Volume Share (%), by Type 2024 & 2032
- Figure 75: Middle East and Africa Canned Food Market Revenue (Million), by Distribution Channel 2024 & 2032
- Figure 76: Middle East and Africa Canned Food Market Volume (K Tons), by Distribution Channel 2024 & 2032
- Figure 77: Middle East and Africa Canned Food Market Revenue Share (%), by Distribution Channel 2024 & 2032
- Figure 78: Middle East and Africa Canned Food Market Volume Share (%), by Distribution Channel 2024 & 2032
- Figure 79: Middle East and Africa Canned Food Market Revenue (Million), by Country 2024 & 2032
- Figure 80: Middle East and Africa Canned Food Market Volume (K Tons), by Country 2024 & 2032
- Figure 81: Middle East and Africa Canned Food Market Revenue Share (%), by Country 2024 & 2032
- Figure 82: Middle East and Africa Canned Food Market Volume Share (%), by Country 2024 & 2032
List of Tables
- Table 1: Global Canned Food Market Revenue Million Forecast, by Region 2019 & 2032
- Table 2: Global Canned Food Market Volume K Tons Forecast, by Region 2019 & 2032
- Table 3: Global Canned Food Market Revenue Million Forecast, by Type 2019 & 2032
- Table 4: Global Canned Food Market Volume K Tons Forecast, by Type 2019 & 2032
- Table 5: Global Canned Food Market Revenue Million Forecast, by Distribution Channel 2019 & 2032
- Table 6: Global Canned Food Market Volume K Tons Forecast, by Distribution Channel 2019 & 2032
- Table 7: Global Canned Food Market Revenue Million Forecast, by Region 2019 & 2032
- Table 8: Global Canned Food Market Volume K Tons Forecast, by Region 2019 & 2032
- Table 9: Global Canned Food Market Revenue Million Forecast, by Country 2019 & 2032
- Table 10: Global Canned Food Market Volume K Tons Forecast, by Country 2019 & 2032
- Table 11: United States Canned Food Market Revenue (Million) Forecast, by Application 2019 & 2032
- Table 12: United States Canned Food Market Volume (K Tons) Forecast, by Application 2019 & 2032
- Table 13: Canada Canned Food Market Revenue (Million) Forecast, by Application 2019 & 2032
- Table 14: Canada Canned Food Market Volume (K Tons) Forecast, by Application 2019 & 2032
- Table 15: Mexico Canned Food Market Revenue (Million) Forecast, by Application 2019 & 2032
- Table 16: Mexico Canned Food Market Volume (K Tons) Forecast, by Application 2019 & 2032
- Table 17: Rest of North America Canned Food Market Revenue (Million) Forecast, by Application 2019 & 2032
- Table 18: Rest of North America Canned Food Market Volume (K Tons) Forecast, by Application 2019 & 2032
- Table 19: Global Canned Food Market Revenue Million Forecast, by Country 2019 & 2032
- Table 20: Global Canned Food Market Volume K Tons Forecast, by Country 2019 & 2032
- Table 21: Spain Canned Food Market Revenue (Million) Forecast, by Application 2019 & 2032
- Table 22: Spain Canned Food Market Volume (K Tons) Forecast, by Application 2019 & 2032
- Table 23: United Kingdom Canned Food Market Revenue (Million) Forecast, by Application 2019 & 2032
- Table 24: United Kingdom Canned Food Market Volume (K Tons) Forecast, by Application 2019 & 2032
- Table 25: Germany Canned Food Market Revenue (Million) Forecast, by Application 2019 & 2032
- Table 26: Germany Canned Food Market Volume (K Tons) Forecast, by Application 2019 & 2032
- Table 27: France Canned Food Market Revenue (Million) Forecast, by Application 2019 & 2032
- Table 28: France Canned Food Market Volume (K Tons) Forecast, by Application 2019 & 2032
- Table 29: Italy Canned Food Market Revenue (Million) Forecast, by Application 2019 & 2032
- Table 30: Italy Canned Food Market Volume (K Tons) Forecast, by Application 2019 & 2032
- Table 31: Russia Canned Food Market Revenue (Million) Forecast, by Application 2019 & 2032
- Table 32: Russia Canned Food Market Volume (K Tons) Forecast, by Application 2019 & 2032
- Table 33: Rest of Europe Canned Food Market Revenue (Million) Forecast, by Application 2019 & 2032
- Table 34: Rest of Europe Canned Food Market Volume (K Tons) Forecast, by Application 2019 & 2032
- Table 35: Global Canned Food Market Revenue Million Forecast, by Country 2019 & 2032
- Table 36: Global Canned Food Market Volume K Tons Forecast, by Country 2019 & 2032
- Table 37: China Canned Food Market Revenue (Million) Forecast, by Application 2019 & 2032
- Table 38: China Canned Food Market Volume (K Tons) Forecast, by Application 2019 & 2032
- Table 39: Japan Canned Food Market Revenue (Million) Forecast, by Application 2019 & 2032
- Table 40: Japan Canned Food Market Volume (K Tons) Forecast, by Application 2019 & 2032
- Table 41: India Canned Food Market Revenue (Million) Forecast, by Application 2019 & 2032
- Table 42: India Canned Food Market Volume (K Tons) Forecast, by Application 2019 & 2032
- Table 43: Australia Canned Food Market Revenue (Million) Forecast, by Application 2019 & 2032
- Table 44: Australia Canned Food Market Volume (K Tons) Forecast, by Application 2019 & 2032
- Table 45: Rest of Asia Pacific Canned Food Market Revenue (Million) Forecast, by Application 2019 & 2032
- Table 46: Rest of Asia Pacific Canned Food Market Volume (K Tons) Forecast, by Application 2019 & 2032
- Table 47: Global Canned Food Market Revenue Million Forecast, by Country 2019 & 2032
- Table 48: Global Canned Food Market Volume K Tons Forecast, by Country 2019 & 2032
- Table 49: Brazil Canned Food Market Revenue (Million) Forecast, by Application 2019 & 2032
- Table 50: Brazil Canned Food Market Volume (K Tons) Forecast, by Application 2019 & 2032
- Table 51: Argentina Canned Food Market Revenue (Million) Forecast, by Application 2019 & 2032
- Table 52: Argentina Canned Food Market Volume (K Tons) Forecast, by Application 2019 & 2032
- Table 53: Rest of South America Canned Food Market Revenue (Million) Forecast, by Application 2019 & 2032
- Table 54: Rest of South America Canned Food Market Volume (K Tons) Forecast, by Application 2019 & 2032
- Table 55: Global Canned Food Market Revenue Million Forecast, by Country 2019 & 2032
- Table 56: Global Canned Food Market Volume K Tons Forecast, by Country 2019 & 2032
- Table 57: South Africa Canned Food Market Revenue (Million) Forecast, by Application 2019 & 2032
- Table 58: South Africa Canned Food Market Volume (K Tons) Forecast, by Application 2019 & 2032
- Table 59: Saudi Arabia Canned Food Market Revenue (Million) Forecast, by Application 2019 & 2032
- Table 60: Saudi Arabia Canned Food Market Volume (K Tons) Forecast, by Application 2019 & 2032
- Table 61: Rest of Middle East and Africa Canned Food Market Revenue (Million) Forecast, by Application 2019 & 2032
- Table 62: Rest of Middle East and Africa Canned Food Market Volume (K Tons) Forecast, by Application 2019 & 2032
- Table 63: Global Canned Food Market Revenue Million Forecast, by Type 2019 & 2032
- Table 64: Global Canned Food Market Volume K Tons Forecast, by Type 2019 & 2032
- Table 65: Global Canned Food Market Revenue Million Forecast, by Distribution Channel 2019 & 2032
- Table 66: Global Canned Food Market Volume K Tons Forecast, by Distribution Channel 2019 & 2032
- Table 67: Global Canned Food Market Revenue Million Forecast, by Country 2019 & 2032
- Table 68: Global Canned Food Market Volume K Tons Forecast, by Country 2019 & 2032
- Table 69: United States Canned Food Market Revenue (Million) Forecast, by Application 2019 & 2032
- Table 70: United States Canned Food Market Volume (K Tons) Forecast, by Application 2019 & 2032
- Table 71: Canada Canned Food Market Revenue (Million) Forecast, by Application 2019 & 2032
- Table 72: Canada Canned Food Market Volume (K Tons) Forecast, by Application 2019 & 2032
- Table 73: Mexico Canned Food Market Revenue (Million) Forecast, by Application 2019 & 2032
- Table 74: Mexico Canned Food Market Volume (K Tons) Forecast, by Application 2019 & 2032
- Table 75: Rest of North America Canned Food Market Revenue (Million) Forecast, by Application 2019 & 2032
- Table 76: Rest of North America Canned Food Market Volume (K Tons) Forecast, by Application 2019 & 2032
- Table 77: Global Canned Food Market Revenue Million Forecast, by Type 2019 & 2032
- Table 78: Global Canned Food Market Volume K Tons Forecast, by Type 2019 & 2032
- Table 79: Global Canned Food Market Revenue Million Forecast, by Distribution Channel 2019 & 2032
- Table 80: Global Canned Food Market Volume K Tons Forecast, by Distribution Channel 2019 & 2032
- Table 81: Global Canned Food Market Revenue Million Forecast, by Country 2019 & 2032
- Table 82: Global Canned Food Market Volume K Tons Forecast, by Country 2019 & 2032
- Table 83: Spain Canned Food Market Revenue (Million) Forecast, by Application 2019 & 2032
- Table 84: Spain Canned Food Market Volume (K Tons) Forecast, by Application 2019 & 2032
- Table 85: United Kingdom Canned Food Market Revenue (Million) Forecast, by Application 2019 & 2032
- Table 86: United Kingdom Canned Food Market Volume (K Tons) Forecast, by Application 2019 & 2032
- Table 87: Germany Canned Food Market Revenue (Million) Forecast, by Application 2019 & 2032
- Table 88: Germany Canned Food Market Volume (K Tons) Forecast, by Application 2019 & 2032
- Table 89: France Canned Food Market Revenue (Million) Forecast, by Application 2019 & 2032
- Table 90: France Canned Food Market Volume (K Tons) Forecast, by Application 2019 & 2032
- Table 91: Italy Canned Food Market Revenue (Million) Forecast, by Application 2019 & 2032
- Table 92: Italy Canned Food Market Volume (K Tons) Forecast, by Application 2019 & 2032
- Table 93: Netherlands Canned Food Market Revenue (Million) Forecast, by Application 2019 & 2032
- Table 94: Netherlands Canned Food Market Volume (K Tons) Forecast, by Application 2019 & 2032
- Table 95: Rest of Europe Canned Food Market Revenue (Million) Forecast, by Application 2019 & 2032
- Table 96: Rest of Europe Canned Food Market Volume (K Tons) Forecast, by Application 2019 & 2032
- Table 97: Global Canned Food Market Revenue Million Forecast, by Type 2019 & 2032
- Table 98: Global Canned Food Market Volume K Tons Forecast, by Type 2019 & 2032
- Table 99: Global Canned Food Market Revenue Million Forecast, by Distribution Channel 2019 & 2032
- Table 100: Global Canned Food Market Volume K Tons Forecast, by Distribution Channel 2019 & 2032
- Table 101: Global Canned Food Market Revenue Million Forecast, by Country 2019 & 2032
- Table 102: Global Canned Food Market Volume K Tons Forecast, by Country 2019 & 2032
- Table 103: China Canned Food Market Revenue (Million) Forecast, by Application 2019 & 2032
- Table 104: China Canned Food Market Volume (K Tons) Forecast, by Application 2019 & 2032
- Table 105: Japan Canned Food Market Revenue (Million) Forecast, by Application 2019 & 2032
- Table 106: Japan Canned Food Market Volume (K Tons) Forecast, by Application 2019 & 2032
- Table 107: India Canned Food Market Revenue (Million) Forecast, by Application 2019 & 2032
- Table 108: India Canned Food Market Volume (K Tons) Forecast, by Application 2019 & 2032
- Table 109: Australia Canned Food Market Revenue (Million) Forecast, by Application 2019 & 2032
- Table 110: Australia Canned Food Market Volume (K Tons) Forecast, by Application 2019 & 2032
- Table 111: Rest of Asia Pacific Canned Food Market Revenue (Million) Forecast, by Application 2019 & 2032
- Table 112: Rest of Asia Pacific Canned Food Market Volume (K Tons) Forecast, by Application 2019 & 2032
- Table 113: Global Canned Food Market Revenue Million Forecast, by Type 2019 & 2032
- Table 114: Global Canned Food Market Volume K Tons Forecast, by Type 2019 & 2032
- Table 115: Global Canned Food Market Revenue Million Forecast, by Distribution Channel 2019 & 2032
- Table 116: Global Canned Food Market Volume K Tons Forecast, by Distribution Channel 2019 & 2032
- Table 117: Global Canned Food Market Revenue Million Forecast, by Country 2019 & 2032
- Table 118: Global Canned Food Market Volume K Tons Forecast, by Country 2019 & 2032
- Table 119: Brazil Canned Food Market Revenue (Million) Forecast, by Application 2019 & 2032
- Table 120: Brazil Canned Food Market Volume (K Tons) Forecast, by Application 2019 & 2032
- Table 121: Argentina Canned Food Market Revenue (Million) Forecast, by Application 2019 & 2032
- Table 122: Argentina Canned Food Market Volume (K Tons) Forecast, by Application 2019 & 2032
- Table 123: Rest of South America Canned Food Market Revenue (Million) Forecast, by Application 2019 & 2032
- Table 124: Rest of South America Canned Food Market Volume (K Tons) Forecast, by Application 2019 & 2032
- Table 125: Global Canned Food Market Revenue Million Forecast, by Type 2019 & 2032
- Table 126: Global Canned Food Market Volume K Tons Forecast, by Type 2019 & 2032
- Table 127: Global Canned Food Market Revenue Million Forecast, by Distribution Channel 2019 & 2032
- Table 128: Global Canned Food Market Volume K Tons Forecast, by Distribution Channel 2019 & 2032
- Table 129: Global Canned Food Market Revenue Million Forecast, by Country 2019 & 2032
- Table 130: Global Canned Food Market Volume K Tons Forecast, by Country 2019 & 2032
- Table 131: South Africa Canned Food Market Revenue (Million) Forecast, by Application 2019 & 2032
- Table 132: South Africa Canned Food Market Volume (K Tons) Forecast, by Application 2019 & 2032
- Table 133: Saudi Arabia Canned Food Market Revenue (Million) Forecast, by Application 2019 & 2032
- Table 134: Saudi Arabia Canned Food Market Volume (K Tons) Forecast, by Application 2019 & 2032
- Table 135: Rest of Middle East and Africa Canned Food Market Revenue (Million) Forecast, by Application 2019 & 2032
- Table 136: Rest of Middle East and Africa Canned Food Market Volume (K Tons) Forecast, by Application 2019 & 2032
Frequently Asked Questions
1. What is the projected Compound Annual Growth Rate (CAGR) of the Canned Food Market?
The projected CAGR is approximately 4.05%.
2. Which companies are prominent players in the Canned Food Market?
Key companies in the market include Del Monte Pacific Limited, The Bolton Group, Conagra Brands Inc, Campbell Soup Company, Century Pacific Food Inc, Thai Union Group PCL, Dole Holding Company LLC, JBS S A (SAMPCO), Bonduelle SA, Kraft Heinz Company.
3. What are the main segments of the Canned Food Market?
The market segments include Type, Distribution Channel.
4. Can you provide details about the market size?
The market size is estimated to be USD 89.03 Million as of 2022.
5. What are some drivers contributing to market growth?
Increasing urbanization and globalization contribute to changing dietary habits and a greater demand for convenient food options.
6. What are the notable trends driving market growth?
Increasing variety of canned foods including gourmet and premium options.
7. Are there any restraints impacting market growth?
Shelf Life Limitations and Changing Consumer Preferences.
8. Can you provide examples of recent developments in the market?
In October 2022, Campbell Soup Company's Chunky Soup launched four new flavors named Spicy Chicken Noodle, Spicy Steak n' Potato, Spicy Sirloin Burger, and Spicy Chicken and Sausage Gumbo.
9. What pricing options are available for accessing the report?
Pricing options include single-user, multi-user, and enterprise licenses priced at USD 4750, USD 5250, and USD 8750 respectively.
10. Is the market size provided in terms of value or volume?
The market size is provided in terms of value, measured in Million and volume, measured in K Tons.
11. Are there any specific market keywords associated with the report?
Yes, the market keyword associated with the report is "Canned Food Market," which aids in identifying and referencing the specific market segment covered.
12. How do I determine which pricing option suits my needs best?
The pricing options vary based on user requirements and access needs. Individual users may opt for single-user licenses, while businesses requiring broader access may choose multi-user or enterprise licenses for cost-effective access to the report.
13. Are there any additional resources or data provided in the Canned Food Market report?
While the report offers comprehensive insights, it's advisable to review the specific contents or supplementary materials provided to ascertain if additional resources or data are available.
14. How can I stay updated on further developments or reports in the Canned Food Market?
To stay informed about further developments, trends, and reports in the Canned Food Market, consider subscribing to industry newsletters, following relevant companies and organizations, or regularly checking reputable industry news sources and publications.
Methodology
Step 1 - Identification of Relevant Samples Size from Population Database


Step 2 - Approaches for Defining Global Market Size (Value, Volume* & Price*)

Note*: In applicable scenarios
Step 3 - Data Sources
Primary Research
- Web Analytics
- Survey Reports
- Research Institute
- Latest Research Reports
- Opinion Leaders
Secondary Research
- Annual Reports
- White Paper
- Latest Press Release
- Industry Association
- Paid Database
- Investor Presentations

Step 4 - Data Triangulation
Involves using different sources of information in order to increase the validity of a study
These sources are likely to be stakeholders in a program - participants, other researchers, program staff, other community members, and so on.
Then we put all data in single framework & apply various statistical tools to find out the dynamic on the market.
During the analysis stage, feedback from the stakeholder groups would be compared to determine areas of agreement as well as areas of divergence


