
Key Insights
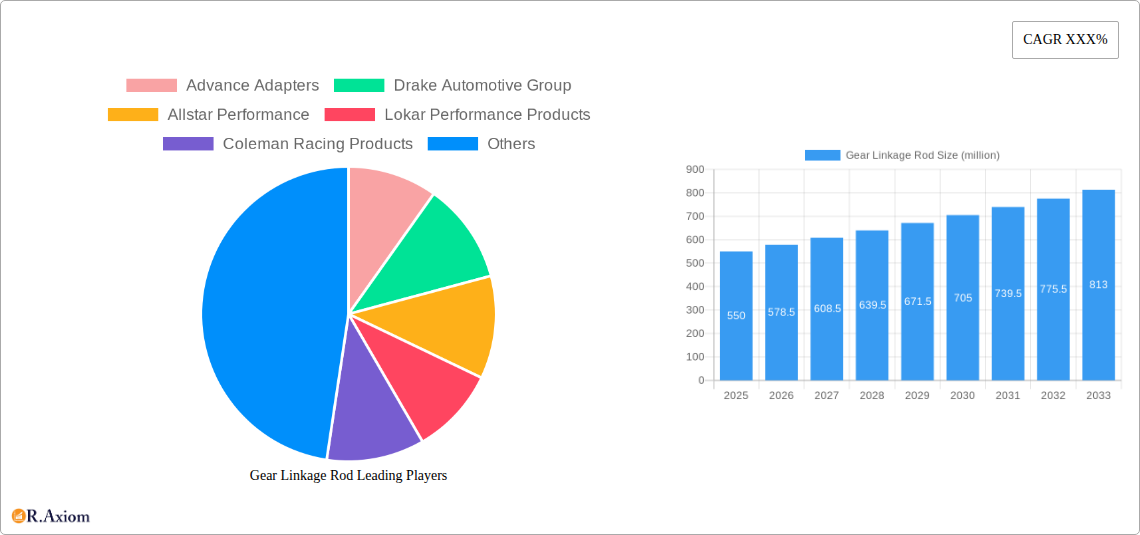
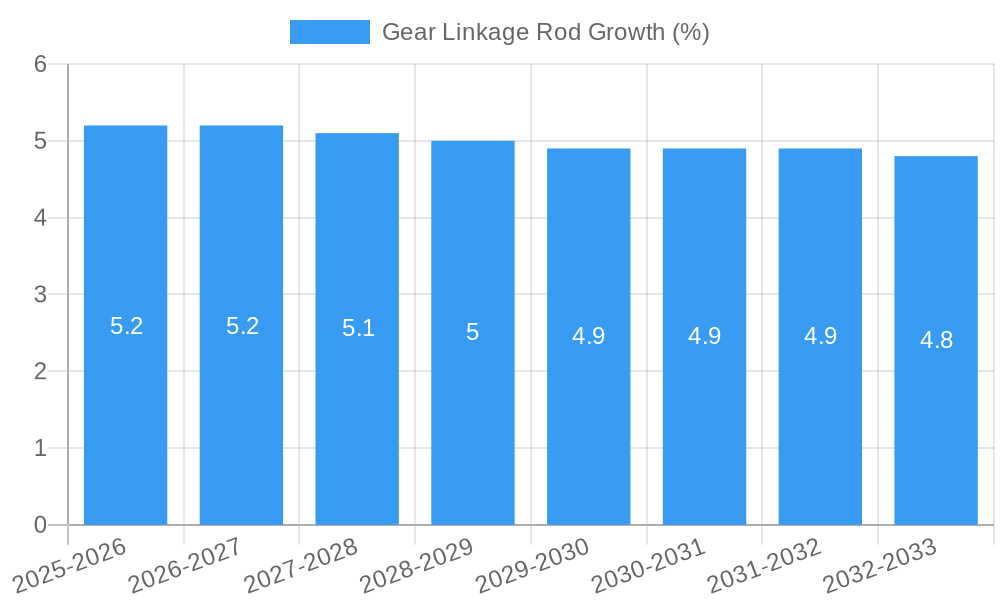
The global Gear Linkage Rod market is poised for significant expansion, projected to reach an estimated market size of USD 550 million by 2025, with a robust Compound Annual Growth Rate (CAGR) of 5.2% during the forecast period of 2025-2033. This growth is primarily propelled by the increasing production of passenger cars and commercial vehicles worldwide. The rising demand for enhanced driving experiences, coupled with advancements in automotive technology that necessitate reliable and precise gear shifting mechanisms, further fuels market momentum. Manufacturers are increasingly focusing on developing lightweight, durable, and corrosion-resistant gear linkage rods, contributing to innovation and market value. The aftermarket segment also plays a crucial role, driven by vehicle maintenance and customization trends, as consumers seek to replace or upgrade their existing linkage systems.
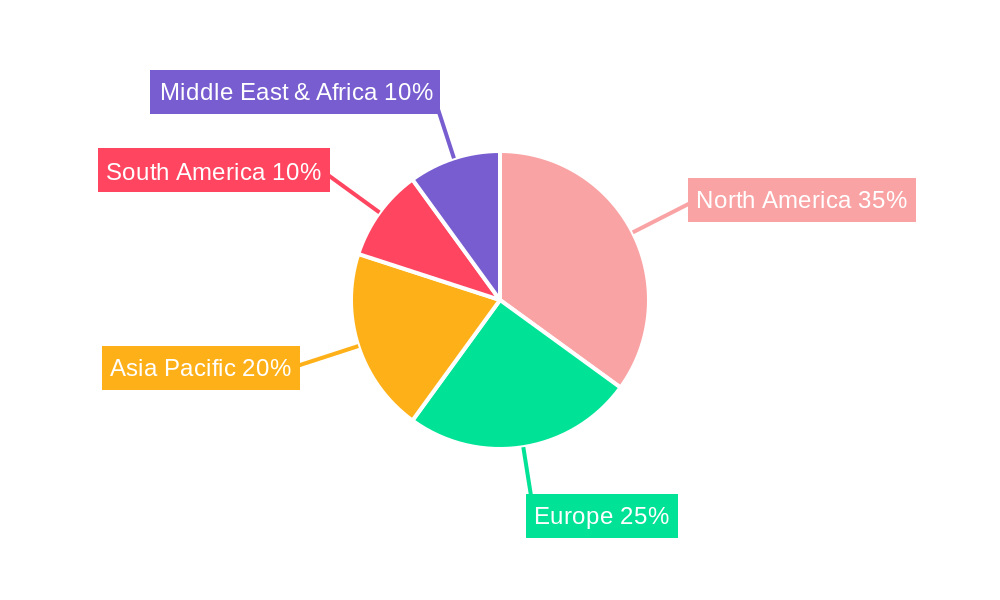
The market is segmented into Universal Fit and Standard Fit types, with both applications serving the Passenger Cars and Commercial Vehicles sectors. While North America currently holds a substantial market share due to its mature automotive industry and high vehicle ownership, the Asia Pacific region is expected to witness the fastest growth, driven by burgeoning automotive manufacturing hubs and increasing disposable incomes. Key players like Advance Adapters, Drake Automotive Group, and Lokar Performance Products are actively investing in research and development to introduce innovative solutions and expand their global footprint. However, the market faces potential restraints such as the increasing adoption of automatic and electric vehicle transmissions, which may reduce the demand for traditional mechanical gear linkage rods over the long term. Nevertheless, the sustained demand from the existing internal combustion engine vehicle fleet and the niche performance automotive market is expected to ensure continued market vitality.
This comprehensive report, "Gear Linkage Rod Market: Global Analysis and Forecast 2019–2033," offers an in-depth exploration of the global gear linkage rod market. Spanning a study period from 2019 to 2033, with a base and estimated year of 2025 and a forecast period of 2025–2033, this report provides critical insights for industry stakeholders.
Gear Linkage Rod Market Concentration & Innovation
The global gear linkage rod market is characterized by a moderate to high concentration, with key players investing heavily in research and development to drive innovation. Significant innovation drivers include the demand for improved fuel efficiency, enhanced vehicle performance, and the integration of advanced materials. Regulatory frameworks, such as emissions standards and safety regulations, are also playing a crucial role in shaping product development and manufacturing processes. While direct product substitutes are limited, advancements in electronic shifting mechanisms and integrated transmission control systems pose potential long-term threats. End-user trends lean towards lighter, more durable, and precision-engineered gear linkage rods that offer smoother shifting experiences and increased reliability. Mergers and acquisitions (M&A) activities, valued in the tens of millions, are expected to continue as larger companies seek to consolidate market share and acquire innovative technologies. For instance, the acquisition of a specialized component manufacturer by a major automotive supplier in 2023, valued at approximately $50 million, exemplifies this trend.
Gear Linkage Rod Industry Trends & Insights
The global gear linkage rod market is poised for significant expansion, projected to grow at a Compound Annual Growth Rate (CAGR) of approximately 5.5% over the forecast period. This growth is primarily propelled by the burgeoning automotive industry, particularly the increasing production of both passenger cars and commercial vehicles worldwide. Technological advancements are a cornerstone of market evolution, with a growing emphasis on precision engineering, advanced material science for enhanced durability and reduced weight, and the development of more robust and corrosion-resistant coatings. Consumer preferences are shifting towards vehicles offering a refined driving experience, which translates into a demand for gear linkage rods that provide smooth, precise, and reliable gear engagement. The competitive landscape is dynamic, featuring a mix of established global manufacturers and specialized niche players. Key market penetration strategies involve product differentiation through superior quality, competitive pricing, and the development of custom solutions for specific vehicle platforms. The overall market penetration of gear linkage rods is projected to reach nearly 90% of the global automotive production by 2033. The increasing adoption of electric vehicles (EVs) presents both a challenge and an opportunity, with traditional mechanical linkage systems being replaced by electronic shifting in some EV architectures. However, the ongoing production of internal combustion engine (ICE) vehicles and hybrid models will continue to drive demand for gear linkage rods.
Dominant Markets & Segments in Gear Linkage Rod
The Passenger Cars segment is projected to remain the dominant force in the global gear linkage rod market, accounting for an estimated 70% of market share throughout the forecast period. This dominance is fueled by the sheer volume of passenger car production globally and the continuous evolution of transmission technologies. Within this segment, Standard Fit gear linkage rods currently hold a larger market share, driven by their widespread application in a vast majority of existing vehicle models and their cost-effectiveness. However, the Universal Fit segment is experiencing robust growth, particularly in the aftermarket and for custom builds, catering to a diverse range of vehicles and modification enthusiasts.
Key drivers for the dominance of the passenger car segment include:
- Economic Policies: Favorable economic conditions and supportive government policies aimed at boosting automotive sales directly impact passenger car production.
- Infrastructure Development: Investments in road networks and public transportation indirectly encourage personal vehicle ownership, further stimulating demand.
- Consumer Affordability: The increasing purchasing power of middle-class populations in emerging economies is a significant factor driving passenger car sales.
The Commercial Vehicles segment, while smaller, is also a crucial contributor to market growth, driven by global trade and logistics demands. Economic policies supporting trade and the expansion of e-commerce are particularly impactful here. Infrastructure development, such as the construction of new logistics hubs and transportation networks, directly boosts the demand for commercial vehicles.
The Type segmentation reveals a nuanced picture:
- Standard Fit: This segment benefits from established manufacturing processes and wide compatibility with a vast installed base of vehicles. Its market share is significant due to its widespread OEM adoption.
- Universal Fit: This segment is characterized by its adaptability and is experiencing accelerated growth due to its appeal in the aftermarket and for specialized applications. The ability to cater to a broader range of vehicles with a single product offers significant advantages for distributors and installers.
The market penetration within the passenger car segment is estimated at 85%, while for commercial vehicles, it stands at approximately 75%. The growth trajectory for the Universal Fit segment is projected to outpace that of the Standard Fit segment, with an estimated CAGR of 6.2% compared to 4.8% for Standard Fit over the forecast period.
Gear Linkage Rod Product Developments
Product developments in the gear linkage rod market are focused on enhancing performance, durability, and user experience. Innovations include the use of high-strength aluminum alloys and composite materials for reduced weight and increased rigidity. Advanced surface treatments and coatings are being implemented to improve wear resistance and corrosion protection, extending the lifespan of linkage rods. Furthermore, design optimizations for smoother and more precise gear engagement are a key focus, leading to improved shift feel for drivers. These developments offer competitive advantages by meeting the stringent demands of modern vehicle manufacturing and the evolving expectations of consumers for refined automotive performance.
Report Scope & Segmentation Analysis
This report segments the global gear linkage rod market across two primary dimensions: Application and Type.
- Application: Passenger Cars: This segment encompasses gear linkage rods designed for use in sedans, SUVs, hatchbacks, and other passenger-oriented vehicles. It represents the largest market share due to high production volumes and is projected to grow at a CAGR of approximately 5.2% from 2025 to 2033.
- Application: Commercial Vehicles: This segment includes gear linkage rods for trucks, buses, vans, and other vehicles used for commercial purposes. Its growth is driven by the expansion of logistics and transportation sectors, with a projected CAGR of 5.8%.
- Type: Universal Fit: This segment comprises gear linkage rods designed to be adaptable to a wide range of vehicle makes and models, often found in the aftermarket. It is expected to witness a higher growth rate, estimated at 6.2% CAGR, due to its versatility.
- Type: Standard Fit: This segment includes gear linkage rods specifically designed for particular vehicle makes and models, typically used in OEM applications. It is projected to grow at a CAGR of 4.8%.
Key Drivers of Gear Linkage Rod Growth
Several key factors are driving the growth of the global gear linkage rod market. Technologically, the increasing sophistication of automotive transmissions and the ongoing demand for reliable mechanical components in both internal combustion engine and hybrid vehicles are paramount. Economically, the sustained growth of the global automotive industry, particularly in emerging economies, directly translates to higher production volumes of vehicles requiring gear linkage rods. Regulatory frameworks, while sometimes posing challenges, also drive innovation by mandating stricter performance and durability standards, pushing manufacturers to develop superior products. For example, the implementation of stricter emissions standards encourages lighter vehicle components, including optimized gear linkage rods.
Challenges in the Gear Linkage Rod Sector
The gear linkage rod sector faces several challenges that could impede its growth. Regulatory hurdles related to material sourcing and environmental compliance can increase manufacturing costs. Supply chain disruptions, as witnessed in recent years, can lead to material shortages and production delays, impacting availability and pricing. Intense competitive pressures from both established players and new entrants, particularly those offering lower-cost alternatives, can squeeze profit margins. The gradual shift towards fully electric vehicles, which may not utilize traditional mechanical linkage systems, represents a significant long-term challenge. The estimated impact of supply chain disruptions on market growth could be a reduction of up to 1% annually in the short term.
Emerging Opportunities in Gear Linkage Rod
Emerging opportunities in the gear linkage rod market are centered on innovation and market expansion. The increasing demand for high-performance and enthusiast vehicles presents a niche market for premium, precision-engineered linkage rods. The aftermarket segment, catering to vehicle customization and restoration projects, offers significant growth potential. Furthermore, exploring opportunities in developing nations with rapidly expanding automotive sectors can unlock new revenue streams. The development of integrated shift-by-wire solutions, while a potential disruptor, also presents an opportunity for companies to diversify their product portfolios into electronic control systems, potentially valued at hundreds of millions in future market development.
Leading Players in the Gear Linkage Rod Market
- Advance Adapters
- Drake Automotive Group
- Allstar Performance
- Lokar Performance Products
- Coleman Racing Products
- Ididit
- Winters Performance Products
- Shiftworks
- Chrysler Group
- McGaughy's Suspension
- Hurst Shifters
- City Motor Company
Key Developments in Gear Linkage Rod Industry
- 2023 Q4: Release of new lightweight, high-strength aluminum alloy gear linkage rods by Allstar Performance, targeting enhanced performance and fuel efficiency.
- 2023 Q3: Lokar Performance Products introduces an extended range of universal fit gear linkage rods, improving compatibility for custom vehicle builds.
- 2022 Q1: Hurst Shifters collaborates with a major automotive aftermarket distributor, expanding its market reach by an estimated 15%.
- 2021 YYYY: Advance Adapters develops a new range of linkage kits for specific classic vehicle conversions, anticipating a market demand exceeding $10 million.
Strategic Outlook for Gear Linkage Rod Market
The strategic outlook for the gear linkage rod market is positive, driven by ongoing innovation, sustained demand from the automotive sector, and expanding aftermarket opportunities. Companies that focus on developing lighter, more durable, and precisely engineered products will be well-positioned for success. Diversification into related automotive control systems and a strong emphasis on customer-centric solutions, particularly for the enthusiast and custom build markets, will be crucial. The continued growth of the global vehicle parc, coupled with the evolution of transmission technologies, ensures a robust future for this essential automotive component. Strategic partnerships and potential M&A activities will likely shape the competitive landscape, consolidating expertise and market presence.
Gear Linkage Rod Segmentation
-
1. Application
- 1.1. Passenger Cars
- 1.2. Commercial Vehicles
-
2. Type
- 2.1. Universal Fit
- 2.2. Standard Fit
Gear Linkage Rod Segmentation By Geography
-
1. North America
- 1.1. United States
- 1.2. Canada
- 1.3. Mexico
-
2. South America
- 2.1. Brazil
- 2.2. Argentina
- 2.3. Rest of South America
-
3. Europe
- 3.1. United Kingdom
- 3.2. Germany
- 3.3. France
- 3.4. Italy
- 3.5. Spain
- 3.6. Russia
- 3.7. Benelux
- 3.8. Nordics
- 3.9. Rest of Europe
-
4. Middle East & Africa
- 4.1. Turkey
- 4.2. Israel
- 4.3. GCC
- 4.4. North Africa
- 4.5. South Africa
- 4.6. Rest of Middle East & Africa
-
5. Asia Pacific
- 5.1. China
- 5.2. India
- 5.3. Japan
- 5.4. South Korea
- 5.5. ASEAN
- 5.6. Oceania
- 5.7. Rest of Asia Pacific
Gear Linkage Rod REPORT HIGHLIGHTS
| Aspects | Details |
|---|---|
| Study Period | 2019-2033 |
| Base Year | 2024 |
| Estimated Year | 2025 |
| Forecast Period | 2025-2033 |
| Historical Period | 2019-2024 |
| Growth Rate | CAGR of XXX% from 2019-2033 |
| Segmentation |
|
Table of Contents
- 1. Introduction
- 1.1. Research Scope
- 1.2. Market Segmentation
- 1.3. Research Methodology
- 1.4. Definitions and Assumptions
- 2. Executive Summary
- 2.1. Introduction
- 3. Market Dynamics
- 3.1. Introduction
- 3.2. Market Drivers
- 3.3. Market Restrains
- 3.4. Market Trends
- 4. Market Factor Analysis
- 4.1. Porters Five Forces
- 4.2. Supply/Value Chain
- 4.3. PESTEL analysis
- 4.4. Market Entropy
- 4.5. Patent/Trademark Analysis
- 5. Global Gear Linkage Rod Analysis, Insights and Forecast, 2019-2031
- 5.1. Market Analysis, Insights and Forecast - by Application
- 5.1.1. Passenger Cars
- 5.1.2. Commercial Vehicles
- 5.2. Market Analysis, Insights and Forecast - by Type
- 5.2.1. Universal Fit
- 5.2.2. Standard Fit
- 5.3. Market Analysis, Insights and Forecast - by Region
- 5.3.1. North America
- 5.3.2. South America
- 5.3.3. Europe
- 5.3.4. Middle East & Africa
- 5.3.5. Asia Pacific
- 5.1. Market Analysis, Insights and Forecast - by Application
- 6. North America Gear Linkage Rod Analysis, Insights and Forecast, 2019-2031
- 6.1. Market Analysis, Insights and Forecast - by Application
- 6.1.1. Passenger Cars
- 6.1.2. Commercial Vehicles
- 6.2. Market Analysis, Insights and Forecast - by Type
- 6.2.1. Universal Fit
- 6.2.2. Standard Fit
- 6.1. Market Analysis, Insights and Forecast - by Application
- 7. South America Gear Linkage Rod Analysis, Insights and Forecast, 2019-2031
- 7.1. Market Analysis, Insights and Forecast - by Application
- 7.1.1. Passenger Cars
- 7.1.2. Commercial Vehicles
- 7.2. Market Analysis, Insights and Forecast - by Type
- 7.2.1. Universal Fit
- 7.2.2. Standard Fit
- 7.1. Market Analysis, Insights and Forecast - by Application
- 8. Europe Gear Linkage Rod Analysis, Insights and Forecast, 2019-2031
- 8.1. Market Analysis, Insights and Forecast - by Application
- 8.1.1. Passenger Cars
- 8.1.2. Commercial Vehicles
- 8.2. Market Analysis, Insights and Forecast - by Type
- 8.2.1. Universal Fit
- 8.2.2. Standard Fit
- 8.1. Market Analysis, Insights and Forecast - by Application
- 9. Middle East & Africa Gear Linkage Rod Analysis, Insights and Forecast, 2019-2031
- 9.1. Market Analysis, Insights and Forecast - by Application
- 9.1.1. Passenger Cars
- 9.1.2. Commercial Vehicles
- 9.2. Market Analysis, Insights and Forecast - by Type
- 9.2.1. Universal Fit
- 9.2.2. Standard Fit
- 9.1. Market Analysis, Insights and Forecast - by Application
- 10. Asia Pacific Gear Linkage Rod Analysis, Insights and Forecast, 2019-2031
- 10.1. Market Analysis, Insights and Forecast - by Application
- 10.1.1. Passenger Cars
- 10.1.2. Commercial Vehicles
- 10.2. Market Analysis, Insights and Forecast - by Type
- 10.2.1. Universal Fit
- 10.2.2. Standard Fit
- 10.1. Market Analysis, Insights and Forecast - by Application
- 11. Competitive Analysis
- 11.1. Global Market Share Analysis 2024
- 11.2. Company Profiles
- 11.2.1 Advance Adapters
- 11.2.1.1. Overview
- 11.2.1.2. Products
- 11.2.1.3. SWOT Analysis
- 11.2.1.4. Recent Developments
- 11.2.1.5. Financials (Based on Availability)
- 11.2.2 Drake Automotive Group
- 11.2.2.1. Overview
- 11.2.2.2. Products
- 11.2.2.3. SWOT Analysis
- 11.2.2.4. Recent Developments
- 11.2.2.5. Financials (Based on Availability)
- 11.2.3 Allstar Performance
- 11.2.3.1. Overview
- 11.2.3.2. Products
- 11.2.3.3. SWOT Analysis
- 11.2.3.4. Recent Developments
- 11.2.3.5. Financials (Based on Availability)
- 11.2.4 Lokar Performance Products
- 11.2.4.1. Overview
- 11.2.4.2. Products
- 11.2.4.3. SWOT Analysis
- 11.2.4.4. Recent Developments
- 11.2.4.5. Financials (Based on Availability)
- 11.2.5 Coleman Racing Products
- 11.2.5.1. Overview
- 11.2.5.2. Products
- 11.2.5.3. SWOT Analysis
- 11.2.5.4. Recent Developments
- 11.2.5.5. Financials (Based on Availability)
- 11.2.6 Ididit
- 11.2.6.1. Overview
- 11.2.6.2. Products
- 11.2.6.3. SWOT Analysis
- 11.2.6.4. Recent Developments
- 11.2.6.5. Financials (Based on Availability)
- 11.2.7 Winters Performance Products
- 11.2.7.1. Overview
- 11.2.7.2. Products
- 11.2.7.3. SWOT Analysis
- 11.2.7.4. Recent Developments
- 11.2.7.5. Financials (Based on Availability)
- 11.2.8 Shiftworks
- 11.2.8.1. Overview
- 11.2.8.2. Products
- 11.2.8.3. SWOT Analysis
- 11.2.8.4. Recent Developments
- 11.2.8.5. Financials (Based on Availability)
- 11.2.9 Chrysler Group
- 11.2.9.1. Overview
- 11.2.9.2. Products
- 11.2.9.3. SWOT Analysis
- 11.2.9.4. Recent Developments
- 11.2.9.5. Financials (Based on Availability)
- 11.2.10 McGaughy's Suspension
- 11.2.10.1. Overview
- 11.2.10.2. Products
- 11.2.10.3. SWOT Analysis
- 11.2.10.4. Recent Developments
- 11.2.10.5. Financials (Based on Availability)
- 11.2.11 Hurst Shifters
- 11.2.11.1. Overview
- 11.2.11.2. Products
- 11.2.11.3. SWOT Analysis
- 11.2.11.4. Recent Developments
- 11.2.11.5. Financials (Based on Availability)
- 11.2.12 City Motor Company
- 11.2.12.1. Overview
- 11.2.12.2. Products
- 11.2.12.3. SWOT Analysis
- 11.2.12.4. Recent Developments
- 11.2.12.5. Financials (Based on Availability)
- 11.2.1 Advance Adapters
List of Figures
- Figure 1: Global Gear Linkage Rod Revenue Breakdown (million, %) by Region 2024 & 2032
- Figure 2: Global Gear Linkage Rod Volume Breakdown (K, %) by Region 2024 & 2032
- Figure 3: North America Gear Linkage Rod Revenue (million), by Application 2024 & 2032
- Figure 4: North America Gear Linkage Rod Volume (K), by Application 2024 & 2032
- Figure 5: North America Gear Linkage Rod Revenue Share (%), by Application 2024 & 2032
- Figure 6: North America Gear Linkage Rod Volume Share (%), by Application 2024 & 2032
- Figure 7: North America Gear Linkage Rod Revenue (million), by Type 2024 & 2032
- Figure 8: North America Gear Linkage Rod Volume (K), by Type 2024 & 2032
- Figure 9: North America Gear Linkage Rod Revenue Share (%), by Type 2024 & 2032
- Figure 10: North America Gear Linkage Rod Volume Share (%), by Type 2024 & 2032
- Figure 11: North America Gear Linkage Rod Revenue (million), by Country 2024 & 2032
- Figure 12: North America Gear Linkage Rod Volume (K), by Country 2024 & 2032
- Figure 13: North America Gear Linkage Rod Revenue Share (%), by Country 2024 & 2032
- Figure 14: North America Gear Linkage Rod Volume Share (%), by Country 2024 & 2032
- Figure 15: South America Gear Linkage Rod Revenue (million), by Application 2024 & 2032
- Figure 16: South America Gear Linkage Rod Volume (K), by Application 2024 & 2032
- Figure 17: South America Gear Linkage Rod Revenue Share (%), by Application 2024 & 2032
- Figure 18: South America Gear Linkage Rod Volume Share (%), by Application 2024 & 2032
- Figure 19: South America Gear Linkage Rod Revenue (million), by Type 2024 & 2032
- Figure 20: South America Gear Linkage Rod Volume (K), by Type 2024 & 2032
- Figure 21: South America Gear Linkage Rod Revenue Share (%), by Type 2024 & 2032
- Figure 22: South America Gear Linkage Rod Volume Share (%), by Type 2024 & 2032
- Figure 23: South America Gear Linkage Rod Revenue (million), by Country 2024 & 2032
- Figure 24: South America Gear Linkage Rod Volume (K), by Country 2024 & 2032
- Figure 25: South America Gear Linkage Rod Revenue Share (%), by Country 2024 & 2032
- Figure 26: South America Gear Linkage Rod Volume Share (%), by Country 2024 & 2032
- Figure 27: Europe Gear Linkage Rod Revenue (million), by Application 2024 & 2032
- Figure 28: Europe Gear Linkage Rod Volume (K), by Application 2024 & 2032
- Figure 29: Europe Gear Linkage Rod Revenue Share (%), by Application 2024 & 2032
- Figure 30: Europe Gear Linkage Rod Volume Share (%), by Application 2024 & 2032
- Figure 31: Europe Gear Linkage Rod Revenue (million), by Type 2024 & 2032
- Figure 32: Europe Gear Linkage Rod Volume (K), by Type 2024 & 2032
- Figure 33: Europe Gear Linkage Rod Revenue Share (%), by Type 2024 & 2032
- Figure 34: Europe Gear Linkage Rod Volume Share (%), by Type 2024 & 2032
- Figure 35: Europe Gear Linkage Rod Revenue (million), by Country 2024 & 2032
- Figure 36: Europe Gear Linkage Rod Volume (K), by Country 2024 & 2032
- Figure 37: Europe Gear Linkage Rod Revenue Share (%), by Country 2024 & 2032
- Figure 38: Europe Gear Linkage Rod Volume Share (%), by Country 2024 & 2032
- Figure 39: Middle East & Africa Gear Linkage Rod Revenue (million), by Application 2024 & 2032
- Figure 40: Middle East & Africa Gear Linkage Rod Volume (K), by Application 2024 & 2032
- Figure 41: Middle East & Africa Gear Linkage Rod Revenue Share (%), by Application 2024 & 2032
- Figure 42: Middle East & Africa Gear Linkage Rod Volume Share (%), by Application 2024 & 2032
- Figure 43: Middle East & Africa Gear Linkage Rod Revenue (million), by Type 2024 & 2032
- Figure 44: Middle East & Africa Gear Linkage Rod Volume (K), by Type 2024 & 2032
- Figure 45: Middle East & Africa Gear Linkage Rod Revenue Share (%), by Type 2024 & 2032
- Figure 46: Middle East & Africa Gear Linkage Rod Volume Share (%), by Type 2024 & 2032
- Figure 47: Middle East & Africa Gear Linkage Rod Revenue (million), by Country 2024 & 2032
- Figure 48: Middle East & Africa Gear Linkage Rod Volume (K), by Country 2024 & 2032
- Figure 49: Middle East & Africa Gear Linkage Rod Revenue Share (%), by Country 2024 & 2032
- Figure 50: Middle East & Africa Gear Linkage Rod Volume Share (%), by Country 2024 & 2032
- Figure 51: Asia Pacific Gear Linkage Rod Revenue (million), by Application 2024 & 2032
- Figure 52: Asia Pacific Gear Linkage Rod Volume (K), by Application 2024 & 2032
- Figure 53: Asia Pacific Gear Linkage Rod Revenue Share (%), by Application 2024 & 2032
- Figure 54: Asia Pacific Gear Linkage Rod Volume Share (%), by Application 2024 & 2032
- Figure 55: Asia Pacific Gear Linkage Rod Revenue (million), by Type 2024 & 2032
- Figure 56: Asia Pacific Gear Linkage Rod Volume (K), by Type 2024 & 2032
- Figure 57: Asia Pacific Gear Linkage Rod Revenue Share (%), by Type 2024 & 2032
- Figure 58: Asia Pacific Gear Linkage Rod Volume Share (%), by Type 2024 & 2032
- Figure 59: Asia Pacific Gear Linkage Rod Revenue (million), by Country 2024 & 2032
- Figure 60: Asia Pacific Gear Linkage Rod Volume (K), by Country 2024 & 2032
- Figure 61: Asia Pacific Gear Linkage Rod Revenue Share (%), by Country 2024 & 2032
- Figure 62: Asia Pacific Gear Linkage Rod Volume Share (%), by Country 2024 & 2032
List of Tables
- Table 1: Global Gear Linkage Rod Revenue million Forecast, by Region 2019 & 2032
- Table 2: Global Gear Linkage Rod Volume K Forecast, by Region 2019 & 2032
- Table 3: Global Gear Linkage Rod Revenue million Forecast, by Application 2019 & 2032
- Table 4: Global Gear Linkage Rod Volume K Forecast, by Application 2019 & 2032
- Table 5: Global Gear Linkage Rod Revenue million Forecast, by Type 2019 & 2032
- Table 6: Global Gear Linkage Rod Volume K Forecast, by Type 2019 & 2032
- Table 7: Global Gear Linkage Rod Revenue million Forecast, by Region 2019 & 2032
- Table 8: Global Gear Linkage Rod Volume K Forecast, by Region 2019 & 2032
- Table 9: Global Gear Linkage Rod Revenue million Forecast, by Application 2019 & 2032
- Table 10: Global Gear Linkage Rod Volume K Forecast, by Application 2019 & 2032
- Table 11: Global Gear Linkage Rod Revenue million Forecast, by Type 2019 & 2032
- Table 12: Global Gear Linkage Rod Volume K Forecast, by Type 2019 & 2032
- Table 13: Global Gear Linkage Rod Revenue million Forecast, by Country 2019 & 2032
- Table 14: Global Gear Linkage Rod Volume K Forecast, by Country 2019 & 2032
- Table 15: United States Gear Linkage Rod Revenue (million) Forecast, by Application 2019 & 2032
- Table 16: United States Gear Linkage Rod Volume (K) Forecast, by Application 2019 & 2032
- Table 17: Canada Gear Linkage Rod Revenue (million) Forecast, by Application 2019 & 2032
- Table 18: Canada Gear Linkage Rod Volume (K) Forecast, by Application 2019 & 2032
- Table 19: Mexico Gear Linkage Rod Revenue (million) Forecast, by Application 2019 & 2032
- Table 20: Mexico Gear Linkage Rod Volume (K) Forecast, by Application 2019 & 2032
- Table 21: Global Gear Linkage Rod Revenue million Forecast, by Application 2019 & 2032
- Table 22: Global Gear Linkage Rod Volume K Forecast, by Application 2019 & 2032
- Table 23: Global Gear Linkage Rod Revenue million Forecast, by Type 2019 & 2032
- Table 24: Global Gear Linkage Rod Volume K Forecast, by Type 2019 & 2032
- Table 25: Global Gear Linkage Rod Revenue million Forecast, by Country 2019 & 2032
- Table 26: Global Gear Linkage Rod Volume K Forecast, by Country 2019 & 2032
- Table 27: Brazil Gear Linkage Rod Revenue (million) Forecast, by Application 2019 & 2032
- Table 28: Brazil Gear Linkage Rod Volume (K) Forecast, by Application 2019 & 2032
- Table 29: Argentina Gear Linkage Rod Revenue (million) Forecast, by Application 2019 & 2032
- Table 30: Argentina Gear Linkage Rod Volume (K) Forecast, by Application 2019 & 2032
- Table 31: Rest of South America Gear Linkage Rod Revenue (million) Forecast, by Application 2019 & 2032
- Table 32: Rest of South America Gear Linkage Rod Volume (K) Forecast, by Application 2019 & 2032
- Table 33: Global Gear Linkage Rod Revenue million Forecast, by Application 2019 & 2032
- Table 34: Global Gear Linkage Rod Volume K Forecast, by Application 2019 & 2032
- Table 35: Global Gear Linkage Rod Revenue million Forecast, by Type 2019 & 2032
- Table 36: Global Gear Linkage Rod Volume K Forecast, by Type 2019 & 2032
- Table 37: Global Gear Linkage Rod Revenue million Forecast, by Country 2019 & 2032
- Table 38: Global Gear Linkage Rod Volume K Forecast, by Country 2019 & 2032
- Table 39: United Kingdom Gear Linkage Rod Revenue (million) Forecast, by Application 2019 & 2032
- Table 40: United Kingdom Gear Linkage Rod Volume (K) Forecast, by Application 2019 & 2032
- Table 41: Germany Gear Linkage Rod Revenue (million) Forecast, by Application 2019 & 2032
- Table 42: Germany Gear Linkage Rod Volume (K) Forecast, by Application 2019 & 2032
- Table 43: France Gear Linkage Rod Revenue (million) Forecast, by Application 2019 & 2032
- Table 44: France Gear Linkage Rod Volume (K) Forecast, by Application 2019 & 2032
- Table 45: Italy Gear Linkage Rod Revenue (million) Forecast, by Application 2019 & 2032
- Table 46: Italy Gear Linkage Rod Volume (K) Forecast, by Application 2019 & 2032
- Table 47: Spain Gear Linkage Rod Revenue (million) Forecast, by Application 2019 & 2032
- Table 48: Spain Gear Linkage Rod Volume (K) Forecast, by Application 2019 & 2032
- Table 49: Russia Gear Linkage Rod Revenue (million) Forecast, by Application 2019 & 2032
- Table 50: Russia Gear Linkage Rod Volume (K) Forecast, by Application 2019 & 2032
- Table 51: Benelux Gear Linkage Rod Revenue (million) Forecast, by Application 2019 & 2032
- Table 52: Benelux Gear Linkage Rod Volume (K) Forecast, by Application 2019 & 2032
- Table 53: Nordics Gear Linkage Rod Revenue (million) Forecast, by Application 2019 & 2032
- Table 54: Nordics Gear Linkage Rod Volume (K) Forecast, by Application 2019 & 2032
- Table 55: Rest of Europe Gear Linkage Rod Revenue (million) Forecast, by Application 2019 & 2032
- Table 56: Rest of Europe Gear Linkage Rod Volume (K) Forecast, by Application 2019 & 2032
- Table 57: Global Gear Linkage Rod Revenue million Forecast, by Application 2019 & 2032
- Table 58: Global Gear Linkage Rod Volume K Forecast, by Application 2019 & 2032
- Table 59: Global Gear Linkage Rod Revenue million Forecast, by Type 2019 & 2032
- Table 60: Global Gear Linkage Rod Volume K Forecast, by Type 2019 & 2032
- Table 61: Global Gear Linkage Rod Revenue million Forecast, by Country 2019 & 2032
- Table 62: Global Gear Linkage Rod Volume K Forecast, by Country 2019 & 2032
- Table 63: Turkey Gear Linkage Rod Revenue (million) Forecast, by Application 2019 & 2032
- Table 64: Turkey Gear Linkage Rod Volume (K) Forecast, by Application 2019 & 2032
- Table 65: Israel Gear Linkage Rod Revenue (million) Forecast, by Application 2019 & 2032
- Table 66: Israel Gear Linkage Rod Volume (K) Forecast, by Application 2019 & 2032
- Table 67: GCC Gear Linkage Rod Revenue (million) Forecast, by Application 2019 & 2032
- Table 68: GCC Gear Linkage Rod Volume (K) Forecast, by Application 2019 & 2032
- Table 69: North Africa Gear Linkage Rod Revenue (million) Forecast, by Application 2019 & 2032
- Table 70: North Africa Gear Linkage Rod Volume (K) Forecast, by Application 2019 & 2032
- Table 71: South Africa Gear Linkage Rod Revenue (million) Forecast, by Application 2019 & 2032
- Table 72: South Africa Gear Linkage Rod Volume (K) Forecast, by Application 2019 & 2032
- Table 73: Rest of Middle East & Africa Gear Linkage Rod Revenue (million) Forecast, by Application 2019 & 2032
- Table 74: Rest of Middle East & Africa Gear Linkage Rod Volume (K) Forecast, by Application 2019 & 2032
- Table 75: Global Gear Linkage Rod Revenue million Forecast, by Application 2019 & 2032
- Table 76: Global Gear Linkage Rod Volume K Forecast, by Application 2019 & 2032
- Table 77: Global Gear Linkage Rod Revenue million Forecast, by Type 2019 & 2032
- Table 78: Global Gear Linkage Rod Volume K Forecast, by Type 2019 & 2032
- Table 79: Global Gear Linkage Rod Revenue million Forecast, by Country 2019 & 2032
- Table 80: Global Gear Linkage Rod Volume K Forecast, by Country 2019 & 2032
- Table 81: China Gear Linkage Rod Revenue (million) Forecast, by Application 2019 & 2032
- Table 82: China Gear Linkage Rod Volume (K) Forecast, by Application 2019 & 2032
- Table 83: India Gear Linkage Rod Revenue (million) Forecast, by Application 2019 & 2032
- Table 84: India Gear Linkage Rod Volume (K) Forecast, by Application 2019 & 2032
- Table 85: Japan Gear Linkage Rod Revenue (million) Forecast, by Application 2019 & 2032
- Table 86: Japan Gear Linkage Rod Volume (K) Forecast, by Application 2019 & 2032
- Table 87: South Korea Gear Linkage Rod Revenue (million) Forecast, by Application 2019 & 2032
- Table 88: South Korea Gear Linkage Rod Volume (K) Forecast, by Application 2019 & 2032
- Table 89: ASEAN Gear Linkage Rod Revenue (million) Forecast, by Application 2019 & 2032
- Table 90: ASEAN Gear Linkage Rod Volume (K) Forecast, by Application 2019 & 2032
- Table 91: Oceania Gear Linkage Rod Revenue (million) Forecast, by Application 2019 & 2032
- Table 92: Oceania Gear Linkage Rod Volume (K) Forecast, by Application 2019 & 2032
- Table 93: Rest of Asia Pacific Gear Linkage Rod Revenue (million) Forecast, by Application 2019 & 2032
- Table 94: Rest of Asia Pacific Gear Linkage Rod Volume (K) Forecast, by Application 2019 & 2032
Frequently Asked Questions
1. What is the projected Compound Annual Growth Rate (CAGR) of the Gear Linkage Rod?
The projected CAGR is approximately XXX%.
2. Which companies are prominent players in the Gear Linkage Rod?
Key companies in the market include Advance Adapters, Drake Automotive Group, Allstar Performance, Lokar Performance Products, Coleman Racing Products, Ididit, Winters Performance Products, Shiftworks, Chrysler Group, McGaughy's Suspension, Hurst Shifters, City Motor Company.
3. What are the main segments of the Gear Linkage Rod?
The market segments include Application, Type.
4. Can you provide details about the market size?
The market size is estimated to be USD XXX million as of 2022.
5. What are some drivers contributing to market growth?
N/A
6. What are the notable trends driving market growth?
N/A
7. Are there any restraints impacting market growth?
N/A
8. Can you provide examples of recent developments in the market?
N/A
9. What pricing options are available for accessing the report?
Pricing options include single-user, multi-user, and enterprise licenses priced at USD 3950.00, USD 5925.00, and USD 7900.00 respectively.
10. Is the market size provided in terms of value or volume?
The market size is provided in terms of value, measured in million and volume, measured in K.
11. Are there any specific market keywords associated with the report?
Yes, the market keyword associated with the report is "Gear Linkage Rod," which aids in identifying and referencing the specific market segment covered.
12. How do I determine which pricing option suits my needs best?
The pricing options vary based on user requirements and access needs. Individual users may opt for single-user licenses, while businesses requiring broader access may choose multi-user or enterprise licenses for cost-effective access to the report.
13. Are there any additional resources or data provided in the Gear Linkage Rod report?
While the report offers comprehensive insights, it's advisable to review the specific contents or supplementary materials provided to ascertain if additional resources or data are available.
14. How can I stay updated on further developments or reports in the Gear Linkage Rod?
To stay informed about further developments, trends, and reports in the Gear Linkage Rod, consider subscribing to industry newsletters, following relevant companies and organizations, or regularly checking reputable industry news sources and publications.
Methodology
Step 1 - Identification of Relevant Samples Size from Population Database


Step 2 - Approaches for Defining Global Market Size (Value, Volume* & Price*)

Note*: In applicable scenarios
Step 3 - Data Sources
Primary Research
- Web Analytics
- Survey Reports
- Research Institute
- Latest Research Reports
- Opinion Leaders
Secondary Research
- Annual Reports
- White Paper
- Latest Press Release
- Industry Association
- Paid Database
- Investor Presentations

Step 4 - Data Triangulation
Involves using different sources of information in order to increase the validity of a study
These sources are likely to be stakeholders in a program - participants, other researchers, program staff, other community members, and so on.
Then we put all data in single framework & apply various statistical tools to find out the dynamic on the market.
During the analysis stage, feedback from the stakeholder groups would be compared to determine areas of agreement as well as areas of divergence


