
Key Insights
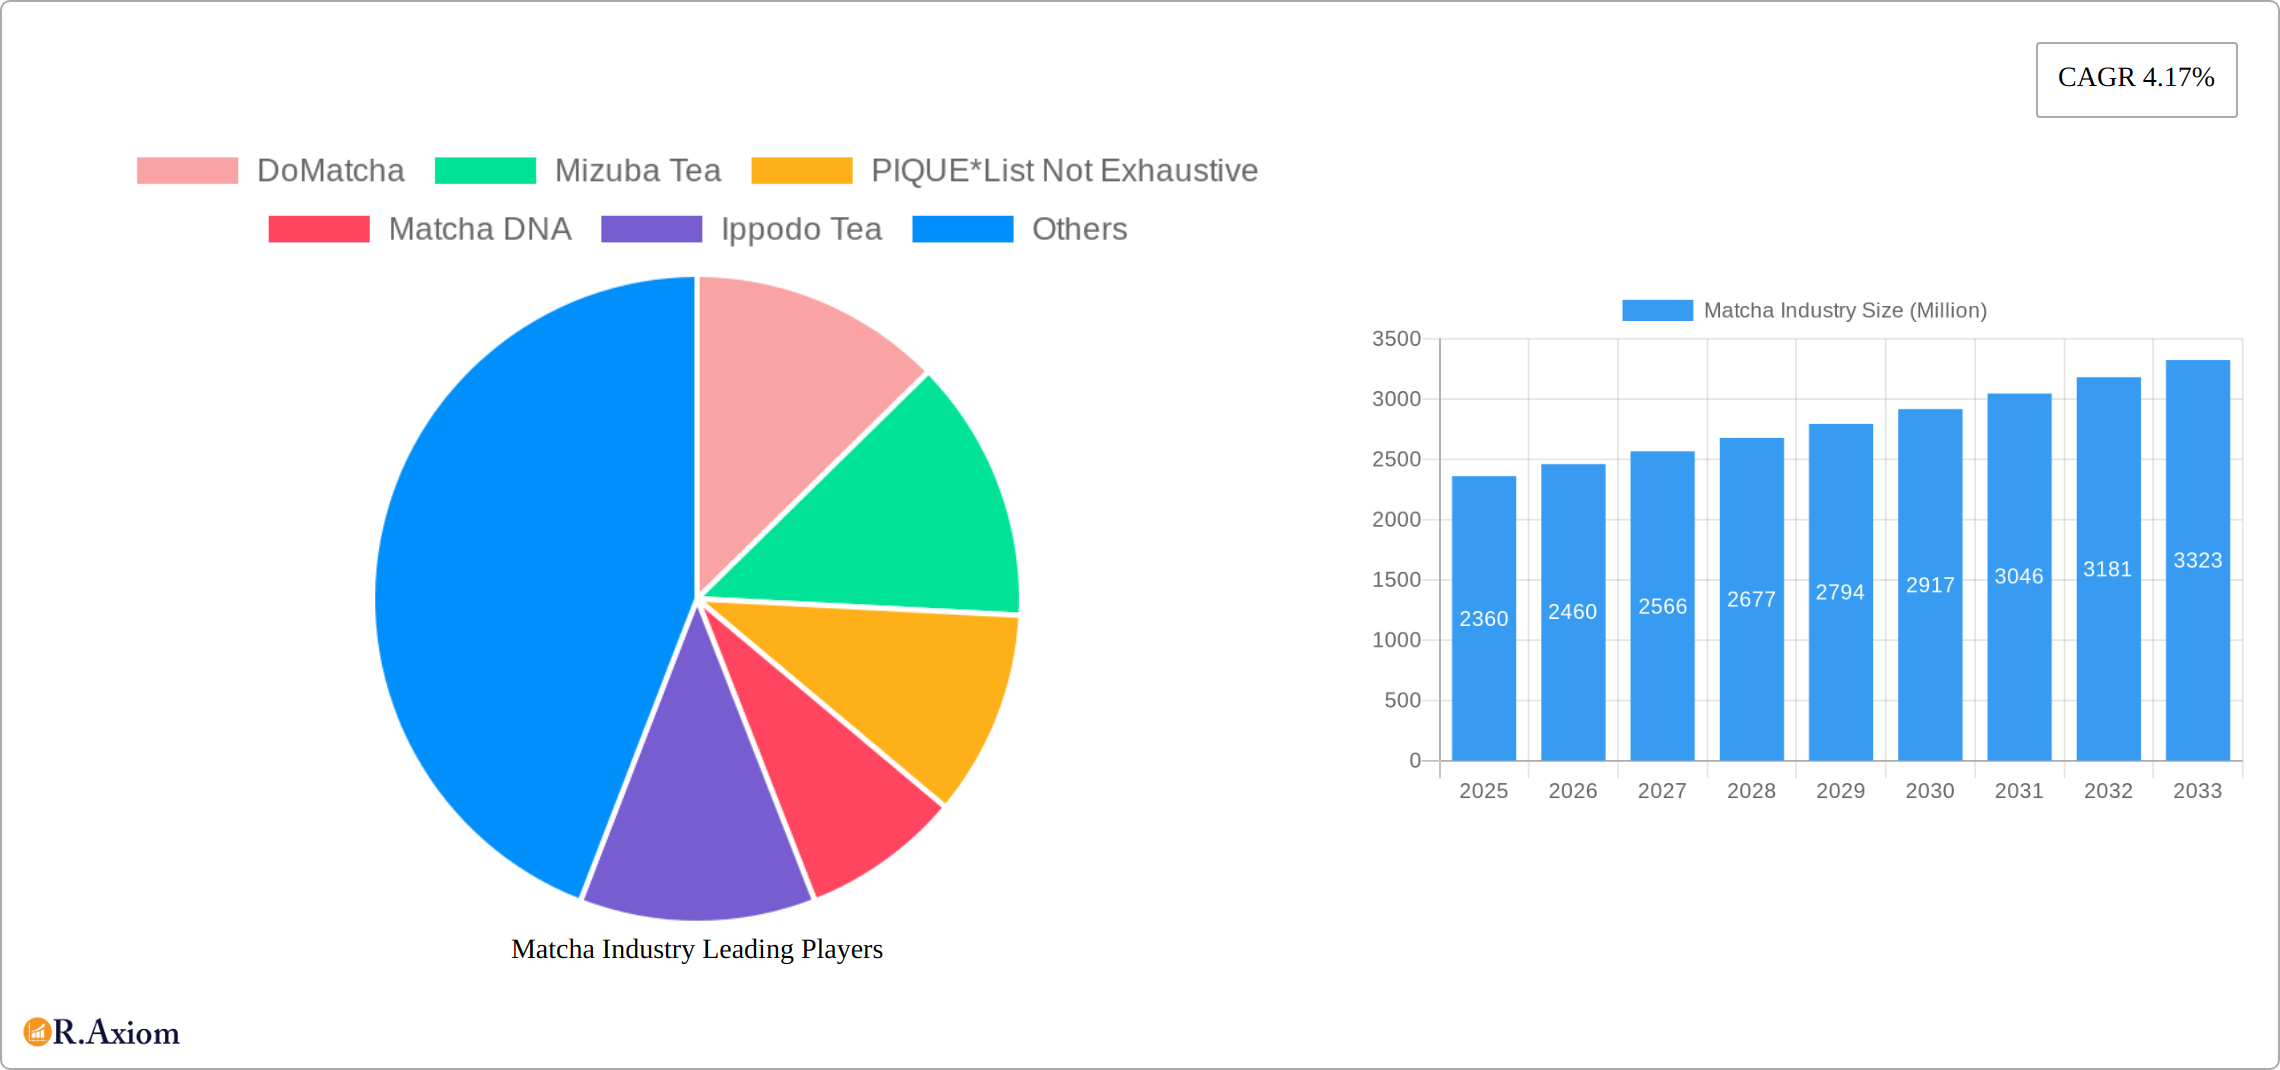
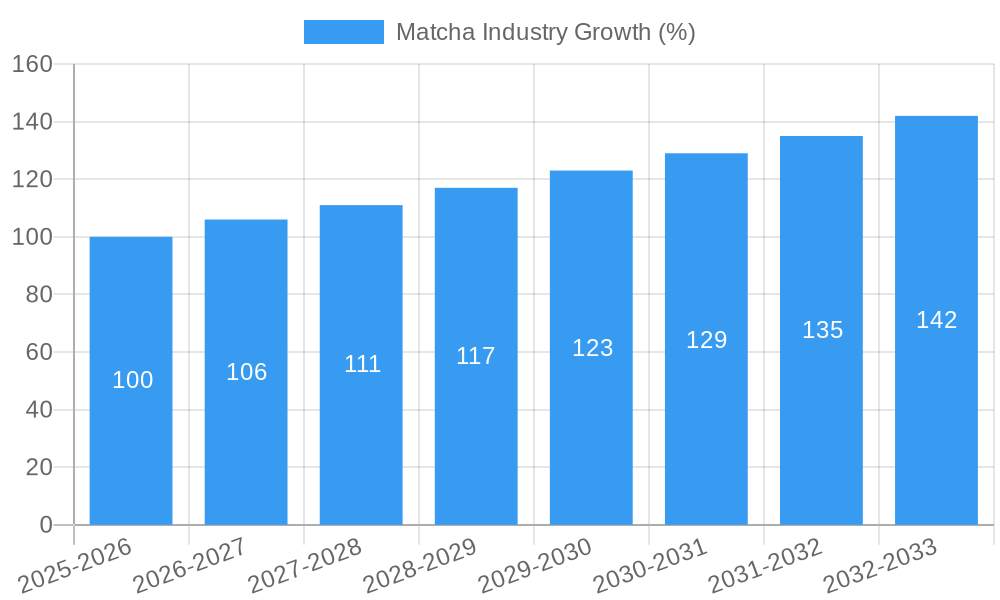
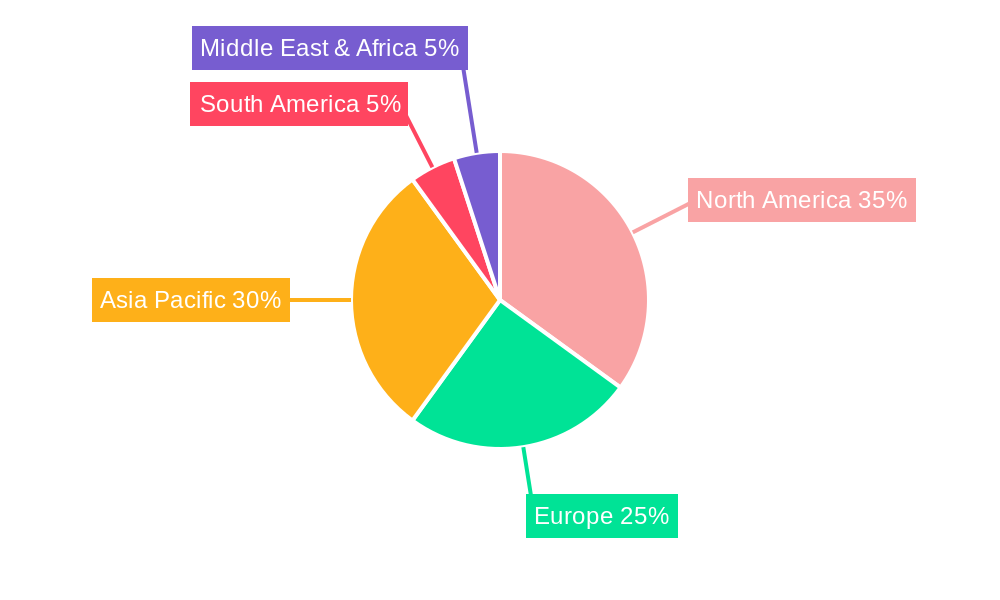
The global matcha market, valued at $2.36 billion in 2025, is projected to experience robust growth, driven by increasing consumer awareness of matcha's health benefits and its versatility in various food and beverage applications. The market's Compound Annual Growth Rate (CAGR) of 4.17% from 2019 to 2024 indicates a steady upward trajectory, expected to continue through 2033. Key drivers include the rising popularity of matcha lattes, smoothies, and desserts, alongside its integration into health and wellness products like supplements and skincare. Growing consumer demand for functional foods and beverages, coupled with the expanding presence of matcha in mainstream retail channels like supermarkets and online stores, further fuels market expansion. While potential supply chain challenges and price fluctuations in matcha production could act as restraints, the ongoing innovation in product formats (powder, liquid concentrates) and flavors caters to evolving consumer preferences, mitigating these risks. The significant market share held by North America and Asia Pacific reflects established consumer bases and strong cultural ties to matcha consumption, while Europe and other regions present significant growth opportunities. Segmentation by product type (regular, flavored) and distribution channel highlights the diverse market landscape, offering opportunities for specialized products and tailored marketing strategies.
The market's future growth hinges on effective marketing highlighting matcha's unique qualities – its rich flavor profile, health benefits (antioxidants, vitamins), and sustainability aspects. Continued innovation in product development, including ready-to-drink matcha beverages and convenient formats, will be critical in attracting new consumers. Expansion into emerging markets and leveraging e-commerce platforms for broader reach will also play a crucial role in driving market expansion. Companies like DoMatcha, Mizuba Tea, and others are well-positioned to capitalize on these trends through strategic product development, targeted marketing, and robust supply chain management. The ongoing focus on product quality, ethical sourcing, and sustainability will be essential for maintaining the long-term growth and appeal of the matcha market.
This comprehensive report provides a detailed analysis of the Matcha industry, covering market size, segmentation, growth drivers, challenges, and key players. The study period spans from 2019 to 2033, with 2025 as the base and estimated year. The forecast period extends from 2025 to 2033, encompassing historical data from 2019 to 2024. The report is designed to provide actionable insights for industry stakeholders, investors, and businesses operating within or considering entry into the dynamic Matcha market. The global market is projected to reach xx Million by 2033.
Matcha Industry Market Concentration & Innovation
This section analyzes the level of market concentration within the Matcha industry, identifying key players and their respective market shares. The report also delves into the innovation drivers shaping the sector, including technological advancements, consumer preferences, and regulatory changes. Furthermore, it explores the impact of mergers and acquisitions (M&A) activities on market dynamics, presenting an overview of recent deals and their estimated values. The competitive landscape is examined, considering factors such as product differentiation, pricing strategies, and brand recognition. Substitute products and their potential impact on market growth are also assessed. Finally, end-user trends, including the increasing adoption of Matcha in diverse applications, are explored, providing a holistic perspective on the industry's current state and future outlook.
- Market Concentration: The Matcha market exhibits a moderately concentrated structure with several key players holding significant market shares. Precise figures for market share are not available currently and will be presented in the full report. Analysis will include the Herfindahl-Hirschman Index (HHI) to quantify concentration levels.
- Innovation Drivers: Key innovation drivers include the development of new product formats (e.g., ready-to-drink Matcha), the exploration of novel flavor profiles, and advancements in sustainable and ethical sourcing practices. R&D efforts focusing on functional benefits of Matcha are also contributing to innovation.
- Regulatory Frameworks: The report will assess the impact of regulations related to food safety, labeling, and ingredient sourcing on the Matcha industry. Variations in regulations across different regions will be considered.
- Product Substitutes: The analysis will cover potential substitutes for Matcha, such as other green teas or caffeine-based beverages, evaluating their impact on market demand.
- M&A Activities: Recent M&A activity will be detailed, with a focus on deal values and strategic implications for market consolidation. For example, the xx Million Aiya Matcha acquisition of a majority stake in OMGTea will be examined in detail.
Matcha Industry Industry Trends & Insights
This section provides an in-depth analysis of the current trends and insights shaping the Matcha industry. It will examine the factors driving market growth, including changing consumer preferences towards healthy beverages, rising health consciousness, and increasing awareness of Matcha's nutritional benefits. The report will also explore technological disruptions, such as advancements in processing and packaging technologies, which are impacting production efficiency and product quality. Furthermore, the competitive dynamics within the market, including pricing strategies, product differentiation, and marketing initiatives, will be analyzed. Key metrics, such as the Compound Annual Growth Rate (CAGR) and market penetration rates, will be presented to illustrate the industry's growth trajectory. The impact of global economic conditions and shifts in consumer purchasing patterns will also be considered. A detailed competitive analysis will showcase the strategies employed by leading players to maintain market share and expand their presence. The evolution of consumer preferences and their impact on product innovation and diversification will be examined.
- CAGR (2025-2033): xx% (This is a projected value and will be refined in the full report).
- Market Penetration: xx% (This is a projected value and will be refined in the full report).
Dominant Markets & Segments in Matcha Industry
This section identifies the dominant regions, countries, and market segments within the Matcha industry. The analysis will consider segmentations by product type (Regular, Flavored), form (Powder, Liquid), and distribution channel (Hypermarket/Supermarket, Specialty Stores, Online Retail Stores, Others). Key drivers of market dominance in each segment will be explored, encompassing factors such as economic policies, infrastructure development, consumer preferences, and cultural factors. The report will provide a comprehensive analysis of the factors contributing to the leading positions of specific regions, countries, or segments.
- Leading Region: [Region to be determined based on data analysis. This will include analysis on consumption patterns, market size, and growth potential]
- Leading Country: [Country to be determined based on data analysis]
- Dominant Product Type: [Analysis to determine whether Regular or Flavored matcha holds greater market share]
- Dominant Form: [Analysis to determine whether Powder or Liquid matcha holds greater market share]
- Dominant Distribution Channel: [Analysis to determine which distribution channel has the greatest market share]
Key Drivers (Examples):
- Economic Policies: Government support for the agricultural sector and food processing industries.
- Infrastructure: Efficient transportation and logistics networks for distribution.
- Consumer Preferences: Increasing demand for healthy and functional beverages.
Matcha Industry Product Developments
This section details key product innovations, applications, and competitive advantages within the dynamic Matcha industry. We'll explore technological advancements shaping product development and analyze how new offerings meet evolving consumer preferences. The analysis encompasses incremental improvements to established products and the launch of entirely new product categories. A crucial element is examining the competitive advantages derived from product differentiation, focusing on taste profiles, quality assurance, convenience factors, and substantiated health benefits. The critical role of innovation in fostering sustained market growth and securing a competitive edge will be highlighted, including case studies of successful product launches and their market impact. We'll also analyze the pricing strategies employed by leading brands to maintain profitability while remaining competitive. Finally, we will examine the use of packaging innovations, such as airtight containers or single-serving sachets, to extend shelf life and enhance consumer experience.
Report Scope & Segmentation Analysis
This report provides a detailed segmentation analysis of the Matcha market across various parameters.
Product Type: The market is segmented into Regular Matcha and Flavored Matcha. Growth projections and market sizes will be provided for each segment, along with analysis of competitive dynamics.
Form: The market is segmented by form: Powder Matcha and Liquid Matcha. Growth projections, market sizes, and competitive landscape analysis will be detailed for each segment.
Distribution Channel: The report examines the market segmented by distribution channels: Hypermarket/Supermarket, Specialty Stores, Online Retail Stores, and Others. Growth projections and market size will be provided for each channel along with analysis of competitive dynamics.
Each segment will have growth projections, market sizes for the forecast period (2025-2033) and a detailed competitive analysis.
Key Drivers of Matcha Industry Growth
The Matcha industry's robust growth is fueled by several interconnected factors. The burgeoning awareness of Matcha's exceptional health benefits, including its potent antioxidant properties and potential cognitive enhancement, is a primary driver. This is amplified by the rising consumer preference for natural and functional foods and beverages, directly increasing Matcha demand. Technological advancements in Matcha cultivation, processing, and packaging significantly enhance production efficiency and product quality, contributing to greater supply and affordability. Government initiatives supporting the agricultural sector and favorable trade policies create a supportive environment for market expansion. The surge in Matcha's popularity across diverse applications—from traditional beverages to innovative culinary creations and even cosmetics—further stimulates market growth. We will provide statistical data illustrating the growth trajectory and forecast future market trends.
Challenges in the Matcha Industry Sector
Despite its growth, the Matcha industry confronts several significant challenges. Price volatility in raw materials, particularly high-quality Matcha leaves, directly impacts profitability and necessitates effective risk management strategies. Supply chain disruptions, often exacerbated by global events, can lead to production delays and shortages, impacting market stability. Maintaining consistent Matcha quality and authenticity is paramount; stringent quality control measures are crucial to preserve brand reputation and consumer trust. Intense competition among established brands and new entrants exerts constant pressure on pricing and profit margins, requiring strategic differentiation. Meeting the growing consumer demand for sustainably and ethically sourced Matcha necessitates substantial investments in responsible sourcing practices and transparent supply chains. Furthermore, navigating the complex landscape of food safety regulations and labeling requirements across diverse international markets presents ongoing challenges. The report will quantify these challenges wherever possible, providing data-driven insights into their impact on the market.
Emerging Opportunities in Matcha Industry
The Matcha industry presents several promising opportunities for expansion and innovation. Penetration into new, high-growth markets, especially in regions with increasing health consciousness, offers significant potential. The development of innovative Matcha-based products, such as functional foods and beverages tailored to address specific health needs (e.g., energy boosts, immune support), can create entirely new market segments. Strategic collaborations and partnerships with complementary brands offer avenues to expand product applications and reach broader consumer bases. Adopting sustainable and ethical sourcing practices not only enhances brand reputation but also attracts environmentally conscious consumers, a growing market segment. Continuous technological advancements in processing and packaging drive efficiency improvements, enhance product quality, and extend shelf life, providing crucial competitive advantages.
Leading Players in the Matcha Industry Market
- DoMatcha
- Mizuba Tea
- PIQUE
- Matcha DNA
- Ippodo Tea
- AIYA America Inc
- AOI Tea
- Breakaway Matcha LLC
- Matcha Maiden
- Midori Spring
Key Developments in Matcha Industry Industry
December 2023: Matcha Direct, owned by Tsuji Riichi Honten Co., Ltd., launched Decaf Matcha in its online shop. This development caters to the growing demand for caffeine-free options and expands the product portfolio.
February 2024: Ippodo Tea launched Premium Select Matcha, a limited blend of high-class matcha. The product is ready to drink with an umami and sweet taste. This showcases a move towards premiumization and convenience.
February 2024: Aiya Matcha acquired a majority stake in OMGTea to bring matcha to the masses. This collaboration aimed to expand and build a more extensive presence in the United Kingdom. This signifies a significant strategic move aimed at market expansion and increased market share.
Strategic Outlook for Matcha Industry Market
The Matcha industry is poised for continued growth, driven by increasing consumer awareness of its health benefits and the development of innovative products. Expanding into new markets and product categories will create significant opportunities for existing and new players. Focusing on sustainable and ethical sourcing practices will be essential to maintain brand reputation and cater to the evolving consumer preferences. Technological advancements in processing and packaging will continue to improve efficiency and product quality. Strategic partnerships and collaborations will be crucial for driving market expansion and achieving competitive advantage. The industry’s future prospects appear positive, with substantial potential for further growth in the coming years.
Matcha Industry Segmentation
-
1. Product Type
- 1.1. Regular
- 1.2. Flavored
-
2. Form
- 2.1. Powder
- 2.2. Liquid
-
3. Distribution Channel
- 3.1. Hypermarket/Supermarket
- 3.2. Speciality Stores
- 3.3. Online Retail Stores
- 3.4. Others
Matcha Industry Segmentation By Geography
-
1. North America
- 1.1. United States
- 1.2. Canada
- 1.3. Mexico
- 1.4. Rest of North America
-
2. Europe
- 2.1. United Kingdom
- 2.2. Germany
- 2.3. Spain
- 2.4. France
- 2.5. Italy
- 2.6. Russia
- 2.7. Rest of Europe
-
3. Asia Pacific
- 3.1. China
- 3.2. Japan
- 3.3. India
- 3.4. Australia
- 3.5. Rest of Asia Pacific
-
4. South America
- 4.1. Brazil
- 4.2. Argentina
- 4.3. Rest of South America
- 5. Middle East
-
6. United Arab Emirates
- 6.1. South Africa
- 6.2. Rest of Middle East
Matcha Industry REPORT HIGHLIGHTS
| Aspects | Details |
|---|---|
| Study Period | 2019-2033 |
| Base Year | 2024 |
| Estimated Year | 2025 |
| Forecast Period | 2025-2033 |
| Historical Period | 2019-2024 |
| Growth Rate | CAGR of 4.17% from 2019-2033 |
| Segmentation |
|
Table of Contents
- 1. Introduction
- 1.1. Research Scope
- 1.2. Market Segmentation
- 1.3. Research Methodology
- 1.4. Definitions and Assumptions
- 2. Executive Summary
- 2.1. Introduction
- 3. Market Dynamics
- 3.1. Introduction
- 3.2. Market Drivers
- 3.2.1. Increasing Focus On Health and Wellness; Surge in Product Innovation
- 3.3. Market Restrains
- 3.3.1. Presence of Substitutes
- 3.4. Market Trends
- 3.4.1. Increasing Focus On Health and Wellness
- 4. Market Factor Analysis
- 4.1. Porters Five Forces
- 4.2. Supply/Value Chain
- 4.3. PESTEL analysis
- 4.4. Market Entropy
- 4.5. Patent/Trademark Analysis
- 5. Global Matcha Industry Analysis, Insights and Forecast, 2019-2031
- 5.1. Market Analysis, Insights and Forecast - by Product Type
- 5.1.1. Regular
- 5.1.2. Flavored
- 5.2. Market Analysis, Insights and Forecast - by Form
- 5.2.1. Powder
- 5.2.2. Liquid
- 5.3. Market Analysis, Insights and Forecast - by Distribution Channel
- 5.3.1. Hypermarket/Supermarket
- 5.3.2. Speciality Stores
- 5.3.3. Online Retail Stores
- 5.3.4. Others
- 5.4. Market Analysis, Insights and Forecast - by Region
- 5.4.1. North America
- 5.4.2. Europe
- 5.4.3. Asia Pacific
- 5.4.4. South America
- 5.4.5. Middle East
- 5.4.6. United Arab Emirates
- 5.1. Market Analysis, Insights and Forecast - by Product Type
- 6. North America Matcha Industry Analysis, Insights and Forecast, 2019-2031
- 6.1. Market Analysis, Insights and Forecast - by Product Type
- 6.1.1. Regular
- 6.1.2. Flavored
- 6.2. Market Analysis, Insights and Forecast - by Form
- 6.2.1. Powder
- 6.2.2. Liquid
- 6.3. Market Analysis, Insights and Forecast - by Distribution Channel
- 6.3.1. Hypermarket/Supermarket
- 6.3.2. Speciality Stores
- 6.3.3. Online Retail Stores
- 6.3.4. Others
- 6.1. Market Analysis, Insights and Forecast - by Product Type
- 7. Europe Matcha Industry Analysis, Insights and Forecast, 2019-2031
- 7.1. Market Analysis, Insights and Forecast - by Product Type
- 7.1.1. Regular
- 7.1.2. Flavored
- 7.2. Market Analysis, Insights and Forecast - by Form
- 7.2.1. Powder
- 7.2.2. Liquid
- 7.3. Market Analysis, Insights and Forecast - by Distribution Channel
- 7.3.1. Hypermarket/Supermarket
- 7.3.2. Speciality Stores
- 7.3.3. Online Retail Stores
- 7.3.4. Others
- 7.1. Market Analysis, Insights and Forecast - by Product Type
- 8. Asia Pacific Matcha Industry Analysis, Insights and Forecast, 2019-2031
- 8.1. Market Analysis, Insights and Forecast - by Product Type
- 8.1.1. Regular
- 8.1.2. Flavored
- 8.2. Market Analysis, Insights and Forecast - by Form
- 8.2.1. Powder
- 8.2.2. Liquid
- 8.3. Market Analysis, Insights and Forecast - by Distribution Channel
- 8.3.1. Hypermarket/Supermarket
- 8.3.2. Speciality Stores
- 8.3.3. Online Retail Stores
- 8.3.4. Others
- 8.1. Market Analysis, Insights and Forecast - by Product Type
- 9. South America Matcha Industry Analysis, Insights and Forecast, 2019-2031
- 9.1. Market Analysis, Insights and Forecast - by Product Type
- 9.1.1. Regular
- 9.1.2. Flavored
- 9.2. Market Analysis, Insights and Forecast - by Form
- 9.2.1. Powder
- 9.2.2. Liquid
- 9.3. Market Analysis, Insights and Forecast - by Distribution Channel
- 9.3.1. Hypermarket/Supermarket
- 9.3.2. Speciality Stores
- 9.3.3. Online Retail Stores
- 9.3.4. Others
- 9.1. Market Analysis, Insights and Forecast - by Product Type
- 10. Middle East Matcha Industry Analysis, Insights and Forecast, 2019-2031
- 10.1. Market Analysis, Insights and Forecast - by Product Type
- 10.1.1. Regular
- 10.1.2. Flavored
- 10.2. Market Analysis, Insights and Forecast - by Form
- 10.2.1. Powder
- 10.2.2. Liquid
- 10.3. Market Analysis, Insights and Forecast - by Distribution Channel
- 10.3.1. Hypermarket/Supermarket
- 10.3.2. Speciality Stores
- 10.3.3. Online Retail Stores
- 10.3.4. Others
- 10.1. Market Analysis, Insights and Forecast - by Product Type
- 11. United Arab Emirates Matcha Industry Analysis, Insights and Forecast, 2019-2031
- 11.1. Market Analysis, Insights and Forecast - by Product Type
- 11.1.1. Regular
- 11.1.2. Flavored
- 11.2. Market Analysis, Insights and Forecast - by Form
- 11.2.1. Powder
- 11.2.2. Liquid
- 11.3. Market Analysis, Insights and Forecast - by Distribution Channel
- 11.3.1. Hypermarket/Supermarket
- 11.3.2. Speciality Stores
- 11.3.3. Online Retail Stores
- 11.3.4. Others
- 11.1. Market Analysis, Insights and Forecast - by Product Type
- 12. North America Matcha Industry Analysis, Insights and Forecast, 2019-2031
- 12.1. Market Analysis, Insights and Forecast - By Country/Sub-region
- 12.1.1 United States
- 12.1.2 Canada
- 12.1.3 Mexico
- 12.1.4 Rest of North America
- 13. Europe Matcha Industry Analysis, Insights and Forecast, 2019-2031
- 13.1. Market Analysis, Insights and Forecast - By Country/Sub-region
- 13.1.1 United Kingdom
- 13.1.2 Germany
- 13.1.3 Spain
- 13.1.4 France
- 13.1.5 Italy
- 13.1.6 Russia
- 13.1.7 Rest of Europe
- 14. Asia Pacific Matcha Industry Analysis, Insights and Forecast, 2019-2031
- 14.1. Market Analysis, Insights and Forecast - By Country/Sub-region
- 14.1.1 China
- 14.1.2 Japan
- 14.1.3 India
- 14.1.4 Australia
- 14.1.5 Rest of Asia Pacific
- 15. South America Matcha Industry Analysis, Insights and Forecast, 2019-2031
- 15.1. Market Analysis, Insights and Forecast - By Country/Sub-region
- 15.1.1 Brazil
- 15.1.2 Argentina
- 15.1.3 Rest of South America
- 16. Middle East & Africa Matcha Industry Analysis, Insights and Forecast, 2019-2031
- 16.1. Market Analysis, Insights and Forecast - By Country/Sub-region
- 16.1.1 UAE
- 16.1.2 South Africa
- 16.1.3 Saudi Arabia
- 16.1.4 Rest of MEA
- 17. Competitive Analysis
- 17.1. Global Market Share Analysis 2024
- 17.2. Company Profiles
- 17.2.1 DoMatcha
- 17.2.1.1. Overview
- 17.2.1.2. Products
- 17.2.1.3. SWOT Analysis
- 17.2.1.4. Recent Developments
- 17.2.1.5. Financials (Based on Availability)
- 17.2.2 Mizuba Tea
- 17.2.2.1. Overview
- 17.2.2.2. Products
- 17.2.2.3. SWOT Analysis
- 17.2.2.4. Recent Developments
- 17.2.2.5. Financials (Based on Availability)
- 17.2.3 PIQUE*List Not Exhaustive
- 17.2.3.1. Overview
- 17.2.3.2. Products
- 17.2.3.3. SWOT Analysis
- 17.2.3.4. Recent Developments
- 17.2.3.5. Financials (Based on Availability)
- 17.2.4 Matcha DNA
- 17.2.4.1. Overview
- 17.2.4.2. Products
- 17.2.4.3. SWOT Analysis
- 17.2.4.4. Recent Developments
- 17.2.4.5. Financials (Based on Availability)
- 17.2.5 Ippodo Tea
- 17.2.5.1. Overview
- 17.2.5.2. Products
- 17.2.5.3. SWOT Analysis
- 17.2.5.4. Recent Developments
- 17.2.5.5. Financials (Based on Availability)
- 17.2.6 AIYA America Inc
- 17.2.6.1. Overview
- 17.2.6.2. Products
- 17.2.6.3. SWOT Analysis
- 17.2.6.4. Recent Developments
- 17.2.6.5. Financials (Based on Availability)
- 17.2.7 AOI Tea
- 17.2.7.1. Overview
- 17.2.7.2. Products
- 17.2.7.3. SWOT Analysis
- 17.2.7.4. Recent Developments
- 17.2.7.5. Financials (Based on Availability)
- 17.2.8 Breakaway Matcha LLC
- 17.2.8.1. Overview
- 17.2.8.2. Products
- 17.2.8.3. SWOT Analysis
- 17.2.8.4. Recent Developments
- 17.2.8.5. Financials (Based on Availability)
- 17.2.9 Matcha Maiden
- 17.2.9.1. Overview
- 17.2.9.2. Products
- 17.2.9.3. SWOT Analysis
- 17.2.9.4. Recent Developments
- 17.2.9.5. Financials (Based on Availability)
- 17.2.10 Midori Spring
- 17.2.10.1. Overview
- 17.2.10.2. Products
- 17.2.10.3. SWOT Analysis
- 17.2.10.4. Recent Developments
- 17.2.10.5. Financials (Based on Availability)
- 17.2.1 DoMatcha
List of Figures
- Figure 1: Global Matcha Industry Revenue Breakdown (Million, %) by Region 2024 & 2032
- Figure 2: North America Matcha Industry Revenue (Million), by Country 2024 & 2032
- Figure 3: North America Matcha Industry Revenue Share (%), by Country 2024 & 2032
- Figure 4: Europe Matcha Industry Revenue (Million), by Country 2024 & 2032
- Figure 5: Europe Matcha Industry Revenue Share (%), by Country 2024 & 2032
- Figure 6: Asia Pacific Matcha Industry Revenue (Million), by Country 2024 & 2032
- Figure 7: Asia Pacific Matcha Industry Revenue Share (%), by Country 2024 & 2032
- Figure 8: South America Matcha Industry Revenue (Million), by Country 2024 & 2032
- Figure 9: South America Matcha Industry Revenue Share (%), by Country 2024 & 2032
- Figure 10: Middle East & Africa Matcha Industry Revenue (Million), by Country 2024 & 2032
- Figure 11: Middle East & Africa Matcha Industry Revenue Share (%), by Country 2024 & 2032
- Figure 12: North America Matcha Industry Revenue (Million), by Product Type 2024 & 2032
- Figure 13: North America Matcha Industry Revenue Share (%), by Product Type 2024 & 2032
- Figure 14: North America Matcha Industry Revenue (Million), by Form 2024 & 2032
- Figure 15: North America Matcha Industry Revenue Share (%), by Form 2024 & 2032
- Figure 16: North America Matcha Industry Revenue (Million), by Distribution Channel 2024 & 2032
- Figure 17: North America Matcha Industry Revenue Share (%), by Distribution Channel 2024 & 2032
- Figure 18: North America Matcha Industry Revenue (Million), by Country 2024 & 2032
- Figure 19: North America Matcha Industry Revenue Share (%), by Country 2024 & 2032
- Figure 20: Europe Matcha Industry Revenue (Million), by Product Type 2024 & 2032
- Figure 21: Europe Matcha Industry Revenue Share (%), by Product Type 2024 & 2032
- Figure 22: Europe Matcha Industry Revenue (Million), by Form 2024 & 2032
- Figure 23: Europe Matcha Industry Revenue Share (%), by Form 2024 & 2032
- Figure 24: Europe Matcha Industry Revenue (Million), by Distribution Channel 2024 & 2032
- Figure 25: Europe Matcha Industry Revenue Share (%), by Distribution Channel 2024 & 2032
- Figure 26: Europe Matcha Industry Revenue (Million), by Country 2024 & 2032
- Figure 27: Europe Matcha Industry Revenue Share (%), by Country 2024 & 2032
- Figure 28: Asia Pacific Matcha Industry Revenue (Million), by Product Type 2024 & 2032
- Figure 29: Asia Pacific Matcha Industry Revenue Share (%), by Product Type 2024 & 2032
- Figure 30: Asia Pacific Matcha Industry Revenue (Million), by Form 2024 & 2032
- Figure 31: Asia Pacific Matcha Industry Revenue Share (%), by Form 2024 & 2032
- Figure 32: Asia Pacific Matcha Industry Revenue (Million), by Distribution Channel 2024 & 2032
- Figure 33: Asia Pacific Matcha Industry Revenue Share (%), by Distribution Channel 2024 & 2032
- Figure 34: Asia Pacific Matcha Industry Revenue (Million), by Country 2024 & 2032
- Figure 35: Asia Pacific Matcha Industry Revenue Share (%), by Country 2024 & 2032
- Figure 36: South America Matcha Industry Revenue (Million), by Product Type 2024 & 2032
- Figure 37: South America Matcha Industry Revenue Share (%), by Product Type 2024 & 2032
- Figure 38: South America Matcha Industry Revenue (Million), by Form 2024 & 2032
- Figure 39: South America Matcha Industry Revenue Share (%), by Form 2024 & 2032
- Figure 40: South America Matcha Industry Revenue (Million), by Distribution Channel 2024 & 2032
- Figure 41: South America Matcha Industry Revenue Share (%), by Distribution Channel 2024 & 2032
- Figure 42: South America Matcha Industry Revenue (Million), by Country 2024 & 2032
- Figure 43: South America Matcha Industry Revenue Share (%), by Country 2024 & 2032
- Figure 44: Middle East Matcha Industry Revenue (Million), by Product Type 2024 & 2032
- Figure 45: Middle East Matcha Industry Revenue Share (%), by Product Type 2024 & 2032
- Figure 46: Middle East Matcha Industry Revenue (Million), by Form 2024 & 2032
- Figure 47: Middle East Matcha Industry Revenue Share (%), by Form 2024 & 2032
- Figure 48: Middle East Matcha Industry Revenue (Million), by Distribution Channel 2024 & 2032
- Figure 49: Middle East Matcha Industry Revenue Share (%), by Distribution Channel 2024 & 2032
- Figure 50: Middle East Matcha Industry Revenue (Million), by Country 2024 & 2032
- Figure 51: Middle East Matcha Industry Revenue Share (%), by Country 2024 & 2032
- Figure 52: United Arab Emirates Matcha Industry Revenue (Million), by Product Type 2024 & 2032
- Figure 53: United Arab Emirates Matcha Industry Revenue Share (%), by Product Type 2024 & 2032
- Figure 54: United Arab Emirates Matcha Industry Revenue (Million), by Form 2024 & 2032
- Figure 55: United Arab Emirates Matcha Industry Revenue Share (%), by Form 2024 & 2032
- Figure 56: United Arab Emirates Matcha Industry Revenue (Million), by Distribution Channel 2024 & 2032
- Figure 57: United Arab Emirates Matcha Industry Revenue Share (%), by Distribution Channel 2024 & 2032
- Figure 58: United Arab Emirates Matcha Industry Revenue (Million), by Country 2024 & 2032
- Figure 59: United Arab Emirates Matcha Industry Revenue Share (%), by Country 2024 & 2032
List of Tables
- Table 1: Global Matcha Industry Revenue Million Forecast, by Region 2019 & 2032
- Table 2: Global Matcha Industry Revenue Million Forecast, by Product Type 2019 & 2032
- Table 3: Global Matcha Industry Revenue Million Forecast, by Form 2019 & 2032
- Table 4: Global Matcha Industry Revenue Million Forecast, by Distribution Channel 2019 & 2032
- Table 5: Global Matcha Industry Revenue Million Forecast, by Region 2019 & 2032
- Table 6: Global Matcha Industry Revenue Million Forecast, by Country 2019 & 2032
- Table 7: United States Matcha Industry Revenue (Million) Forecast, by Application 2019 & 2032
- Table 8: Canada Matcha Industry Revenue (Million) Forecast, by Application 2019 & 2032
- Table 9: Mexico Matcha Industry Revenue (Million) Forecast, by Application 2019 & 2032
- Table 10: Rest of North America Matcha Industry Revenue (Million) Forecast, by Application 2019 & 2032
- Table 11: Global Matcha Industry Revenue Million Forecast, by Country 2019 & 2032
- Table 12: United Kingdom Matcha Industry Revenue (Million) Forecast, by Application 2019 & 2032
- Table 13: Germany Matcha Industry Revenue (Million) Forecast, by Application 2019 & 2032
- Table 14: Spain Matcha Industry Revenue (Million) Forecast, by Application 2019 & 2032
- Table 15: France Matcha Industry Revenue (Million) Forecast, by Application 2019 & 2032
- Table 16: Italy Matcha Industry Revenue (Million) Forecast, by Application 2019 & 2032
- Table 17: Russia Matcha Industry Revenue (Million) Forecast, by Application 2019 & 2032
- Table 18: Rest of Europe Matcha Industry Revenue (Million) Forecast, by Application 2019 & 2032
- Table 19: Global Matcha Industry Revenue Million Forecast, by Country 2019 & 2032
- Table 20: China Matcha Industry Revenue (Million) Forecast, by Application 2019 & 2032
- Table 21: Japan Matcha Industry Revenue (Million) Forecast, by Application 2019 & 2032
- Table 22: India Matcha Industry Revenue (Million) Forecast, by Application 2019 & 2032
- Table 23: Australia Matcha Industry Revenue (Million) Forecast, by Application 2019 & 2032
- Table 24: Rest of Asia Pacific Matcha Industry Revenue (Million) Forecast, by Application 2019 & 2032
- Table 25: Global Matcha Industry Revenue Million Forecast, by Country 2019 & 2032
- Table 26: Brazil Matcha Industry Revenue (Million) Forecast, by Application 2019 & 2032
- Table 27: Argentina Matcha Industry Revenue (Million) Forecast, by Application 2019 & 2032
- Table 28: Rest of South America Matcha Industry Revenue (Million) Forecast, by Application 2019 & 2032
- Table 29: Global Matcha Industry Revenue Million Forecast, by Country 2019 & 2032
- Table 30: UAE Matcha Industry Revenue (Million) Forecast, by Application 2019 & 2032
- Table 31: South Africa Matcha Industry Revenue (Million) Forecast, by Application 2019 & 2032
- Table 32: Saudi Arabia Matcha Industry Revenue (Million) Forecast, by Application 2019 & 2032
- Table 33: Rest of MEA Matcha Industry Revenue (Million) Forecast, by Application 2019 & 2032
- Table 34: Global Matcha Industry Revenue Million Forecast, by Product Type 2019 & 2032
- Table 35: Global Matcha Industry Revenue Million Forecast, by Form 2019 & 2032
- Table 36: Global Matcha Industry Revenue Million Forecast, by Distribution Channel 2019 & 2032
- Table 37: Global Matcha Industry Revenue Million Forecast, by Country 2019 & 2032
- Table 38: United States Matcha Industry Revenue (Million) Forecast, by Application 2019 & 2032
- Table 39: Canada Matcha Industry Revenue (Million) Forecast, by Application 2019 & 2032
- Table 40: Mexico Matcha Industry Revenue (Million) Forecast, by Application 2019 & 2032
- Table 41: Rest of North America Matcha Industry Revenue (Million) Forecast, by Application 2019 & 2032
- Table 42: Global Matcha Industry Revenue Million Forecast, by Product Type 2019 & 2032
- Table 43: Global Matcha Industry Revenue Million Forecast, by Form 2019 & 2032
- Table 44: Global Matcha Industry Revenue Million Forecast, by Distribution Channel 2019 & 2032
- Table 45: Global Matcha Industry Revenue Million Forecast, by Country 2019 & 2032
- Table 46: United Kingdom Matcha Industry Revenue (Million) Forecast, by Application 2019 & 2032
- Table 47: Germany Matcha Industry Revenue (Million) Forecast, by Application 2019 & 2032
- Table 48: Spain Matcha Industry Revenue (Million) Forecast, by Application 2019 & 2032
- Table 49: France Matcha Industry Revenue (Million) Forecast, by Application 2019 & 2032
- Table 50: Italy Matcha Industry Revenue (Million) Forecast, by Application 2019 & 2032
- Table 51: Russia Matcha Industry Revenue (Million) Forecast, by Application 2019 & 2032
- Table 52: Rest of Europe Matcha Industry Revenue (Million) Forecast, by Application 2019 & 2032
- Table 53: Global Matcha Industry Revenue Million Forecast, by Product Type 2019 & 2032
- Table 54: Global Matcha Industry Revenue Million Forecast, by Form 2019 & 2032
- Table 55: Global Matcha Industry Revenue Million Forecast, by Distribution Channel 2019 & 2032
- Table 56: Global Matcha Industry Revenue Million Forecast, by Country 2019 & 2032
- Table 57: China Matcha Industry Revenue (Million) Forecast, by Application 2019 & 2032
- Table 58: Japan Matcha Industry Revenue (Million) Forecast, by Application 2019 & 2032
- Table 59: India Matcha Industry Revenue (Million) Forecast, by Application 2019 & 2032
- Table 60: Australia Matcha Industry Revenue (Million) Forecast, by Application 2019 & 2032
- Table 61: Rest of Asia Pacific Matcha Industry Revenue (Million) Forecast, by Application 2019 & 2032
- Table 62: Global Matcha Industry Revenue Million Forecast, by Product Type 2019 & 2032
- Table 63: Global Matcha Industry Revenue Million Forecast, by Form 2019 & 2032
- Table 64: Global Matcha Industry Revenue Million Forecast, by Distribution Channel 2019 & 2032
- Table 65: Global Matcha Industry Revenue Million Forecast, by Country 2019 & 2032
- Table 66: Brazil Matcha Industry Revenue (Million) Forecast, by Application 2019 & 2032
- Table 67: Argentina Matcha Industry Revenue (Million) Forecast, by Application 2019 & 2032
- Table 68: Rest of South America Matcha Industry Revenue (Million) Forecast, by Application 2019 & 2032
- Table 69: Global Matcha Industry Revenue Million Forecast, by Product Type 2019 & 2032
- Table 70: Global Matcha Industry Revenue Million Forecast, by Form 2019 & 2032
- Table 71: Global Matcha Industry Revenue Million Forecast, by Distribution Channel 2019 & 2032
- Table 72: Global Matcha Industry Revenue Million Forecast, by Country 2019 & 2032
- Table 73: Global Matcha Industry Revenue Million Forecast, by Product Type 2019 & 2032
- Table 74: Global Matcha Industry Revenue Million Forecast, by Form 2019 & 2032
- Table 75: Global Matcha Industry Revenue Million Forecast, by Distribution Channel 2019 & 2032
- Table 76: Global Matcha Industry Revenue Million Forecast, by Country 2019 & 2032
- Table 77: South Africa Matcha Industry Revenue (Million) Forecast, by Application 2019 & 2032
- Table 78: Rest of Middle East Matcha Industry Revenue (Million) Forecast, by Application 2019 & 2032
Frequently Asked Questions
1. What is the projected Compound Annual Growth Rate (CAGR) of the Matcha Industry?
The projected CAGR is approximately 4.17%.
2. Which companies are prominent players in the Matcha Industry?
Key companies in the market include DoMatcha, Mizuba Tea, PIQUE*List Not Exhaustive, Matcha DNA, Ippodo Tea, AIYA America Inc, AOI Tea, Breakaway Matcha LLC, Matcha Maiden, Midori Spring.
3. What are the main segments of the Matcha Industry?
The market segments include Product Type, Form, Distribution Channel.
4. Can you provide details about the market size?
The market size is estimated to be USD 2.36 Million as of 2022.
5. What are some drivers contributing to market growth?
Increasing Focus On Health and Wellness; Surge in Product Innovation.
6. What are the notable trends driving market growth?
Increasing Focus On Health and Wellness.
7. Are there any restraints impacting market growth?
Presence of Substitutes.
8. Can you provide examples of recent developments in the market?
February 2024: Aiya Matcha acquired a majority stake in OMGTea to bring matcha to the masses. This collaboration aimed to expand and build a more extensive presence in the United Kingdom.
9. What pricing options are available for accessing the report?
Pricing options include single-user, multi-user, and enterprise licenses priced at USD 4750, USD 5250, and USD 8750 respectively.
10. Is the market size provided in terms of value or volume?
The market size is provided in terms of value, measured in Million.
11. Are there any specific market keywords associated with the report?
Yes, the market keyword associated with the report is "Matcha Industry," which aids in identifying and referencing the specific market segment covered.
12. How do I determine which pricing option suits my needs best?
The pricing options vary based on user requirements and access needs. Individual users may opt for single-user licenses, while businesses requiring broader access may choose multi-user or enterprise licenses for cost-effective access to the report.
13. Are there any additional resources or data provided in the Matcha Industry report?
While the report offers comprehensive insights, it's advisable to review the specific contents or supplementary materials provided to ascertain if additional resources or data are available.
14. How can I stay updated on further developments or reports in the Matcha Industry?
To stay informed about further developments, trends, and reports in the Matcha Industry, consider subscribing to industry newsletters, following relevant companies and organizations, or regularly checking reputable industry news sources and publications.
Methodology
Step 1 - Identification of Relevant Samples Size from Population Database


Step 2 - Approaches for Defining Global Market Size (Value, Volume* & Price*)

Note*: In applicable scenarios
Step 3 - Data Sources
Primary Research
- Web Analytics
- Survey Reports
- Research Institute
- Latest Research Reports
- Opinion Leaders
Secondary Research
- Annual Reports
- White Paper
- Latest Press Release
- Industry Association
- Paid Database
- Investor Presentations

Step 4 - Data Triangulation
Involves using different sources of information in order to increase the validity of a study
These sources are likely to be stakeholders in a program - participants, other researchers, program staff, other community members, and so on.
Then we put all data in single framework & apply various statistical tools to find out the dynamic on the market.
During the analysis stage, feedback from the stakeholder groups would be compared to determine areas of agreement as well as areas of divergence


