
Key Insights
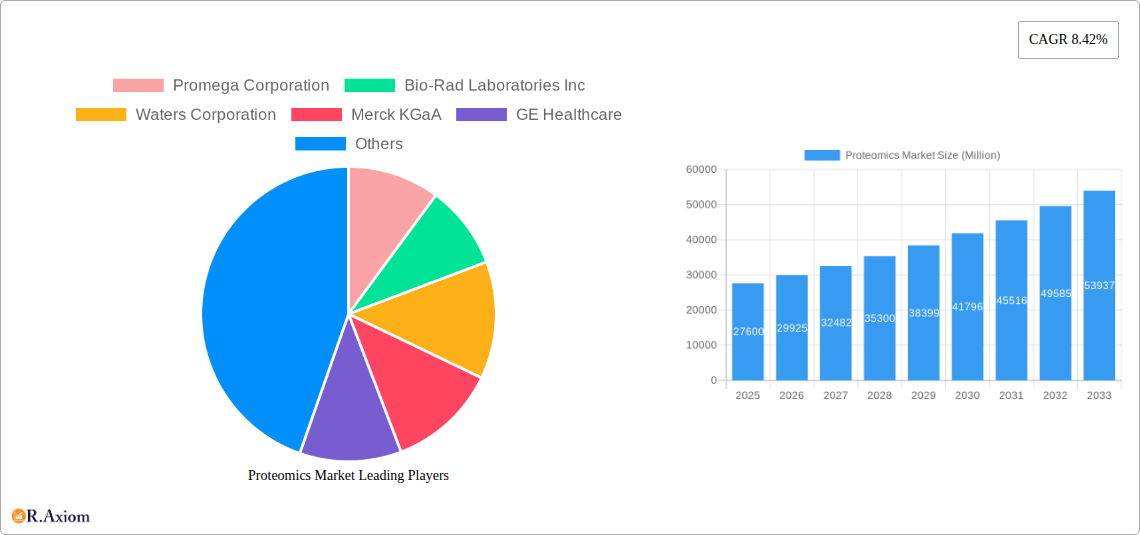
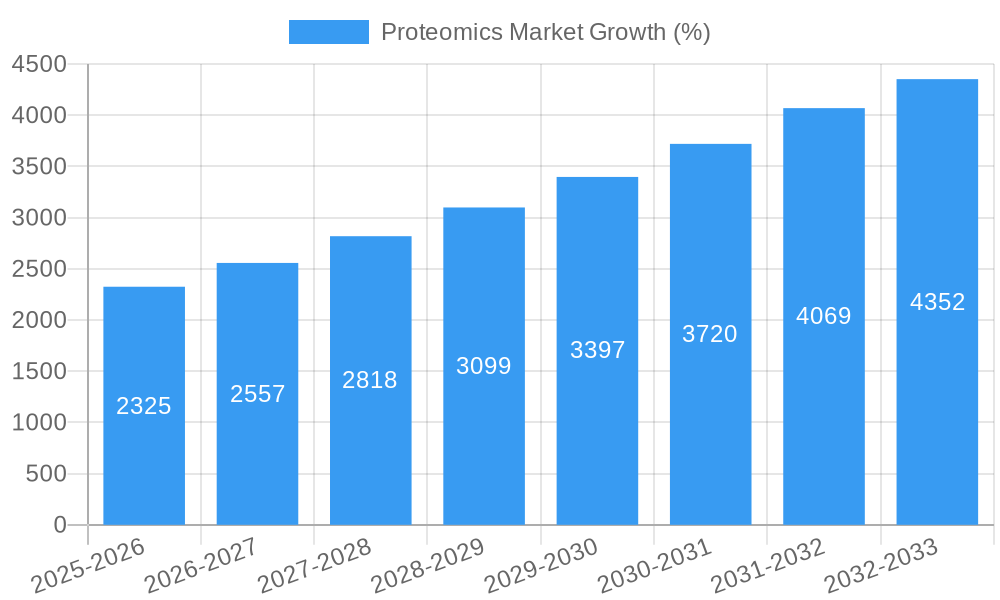
The global proteomics market, valued at $27.60 billion in 2025, is projected to experience robust growth, exhibiting a compound annual growth rate (CAGR) of 8.42% from 2025 to 2033. This expansion is fueled by several key factors. Advances in mass spectrometry technologies are driving higher throughput and more sensitive proteomic analyses, leading to faster and more cost-effective research. The increasing prevalence of chronic diseases like cancer and Alzheimer's is boosting demand for improved diagnostic tools and personalized medicine approaches, which heavily rely on proteomics. Furthermore, the growing adoption of proteomics in drug discovery and development, particularly in biomarker identification and target validation, is significantly contributing to market growth. The integration of bioinformatics and advanced data analysis techniques enhances the ability to interpret complex proteomic data, leading to more insightful biological discoveries. Finally, increasing government funding for research and development in life sciences is further propelling market expansion.
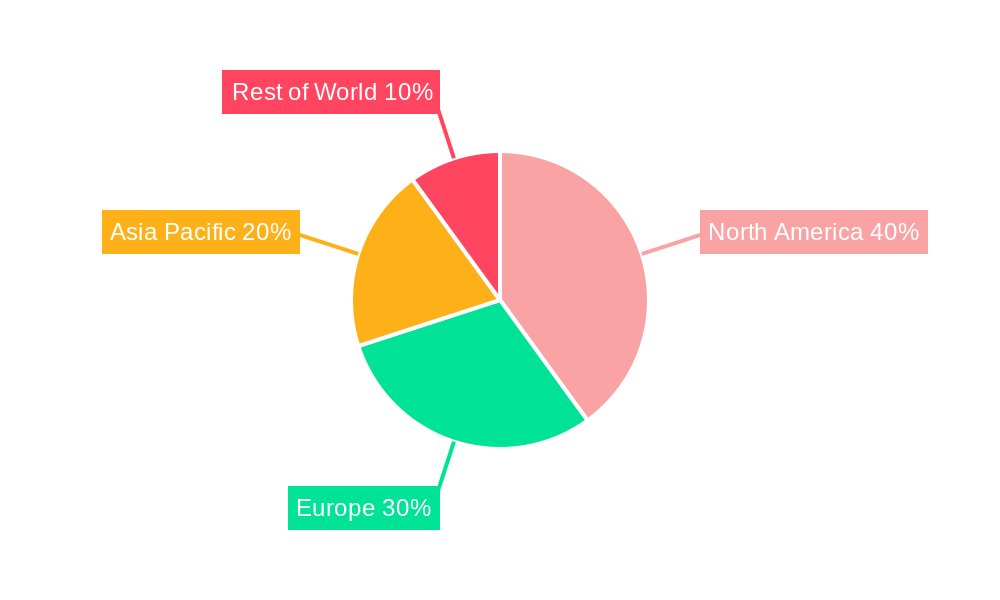
Significant growth is anticipated across all segments. Instrumentation technology, including mass spectrometers and chromatography systems, holds a major market share, driven by continuous technological innovations. Reagents, crucial for sample preparation and analysis, represent a substantial segment. Software and services, encompassing data analysis platforms and consulting expertise, are becoming increasingly important for effective proteomic research. Clincal diagnostics applications remain a dominant market driver due to the potential for early disease detection and personalized treatment strategies. The drug discovery segment is poised for rapid expansion, given the accelerating use of proteomics for target identification and validation in pharmaceutical research. Geographically, North America currently holds a significant market share, followed by Europe and Asia Pacific, with the latter experiencing rapid growth due to increasing research investments and a growing healthcare sector. Competition in the market is intense, with major players such as Promega, Bio-Rad, Waters, Merck KGaA, and Thermo Fisher Scientific leading the innovation and market penetration efforts.
Proteomics Market: A Comprehensive Market Analysis Report (2019-2033)
This comprehensive report provides an in-depth analysis of the global Proteomics Market, offering valuable insights for stakeholders across the industry value chain. The report covers the period 2019-2033, with a focus on the forecast period 2025-2033, using 2025 as the base year. The study meticulously examines market size, growth drivers, challenges, emerging opportunities, and competitive dynamics, providing a 360-degree view of this rapidly evolving market. Key players like Promega Corporation, Bio-Rad Laboratories Inc, Waters Corporation, Merck KGaA, GE Healthcare, Thermo Fisher Scientific Inc, Danaher Corporation, Agilent Technologies Inc, and Bruker Corporation are profiled, offering a granular understanding of their market positioning and strategies.
Proteomics Market Concentration & Innovation
The Proteomics market exhibits a moderately concentrated landscape, with a few dominant players holding significant market share. Thermo Fisher Scientific Inc and Danaher Corporation, for instance, collectively account for an estimated xx% of the market in 2025. This concentration is driven by substantial investments in R&D, leading to continuous innovation in instrumentation technologies, reagents, and software solutions. The market is characterized by a high rate of technological innovation, with advancements in mass spectrometry, liquid chromatography, and bioinformatics driving market growth. Regulatory frameworks, particularly those related to clinical diagnostics, significantly influence market dynamics. While no direct substitutes exist for proteomics technologies in their core applications, alternative analytical methods present some level of competition. End-user trends, especially the increasing adoption of proteomics in personalized medicine and drug discovery, fuel market expansion. M&A activity has played a role in shaping the market landscape, with deal values exceeding xx Million in the past five years, primarily focused on expanding product portfolios and geographical reach. These mergers and acquisitions further consolidate market share amongst the major players.
- Market Share: Thermo Fisher Scientific Inc and Danaher Corporation hold approximately xx% combined market share (2025 estimate).
- M&A Activity: Deal values exceeding xx Million over the past five years.
- Innovation Drivers: Advancements in mass spectrometry, liquid chromatography, and bioinformatics.
Proteomics Market Industry Trends & Insights
The global Proteomics market is poised for significant growth, exhibiting a CAGR of xx% during the forecast period (2025-2033). This growth is primarily driven by the rising prevalence of chronic diseases, increasing demand for personalized medicine, and the expanding application of proteomics in drug discovery and development. Technological advancements, particularly in high-throughput screening and data analysis, are further accelerating market expansion. Consumer preferences are shifting towards more precise and efficient diagnostic tools, fueling the demand for sophisticated proteomics technologies. The market witnesses intense competition, with established players focusing on expanding their product portfolios and entering new markets. Market penetration remains relatively low in several emerging economies, presenting lucrative opportunities for expansion. The adoption of cloud-based platforms for data analysis is gaining traction, representing a key technological disruption and simplifying the complex workflow within the Proteomics research ecosystem. This growing dependence on sophisticated data analysis software creates a significant secondary market, alongside the hardware and reagent components.
Dominant Markets & Segments in Proteomics Market
North America currently holds the largest market share in the Proteomics market, driven by strong research infrastructure, high healthcare expenditure, and a robust regulatory framework supporting technological innovation. Within the various segments, the Instrumentation Technology segment dominates, followed by Reagents. The Clinical Diagnostics application segment is expanding rapidly, driven by the increasing adoption of proteomics-based diagnostic tests.
- Leading Region: North America
- Key Drivers for North America Dominance:
- Strong R&D infrastructure
- High healthcare expenditure
- Favorable regulatory environment
- Dominant Product Segment: Instrumentation Technology (mass spectrometers, liquid chromatography systems) – driven by high capital expenditure.
- Dominant Application Segment: Clinical Diagnostics – due to increasing demand for precise diagnostic tests and personalized medicine.
- Rapid advancements in biomarker discovery and validation.
- Growing acceptance of proteomics for early disease detection.
Proteomics Market Product Developments
Recent product developments in the Proteomics market have focused on enhancing sensitivity, throughput, and data analysis capabilities. Miniaturization of instrumentation, development of more efficient reagents, and improved bioinformatics software are key technological trends. These advancements allow for more accurate and cost-effective proteomics analyses, broadening the application base and improving market accessibility. Companies are concentrating on offering integrated solutions that combine instrumentation, reagents, and software for streamlining workflows and enhancing customer experience. The emphasis is on user-friendliness and improved data interpretability, targeting a broader range of users.
Report Scope & Segmentation Analysis
The report segments the Proteomics market based on product and services (Instrumentation Technology, Other Instrumentation Technologies: Reagents, Software and Services) and application (Clinical Diagnostics, Drug Discovery, Other Applications). The Instrumentation Technology segment is projected to grow at a CAGR of xx%, driven by the demand for advanced mass spectrometers and liquid chromatography systems. The Reagents segment is expected to exhibit a CAGR of xx%, fueled by the increasing use of proteomics in various applications. The Software and Services segment is projected to experience rapid growth due to increasing data analysis needs and the adoption of cloud-based platforms. In terms of application, the Clinical Diagnostics segment is poised for significant growth owing to rising healthcare expenditure and the need for early disease detection. The Drug Discovery segment is expected to grow steadily due to the increasing use of proteomics in drug development. The Other Applications segment is anticipated to grow at a CAGR of xx%.
Key Drivers of Proteomics Market Growth
The Proteomics market's growth is propelled by several factors, including technological advancements in mass spectrometry and bioinformatics, increasing prevalence of chronic diseases necessitating advanced diagnostics, rising demand for personalized medicine, and significant investments in research and development from both public and private sectors. Favorable regulatory landscapes in key markets, coupled with growing government funding initiatives promoting biomedical research, further bolster market growth. The increasing adoption of proteomics in various fields, including pharmaceutical and biotechnology, also contributes significantly to market expansion.
Challenges in the Proteomics Market Sector
The Proteomics market faces several challenges, including the high cost of instrumentation and reagents limiting accessibility, the complexity of data analysis requiring specialized expertise, and stringent regulatory requirements for clinical applications increasing time-to-market. Supply chain disruptions can impact the availability of critical components and reagents, and the intense competition among established players necessitates continuous innovation and strategic partnerships to maintain market share. The difficulty in standardization of protocols and data analysis further complicates adoption and data interpretation. These combined factors negatively impact market penetration and adoption rates.
Emerging Opportunities in Proteomics Market
Emerging opportunities in the Proteomics market include the growing application of proteomics in personalized medicine, biomarker discovery for early disease detection, the development of point-of-care diagnostic devices, and integration of artificial intelligence (AI) for enhanced data analysis. Expansion into emerging markets with growing healthcare infrastructure and increasing awareness of advanced diagnostic techniques presents significant growth potential. The development of new reagents and improved mass spectrometry techniques will further expand the capabilities and applications of proteomics.
Leading Players in the Proteomics Market Market
- Promega Corporation
- Bio-Rad Laboratories Inc
- Waters Corporation
- Merck KGaA
- GE Healthcare
- Thermo Fisher Scientific Inc
- Danaher Corporation
- Agilent Technologies Inc
- Bruker Corporation
Key Developments in Proteomics Market Industry
- January 2023: Thermo Fisher Scientific launched a new mass spectrometer with enhanced sensitivity.
- June 2022: Bio-Rad Laboratories acquired a smaller proteomics company specializing in novel reagent development, expanding their portfolio.
- November 2021: Waters Corporation announced a significant partnership with a bioinformatics company, to improve their data analysis platform.
- (Add more recent developments as available)
Strategic Outlook for Proteomics Market Market
The Proteomics market is poised for continued expansion, driven by technological advancements, growing healthcare expenditure, and increasing awareness of the potential of proteomics in various applications. The focus on personalized medicine, biomarker discovery, and point-of-care diagnostics will be key growth catalysts. Companies are strategically investing in R&D, mergers and acquisitions, and strategic partnerships to strengthen their market position and expand into new markets. The integration of AI and machine learning in data analysis will further enhance the accuracy and efficiency of proteomics technologies, driving market expansion in the coming years.
Proteomics Market Segmentation
-
1. Product & Services
-
1.1. Instrumentation Technology
- 1.1.1. Spectroscopy
- 1.1.2. Chromatography
- 1.1.3. Electrophoresis
- 1.1.4. Protein Microarrays
- 1.1.5. X-Ray Crystallography
- 1.1.6. Other Instrumentation Technologies
- 1.2. Reagents
- 1.3. Software and Services
-
1.1. Instrumentation Technology
-
2. Application
- 2.1. Clinical Diagnostics
- 2.2. Drug Discovery
- 2.3. Other Applications
Proteomics Market Segmentation By Geography
-
1. North America
- 1.1. United States
- 1.2. Canada
- 1.3. Mexico
-
2. Europe
- 2.1. Germany
- 2.2. United Kingdom
- 2.3. France
- 2.4. Italy
- 2.5. Spain
- 2.6. Rest of Europe
-
3. Asia Pacific
- 3.1. China
- 3.2. Japan
- 3.3. India
- 3.4. Australia
- 3.5. South Korea
- 3.6. Rest of Asia Pacific
- 4. Middle East
-
5. GCC
- 5.1. South Africa
- 5.2. Rest of Middle East
-
6. South America
- 6.1. Brazil
- 6.2. Argentina
- 6.3. Rest of South America
Proteomics Market REPORT HIGHLIGHTS
| Aspects | Details |
|---|---|
| Study Period | 2019-2033 |
| Base Year | 2024 |
| Estimated Year | 2025 |
| Forecast Period | 2025-2033 |
| Historical Period | 2019-2024 |
| Growth Rate | CAGR of 8.42% from 2019-2033 |
| Segmentation |
|
Table of Contents
- 1. Introduction
- 1.1. Research Scope
- 1.2. Market Segmentation
- 1.3. Research Methodology
- 1.4. Definitions and Assumptions
- 2. Executive Summary
- 2.1. Introduction
- 3. Market Dynamics
- 3.1. Introduction
- 3.2. Market Drivers
- 3.2.1. Rising Demand for Personalized Medicine; Increasing R&D Expenditure and Government Funding for Proteomics; Technological Advancements
- 3.3. Market Restrains
- 3.3.1. High Cost of Instruments
- 3.4. Market Trends
- 3.4.1. Drug Discovery is Expected to Witness Healthy CAGR in Future
- 4. Market Factor Analysis
- 4.1. Porters Five Forces
- 4.2. Supply/Value Chain
- 4.3. PESTEL analysis
- 4.4. Market Entropy
- 4.5. Patent/Trademark Analysis
- 5. Global Proteomics Market Analysis, Insights and Forecast, 2019-2031
- 5.1. Market Analysis, Insights and Forecast - by Product & Services
- 5.1.1. Instrumentation Technology
- 5.1.1.1. Spectroscopy
- 5.1.1.2. Chromatography
- 5.1.1.3. Electrophoresis
- 5.1.1.4. Protein Microarrays
- 5.1.1.5. X-Ray Crystallography
- 5.1.1.6. Other Instrumentation Technologies
- 5.1.2. Reagents
- 5.1.3. Software and Services
- 5.1.1. Instrumentation Technology
- 5.2. Market Analysis, Insights and Forecast - by Application
- 5.2.1. Clinical Diagnostics
- 5.2.2. Drug Discovery
- 5.2.3. Other Applications
- 5.3. Market Analysis, Insights and Forecast - by Region
- 5.3.1. North America
- 5.3.2. Europe
- 5.3.3. Asia Pacific
- 5.3.4. Middle East
- 5.3.5. GCC
- 5.3.6. South America
- 5.1. Market Analysis, Insights and Forecast - by Product & Services
- 6. North America Proteomics Market Analysis, Insights and Forecast, 2019-2031
- 6.1. Market Analysis, Insights and Forecast - by Product & Services
- 6.1.1. Instrumentation Technology
- 6.1.1.1. Spectroscopy
- 6.1.1.2. Chromatography
- 6.1.1.3. Electrophoresis
- 6.1.1.4. Protein Microarrays
- 6.1.1.5. X-Ray Crystallography
- 6.1.1.6. Other Instrumentation Technologies
- 6.1.2. Reagents
- 6.1.3. Software and Services
- 6.1.1. Instrumentation Technology
- 6.2. Market Analysis, Insights and Forecast - by Application
- 6.2.1. Clinical Diagnostics
- 6.2.2. Drug Discovery
- 6.2.3. Other Applications
- 6.1. Market Analysis, Insights and Forecast - by Product & Services
- 7. Europe Proteomics Market Analysis, Insights and Forecast, 2019-2031
- 7.1. Market Analysis, Insights and Forecast - by Product & Services
- 7.1.1. Instrumentation Technology
- 7.1.1.1. Spectroscopy
- 7.1.1.2. Chromatography
- 7.1.1.3. Electrophoresis
- 7.1.1.4. Protein Microarrays
- 7.1.1.5. X-Ray Crystallography
- 7.1.1.6. Other Instrumentation Technologies
- 7.1.2. Reagents
- 7.1.3. Software and Services
- 7.1.1. Instrumentation Technology
- 7.2. Market Analysis, Insights and Forecast - by Application
- 7.2.1. Clinical Diagnostics
- 7.2.2. Drug Discovery
- 7.2.3. Other Applications
- 7.1. Market Analysis, Insights and Forecast - by Product & Services
- 8. Asia Pacific Proteomics Market Analysis, Insights and Forecast, 2019-2031
- 8.1. Market Analysis, Insights and Forecast - by Product & Services
- 8.1.1. Instrumentation Technology
- 8.1.1.1. Spectroscopy
- 8.1.1.2. Chromatography
- 8.1.1.3. Electrophoresis
- 8.1.1.4. Protein Microarrays
- 8.1.1.5. X-Ray Crystallography
- 8.1.1.6. Other Instrumentation Technologies
- 8.1.2. Reagents
- 8.1.3. Software and Services
- 8.1.1. Instrumentation Technology
- 8.2. Market Analysis, Insights and Forecast - by Application
- 8.2.1. Clinical Diagnostics
- 8.2.2. Drug Discovery
- 8.2.3. Other Applications
- 8.1. Market Analysis, Insights and Forecast - by Product & Services
- 9. Middle East Proteomics Market Analysis, Insights and Forecast, 2019-2031
- 9.1. Market Analysis, Insights and Forecast - by Product & Services
- 9.1.1. Instrumentation Technology
- 9.1.1.1. Spectroscopy
- 9.1.1.2. Chromatography
- 9.1.1.3. Electrophoresis
- 9.1.1.4. Protein Microarrays
- 9.1.1.5. X-Ray Crystallography
- 9.1.1.6. Other Instrumentation Technologies
- 9.1.2. Reagents
- 9.1.3. Software and Services
- 9.1.1. Instrumentation Technology
- 9.2. Market Analysis, Insights and Forecast - by Application
- 9.2.1. Clinical Diagnostics
- 9.2.2. Drug Discovery
- 9.2.3. Other Applications
- 9.1. Market Analysis, Insights and Forecast - by Product & Services
- 10. GCC Proteomics Market Analysis, Insights and Forecast, 2019-2031
- 10.1. Market Analysis, Insights and Forecast - by Product & Services
- 10.1.1. Instrumentation Technology
- 10.1.1.1. Spectroscopy
- 10.1.1.2. Chromatography
- 10.1.1.3. Electrophoresis
- 10.1.1.4. Protein Microarrays
- 10.1.1.5. X-Ray Crystallography
- 10.1.1.6. Other Instrumentation Technologies
- 10.1.2. Reagents
- 10.1.3. Software and Services
- 10.1.1. Instrumentation Technology
- 10.2. Market Analysis, Insights and Forecast - by Application
- 10.2.1. Clinical Diagnostics
- 10.2.2. Drug Discovery
- 10.2.3. Other Applications
- 10.1. Market Analysis, Insights and Forecast - by Product & Services
- 11. South America Proteomics Market Analysis, Insights and Forecast, 2019-2031
- 11.1. Market Analysis, Insights and Forecast - by Product & Services
- 11.1.1. Instrumentation Technology
- 11.1.1.1. Spectroscopy
- 11.1.1.2. Chromatography
- 11.1.1.3. Electrophoresis
- 11.1.1.4. Protein Microarrays
- 11.1.1.5. X-Ray Crystallography
- 11.1.1.6. Other Instrumentation Technologies
- 11.1.2. Reagents
- 11.1.3. Software and Services
- 11.1.1. Instrumentation Technology
- 11.2. Market Analysis, Insights and Forecast - by Application
- 11.2.1. Clinical Diagnostics
- 11.2.2. Drug Discovery
- 11.2.3. Other Applications
- 11.1. Market Analysis, Insights and Forecast - by Product & Services
- 12. North America Proteomics Market Analysis, Insights and Forecast, 2019-2031
- 12.1. Market Analysis, Insights and Forecast - By Country/Sub-region
- 12.1.1 United States
- 12.1.2 Canada
- 12.1.3 Mexico
- 13. Europe Proteomics Market Analysis, Insights and Forecast, 2019-2031
- 13.1. Market Analysis, Insights and Forecast - By Country/Sub-region
- 13.1.1 Germany
- 13.1.2 United Kingdom
- 13.1.3 France
- 13.1.4 Italy
- 13.1.5 Spain
- 13.1.6 Rest of Europe
- 14. Asia Pacific Proteomics Market Analysis, Insights and Forecast, 2019-2031
- 14.1. Market Analysis, Insights and Forecast - By Country/Sub-region
- 14.1.1 China
- 14.1.2 Japan
- 14.1.3 India
- 14.1.4 Australia
- 14.1.5 South Korea
- 14.1.6 Rest of Asia Pacific
- 15. Middle East Proteomics Market Analysis, Insights and Forecast, 2019-2031
- 15.1. Market Analysis, Insights and Forecast - By Country/Sub-region
- 15.1.1.
- 16. GCC Proteomics Market Analysis, Insights and Forecast, 2019-2031
- 16.1. Market Analysis, Insights and Forecast - By Country/Sub-region
- 16.1.1 South Africa
- 16.1.2 Rest of Middle East
- 17. South America Proteomics Market Analysis, Insights and Forecast, 2019-2031
- 17.1. Market Analysis, Insights and Forecast - By Country/Sub-region
- 17.1.1 Brazil
- 17.1.2 Argentina
- 17.1.3 Rest of South America
- 18. Competitive Analysis
- 18.1. Global Market Share Analysis 2024
- 18.2. Company Profiles
- 18.2.1 Promega Corporation
- 18.2.1.1. Overview
- 18.2.1.2. Products
- 18.2.1.3. SWOT Analysis
- 18.2.1.4. Recent Developments
- 18.2.1.5. Financials (Based on Availability)
- 18.2.2 Bio-Rad Laboratories Inc
- 18.2.2.1. Overview
- 18.2.2.2. Products
- 18.2.2.3. SWOT Analysis
- 18.2.2.4. Recent Developments
- 18.2.2.5. Financials (Based on Availability)
- 18.2.3 Waters Corporation
- 18.2.3.1. Overview
- 18.2.3.2. Products
- 18.2.3.3. SWOT Analysis
- 18.2.3.4. Recent Developments
- 18.2.3.5. Financials (Based on Availability)
- 18.2.4 Merck KGaA
- 18.2.4.1. Overview
- 18.2.4.2. Products
- 18.2.4.3. SWOT Analysis
- 18.2.4.4. Recent Developments
- 18.2.4.5. Financials (Based on Availability)
- 18.2.5 GE Healthcare
- 18.2.5.1. Overview
- 18.2.5.2. Products
- 18.2.5.3. SWOT Analysis
- 18.2.5.4. Recent Developments
- 18.2.5.5. Financials (Based on Availability)
- 18.2.6 Thermo Fisher Scientific Inc
- 18.2.6.1. Overview
- 18.2.6.2. Products
- 18.2.6.3. SWOT Analysis
- 18.2.6.4. Recent Developments
- 18.2.6.5. Financials (Based on Availability)
- 18.2.7 Danaher Corporation
- 18.2.7.1. Overview
- 18.2.7.2. Products
- 18.2.7.3. SWOT Analysis
- 18.2.7.4. Recent Developments
- 18.2.7.5. Financials (Based on Availability)
- 18.2.8 Agilent Technologies Inc
- 18.2.8.1. Overview
- 18.2.8.2. Products
- 18.2.8.3. SWOT Analysis
- 18.2.8.4. Recent Developments
- 18.2.8.5. Financials (Based on Availability)
- 18.2.9 Bruker Corporation
- 18.2.9.1. Overview
- 18.2.9.2. Products
- 18.2.9.3. SWOT Analysis
- 18.2.9.4. Recent Developments
- 18.2.9.5. Financials (Based on Availability)
- 18.2.1 Promega Corporation
List of Figures
- Figure 1: Global Proteomics Market Revenue Breakdown (Million, %) by Region 2024 & 2032
- Figure 2: Global Proteomics Market Volume Breakdown (K Unit, %) by Region 2024 & 2032
- Figure 3: North America Proteomics Market Revenue (Million), by Country 2024 & 2032
- Figure 4: North America Proteomics Market Volume (K Unit), by Country 2024 & 2032
- Figure 5: North America Proteomics Market Revenue Share (%), by Country 2024 & 2032
- Figure 6: North America Proteomics Market Volume Share (%), by Country 2024 & 2032
- Figure 7: Europe Proteomics Market Revenue (Million), by Country 2024 & 2032
- Figure 8: Europe Proteomics Market Volume (K Unit), by Country 2024 & 2032
- Figure 9: Europe Proteomics Market Revenue Share (%), by Country 2024 & 2032
- Figure 10: Europe Proteomics Market Volume Share (%), by Country 2024 & 2032
- Figure 11: Asia Pacific Proteomics Market Revenue (Million), by Country 2024 & 2032
- Figure 12: Asia Pacific Proteomics Market Volume (K Unit), by Country 2024 & 2032
- Figure 13: Asia Pacific Proteomics Market Revenue Share (%), by Country 2024 & 2032
- Figure 14: Asia Pacific Proteomics Market Volume Share (%), by Country 2024 & 2032
- Figure 15: Middle East Proteomics Market Revenue (Million), by Country 2024 & 2032
- Figure 16: Middle East Proteomics Market Volume (K Unit), by Country 2024 & 2032
- Figure 17: Middle East Proteomics Market Revenue Share (%), by Country 2024 & 2032
- Figure 18: Middle East Proteomics Market Volume Share (%), by Country 2024 & 2032
- Figure 19: GCC Proteomics Market Revenue (Million), by Country 2024 & 2032
- Figure 20: GCC Proteomics Market Volume (K Unit), by Country 2024 & 2032
- Figure 21: GCC Proteomics Market Revenue Share (%), by Country 2024 & 2032
- Figure 22: GCC Proteomics Market Volume Share (%), by Country 2024 & 2032
- Figure 23: South America Proteomics Market Revenue (Million), by Country 2024 & 2032
- Figure 24: South America Proteomics Market Volume (K Unit), by Country 2024 & 2032
- Figure 25: South America Proteomics Market Revenue Share (%), by Country 2024 & 2032
- Figure 26: South America Proteomics Market Volume Share (%), by Country 2024 & 2032
- Figure 27: North America Proteomics Market Revenue (Million), by Product & Services 2024 & 2032
- Figure 28: North America Proteomics Market Volume (K Unit), by Product & Services 2024 & 2032
- Figure 29: North America Proteomics Market Revenue Share (%), by Product & Services 2024 & 2032
- Figure 30: North America Proteomics Market Volume Share (%), by Product & Services 2024 & 2032
- Figure 31: North America Proteomics Market Revenue (Million), by Application 2024 & 2032
- Figure 32: North America Proteomics Market Volume (K Unit), by Application 2024 & 2032
- Figure 33: North America Proteomics Market Revenue Share (%), by Application 2024 & 2032
- Figure 34: North America Proteomics Market Volume Share (%), by Application 2024 & 2032
- Figure 35: North America Proteomics Market Revenue (Million), by Country 2024 & 2032
- Figure 36: North America Proteomics Market Volume (K Unit), by Country 2024 & 2032
- Figure 37: North America Proteomics Market Revenue Share (%), by Country 2024 & 2032
- Figure 38: North America Proteomics Market Volume Share (%), by Country 2024 & 2032
- Figure 39: Europe Proteomics Market Revenue (Million), by Product & Services 2024 & 2032
- Figure 40: Europe Proteomics Market Volume (K Unit), by Product & Services 2024 & 2032
- Figure 41: Europe Proteomics Market Revenue Share (%), by Product & Services 2024 & 2032
- Figure 42: Europe Proteomics Market Volume Share (%), by Product & Services 2024 & 2032
- Figure 43: Europe Proteomics Market Revenue (Million), by Application 2024 & 2032
- Figure 44: Europe Proteomics Market Volume (K Unit), by Application 2024 & 2032
- Figure 45: Europe Proteomics Market Revenue Share (%), by Application 2024 & 2032
- Figure 46: Europe Proteomics Market Volume Share (%), by Application 2024 & 2032
- Figure 47: Europe Proteomics Market Revenue (Million), by Country 2024 & 2032
- Figure 48: Europe Proteomics Market Volume (K Unit), by Country 2024 & 2032
- Figure 49: Europe Proteomics Market Revenue Share (%), by Country 2024 & 2032
- Figure 50: Europe Proteomics Market Volume Share (%), by Country 2024 & 2032
- Figure 51: Asia Pacific Proteomics Market Revenue (Million), by Product & Services 2024 & 2032
- Figure 52: Asia Pacific Proteomics Market Volume (K Unit), by Product & Services 2024 & 2032
- Figure 53: Asia Pacific Proteomics Market Revenue Share (%), by Product & Services 2024 & 2032
- Figure 54: Asia Pacific Proteomics Market Volume Share (%), by Product & Services 2024 & 2032
- Figure 55: Asia Pacific Proteomics Market Revenue (Million), by Application 2024 & 2032
- Figure 56: Asia Pacific Proteomics Market Volume (K Unit), by Application 2024 & 2032
- Figure 57: Asia Pacific Proteomics Market Revenue Share (%), by Application 2024 & 2032
- Figure 58: Asia Pacific Proteomics Market Volume Share (%), by Application 2024 & 2032
- Figure 59: Asia Pacific Proteomics Market Revenue (Million), by Country 2024 & 2032
- Figure 60: Asia Pacific Proteomics Market Volume (K Unit), by Country 2024 & 2032
- Figure 61: Asia Pacific Proteomics Market Revenue Share (%), by Country 2024 & 2032
- Figure 62: Asia Pacific Proteomics Market Volume Share (%), by Country 2024 & 2032
- Figure 63: Middle East Proteomics Market Revenue (Million), by Product & Services 2024 & 2032
- Figure 64: Middle East Proteomics Market Volume (K Unit), by Product & Services 2024 & 2032
- Figure 65: Middle East Proteomics Market Revenue Share (%), by Product & Services 2024 & 2032
- Figure 66: Middle East Proteomics Market Volume Share (%), by Product & Services 2024 & 2032
- Figure 67: Middle East Proteomics Market Revenue (Million), by Application 2024 & 2032
- Figure 68: Middle East Proteomics Market Volume (K Unit), by Application 2024 & 2032
- Figure 69: Middle East Proteomics Market Revenue Share (%), by Application 2024 & 2032
- Figure 70: Middle East Proteomics Market Volume Share (%), by Application 2024 & 2032
- Figure 71: Middle East Proteomics Market Revenue (Million), by Country 2024 & 2032
- Figure 72: Middle East Proteomics Market Volume (K Unit), by Country 2024 & 2032
- Figure 73: Middle East Proteomics Market Revenue Share (%), by Country 2024 & 2032
- Figure 74: Middle East Proteomics Market Volume Share (%), by Country 2024 & 2032
- Figure 75: GCC Proteomics Market Revenue (Million), by Product & Services 2024 & 2032
- Figure 76: GCC Proteomics Market Volume (K Unit), by Product & Services 2024 & 2032
- Figure 77: GCC Proteomics Market Revenue Share (%), by Product & Services 2024 & 2032
- Figure 78: GCC Proteomics Market Volume Share (%), by Product & Services 2024 & 2032
- Figure 79: GCC Proteomics Market Revenue (Million), by Application 2024 & 2032
- Figure 80: GCC Proteomics Market Volume (K Unit), by Application 2024 & 2032
- Figure 81: GCC Proteomics Market Revenue Share (%), by Application 2024 & 2032
- Figure 82: GCC Proteomics Market Volume Share (%), by Application 2024 & 2032
- Figure 83: GCC Proteomics Market Revenue (Million), by Country 2024 & 2032
- Figure 84: GCC Proteomics Market Volume (K Unit), by Country 2024 & 2032
- Figure 85: GCC Proteomics Market Revenue Share (%), by Country 2024 & 2032
- Figure 86: GCC Proteomics Market Volume Share (%), by Country 2024 & 2032
- Figure 87: South America Proteomics Market Revenue (Million), by Product & Services 2024 & 2032
- Figure 88: South America Proteomics Market Volume (K Unit), by Product & Services 2024 & 2032
- Figure 89: South America Proteomics Market Revenue Share (%), by Product & Services 2024 & 2032
- Figure 90: South America Proteomics Market Volume Share (%), by Product & Services 2024 & 2032
- Figure 91: South America Proteomics Market Revenue (Million), by Application 2024 & 2032
- Figure 92: South America Proteomics Market Volume (K Unit), by Application 2024 & 2032
- Figure 93: South America Proteomics Market Revenue Share (%), by Application 2024 & 2032
- Figure 94: South America Proteomics Market Volume Share (%), by Application 2024 & 2032
- Figure 95: South America Proteomics Market Revenue (Million), by Country 2024 & 2032
- Figure 96: South America Proteomics Market Volume (K Unit), by Country 2024 & 2032
- Figure 97: South America Proteomics Market Revenue Share (%), by Country 2024 & 2032
- Figure 98: South America Proteomics Market Volume Share (%), by Country 2024 & 2032
List of Tables
- Table 1: Global Proteomics Market Revenue Million Forecast, by Region 2019 & 2032
- Table 2: Global Proteomics Market Volume K Unit Forecast, by Region 2019 & 2032
- Table 3: Global Proteomics Market Revenue Million Forecast, by Product & Services 2019 & 2032
- Table 4: Global Proteomics Market Volume K Unit Forecast, by Product & Services 2019 & 2032
- Table 5: Global Proteomics Market Revenue Million Forecast, by Application 2019 & 2032
- Table 6: Global Proteomics Market Volume K Unit Forecast, by Application 2019 & 2032
- Table 7: Global Proteomics Market Revenue Million Forecast, by Region 2019 & 2032
- Table 8: Global Proteomics Market Volume K Unit Forecast, by Region 2019 & 2032
- Table 9: Global Proteomics Market Revenue Million Forecast, by Country 2019 & 2032
- Table 10: Global Proteomics Market Volume K Unit Forecast, by Country 2019 & 2032
- Table 11: United States Proteomics Market Revenue (Million) Forecast, by Application 2019 & 2032
- Table 12: United States Proteomics Market Volume (K Unit) Forecast, by Application 2019 & 2032
- Table 13: Canada Proteomics Market Revenue (Million) Forecast, by Application 2019 & 2032
- Table 14: Canada Proteomics Market Volume (K Unit) Forecast, by Application 2019 & 2032
- Table 15: Mexico Proteomics Market Revenue (Million) Forecast, by Application 2019 & 2032
- Table 16: Mexico Proteomics Market Volume (K Unit) Forecast, by Application 2019 & 2032
- Table 17: Global Proteomics Market Revenue Million Forecast, by Country 2019 & 2032
- Table 18: Global Proteomics Market Volume K Unit Forecast, by Country 2019 & 2032
- Table 19: Germany Proteomics Market Revenue (Million) Forecast, by Application 2019 & 2032
- Table 20: Germany Proteomics Market Volume (K Unit) Forecast, by Application 2019 & 2032
- Table 21: United Kingdom Proteomics Market Revenue (Million) Forecast, by Application 2019 & 2032
- Table 22: United Kingdom Proteomics Market Volume (K Unit) Forecast, by Application 2019 & 2032
- Table 23: France Proteomics Market Revenue (Million) Forecast, by Application 2019 & 2032
- Table 24: France Proteomics Market Volume (K Unit) Forecast, by Application 2019 & 2032
- Table 25: Italy Proteomics Market Revenue (Million) Forecast, by Application 2019 & 2032
- Table 26: Italy Proteomics Market Volume (K Unit) Forecast, by Application 2019 & 2032
- Table 27: Spain Proteomics Market Revenue (Million) Forecast, by Application 2019 & 2032
- Table 28: Spain Proteomics Market Volume (K Unit) Forecast, by Application 2019 & 2032
- Table 29: Rest of Europe Proteomics Market Revenue (Million) Forecast, by Application 2019 & 2032
- Table 30: Rest of Europe Proteomics Market Volume (K Unit) Forecast, by Application 2019 & 2032
- Table 31: Global Proteomics Market Revenue Million Forecast, by Country 2019 & 2032
- Table 32: Global Proteomics Market Volume K Unit Forecast, by Country 2019 & 2032
- Table 33: China Proteomics Market Revenue (Million) Forecast, by Application 2019 & 2032
- Table 34: China Proteomics Market Volume (K Unit) Forecast, by Application 2019 & 2032
- Table 35: Japan Proteomics Market Revenue (Million) Forecast, by Application 2019 & 2032
- Table 36: Japan Proteomics Market Volume (K Unit) Forecast, by Application 2019 & 2032
- Table 37: India Proteomics Market Revenue (Million) Forecast, by Application 2019 & 2032
- Table 38: India Proteomics Market Volume (K Unit) Forecast, by Application 2019 & 2032
- Table 39: Australia Proteomics Market Revenue (Million) Forecast, by Application 2019 & 2032
- Table 40: Australia Proteomics Market Volume (K Unit) Forecast, by Application 2019 & 2032
- Table 41: South Korea Proteomics Market Revenue (Million) Forecast, by Application 2019 & 2032
- Table 42: South Korea Proteomics Market Volume (K Unit) Forecast, by Application 2019 & 2032
- Table 43: Rest of Asia Pacific Proteomics Market Revenue (Million) Forecast, by Application 2019 & 2032
- Table 44: Rest of Asia Pacific Proteomics Market Volume (K Unit) Forecast, by Application 2019 & 2032
- Table 45: Global Proteomics Market Revenue Million Forecast, by Country 2019 & 2032
- Table 46: Global Proteomics Market Volume K Unit Forecast, by Country 2019 & 2032
- Table 47: Proteomics Market Revenue (Million) Forecast, by Application 2019 & 2032
- Table 48: Proteomics Market Volume (K Unit) Forecast, by Application 2019 & 2032
- Table 49: Global Proteomics Market Revenue Million Forecast, by Country 2019 & 2032
- Table 50: Global Proteomics Market Volume K Unit Forecast, by Country 2019 & 2032
- Table 51: South Africa Proteomics Market Revenue (Million) Forecast, by Application 2019 & 2032
- Table 52: South Africa Proteomics Market Volume (K Unit) Forecast, by Application 2019 & 2032
- Table 53: Rest of Middle East Proteomics Market Revenue (Million) Forecast, by Application 2019 & 2032
- Table 54: Rest of Middle East Proteomics Market Volume (K Unit) Forecast, by Application 2019 & 2032
- Table 55: Global Proteomics Market Revenue Million Forecast, by Country 2019 & 2032
- Table 56: Global Proteomics Market Volume K Unit Forecast, by Country 2019 & 2032
- Table 57: Brazil Proteomics Market Revenue (Million) Forecast, by Application 2019 & 2032
- Table 58: Brazil Proteomics Market Volume (K Unit) Forecast, by Application 2019 & 2032
- Table 59: Argentina Proteomics Market Revenue (Million) Forecast, by Application 2019 & 2032
- Table 60: Argentina Proteomics Market Volume (K Unit) Forecast, by Application 2019 & 2032
- Table 61: Rest of South America Proteomics Market Revenue (Million) Forecast, by Application 2019 & 2032
- Table 62: Rest of South America Proteomics Market Volume (K Unit) Forecast, by Application 2019 & 2032
- Table 63: Global Proteomics Market Revenue Million Forecast, by Product & Services 2019 & 2032
- Table 64: Global Proteomics Market Volume K Unit Forecast, by Product & Services 2019 & 2032
- Table 65: Global Proteomics Market Revenue Million Forecast, by Application 2019 & 2032
- Table 66: Global Proteomics Market Volume K Unit Forecast, by Application 2019 & 2032
- Table 67: Global Proteomics Market Revenue Million Forecast, by Country 2019 & 2032
- Table 68: Global Proteomics Market Volume K Unit Forecast, by Country 2019 & 2032
- Table 69: United States Proteomics Market Revenue (Million) Forecast, by Application 2019 & 2032
- Table 70: United States Proteomics Market Volume (K Unit) Forecast, by Application 2019 & 2032
- Table 71: Canada Proteomics Market Revenue (Million) Forecast, by Application 2019 & 2032
- Table 72: Canada Proteomics Market Volume (K Unit) Forecast, by Application 2019 & 2032
- Table 73: Mexico Proteomics Market Revenue (Million) Forecast, by Application 2019 & 2032
- Table 74: Mexico Proteomics Market Volume (K Unit) Forecast, by Application 2019 & 2032
- Table 75: Global Proteomics Market Revenue Million Forecast, by Product & Services 2019 & 2032
- Table 76: Global Proteomics Market Volume K Unit Forecast, by Product & Services 2019 & 2032
- Table 77: Global Proteomics Market Revenue Million Forecast, by Application 2019 & 2032
- Table 78: Global Proteomics Market Volume K Unit Forecast, by Application 2019 & 2032
- Table 79: Global Proteomics Market Revenue Million Forecast, by Country 2019 & 2032
- Table 80: Global Proteomics Market Volume K Unit Forecast, by Country 2019 & 2032
- Table 81: Germany Proteomics Market Revenue (Million) Forecast, by Application 2019 & 2032
- Table 82: Germany Proteomics Market Volume (K Unit) Forecast, by Application 2019 & 2032
- Table 83: United Kingdom Proteomics Market Revenue (Million) Forecast, by Application 2019 & 2032
- Table 84: United Kingdom Proteomics Market Volume (K Unit) Forecast, by Application 2019 & 2032
- Table 85: France Proteomics Market Revenue (Million) Forecast, by Application 2019 & 2032
- Table 86: France Proteomics Market Volume (K Unit) Forecast, by Application 2019 & 2032
- Table 87: Italy Proteomics Market Revenue (Million) Forecast, by Application 2019 & 2032
- Table 88: Italy Proteomics Market Volume (K Unit) Forecast, by Application 2019 & 2032
- Table 89: Spain Proteomics Market Revenue (Million) Forecast, by Application 2019 & 2032
- Table 90: Spain Proteomics Market Volume (K Unit) Forecast, by Application 2019 & 2032
- Table 91: Rest of Europe Proteomics Market Revenue (Million) Forecast, by Application 2019 & 2032
- Table 92: Rest of Europe Proteomics Market Volume (K Unit) Forecast, by Application 2019 & 2032
- Table 93: Global Proteomics Market Revenue Million Forecast, by Product & Services 2019 & 2032
- Table 94: Global Proteomics Market Volume K Unit Forecast, by Product & Services 2019 & 2032
- Table 95: Global Proteomics Market Revenue Million Forecast, by Application 2019 & 2032
- Table 96: Global Proteomics Market Volume K Unit Forecast, by Application 2019 & 2032
- Table 97: Global Proteomics Market Revenue Million Forecast, by Country 2019 & 2032
- Table 98: Global Proteomics Market Volume K Unit Forecast, by Country 2019 & 2032
- Table 99: China Proteomics Market Revenue (Million) Forecast, by Application 2019 & 2032
- Table 100: China Proteomics Market Volume (K Unit) Forecast, by Application 2019 & 2032
- Table 101: Japan Proteomics Market Revenue (Million) Forecast, by Application 2019 & 2032
- Table 102: Japan Proteomics Market Volume (K Unit) Forecast, by Application 2019 & 2032
- Table 103: India Proteomics Market Revenue (Million) Forecast, by Application 2019 & 2032
- Table 104: India Proteomics Market Volume (K Unit) Forecast, by Application 2019 & 2032
- Table 105: Australia Proteomics Market Revenue (Million) Forecast, by Application 2019 & 2032
- Table 106: Australia Proteomics Market Volume (K Unit) Forecast, by Application 2019 & 2032
- Table 107: South Korea Proteomics Market Revenue (Million) Forecast, by Application 2019 & 2032
- Table 108: South Korea Proteomics Market Volume (K Unit) Forecast, by Application 2019 & 2032
- Table 109: Rest of Asia Pacific Proteomics Market Revenue (Million) Forecast, by Application 2019 & 2032
- Table 110: Rest of Asia Pacific Proteomics Market Volume (K Unit) Forecast, by Application 2019 & 2032
- Table 111: Global Proteomics Market Revenue Million Forecast, by Product & Services 2019 & 2032
- Table 112: Global Proteomics Market Volume K Unit Forecast, by Product & Services 2019 & 2032
- Table 113: Global Proteomics Market Revenue Million Forecast, by Application 2019 & 2032
- Table 114: Global Proteomics Market Volume K Unit Forecast, by Application 2019 & 2032
- Table 115: Global Proteomics Market Revenue Million Forecast, by Country 2019 & 2032
- Table 116: Global Proteomics Market Volume K Unit Forecast, by Country 2019 & 2032
- Table 117: Global Proteomics Market Revenue Million Forecast, by Product & Services 2019 & 2032
- Table 118: Global Proteomics Market Volume K Unit Forecast, by Product & Services 2019 & 2032
- Table 119: Global Proteomics Market Revenue Million Forecast, by Application 2019 & 2032
- Table 120: Global Proteomics Market Volume K Unit Forecast, by Application 2019 & 2032
- Table 121: Global Proteomics Market Revenue Million Forecast, by Country 2019 & 2032
- Table 122: Global Proteomics Market Volume K Unit Forecast, by Country 2019 & 2032
- Table 123: South Africa Proteomics Market Revenue (Million) Forecast, by Application 2019 & 2032
- Table 124: South Africa Proteomics Market Volume (K Unit) Forecast, by Application 2019 & 2032
- Table 125: Rest of Middle East Proteomics Market Revenue (Million) Forecast, by Application 2019 & 2032
- Table 126: Rest of Middle East Proteomics Market Volume (K Unit) Forecast, by Application 2019 & 2032
- Table 127: Global Proteomics Market Revenue Million Forecast, by Product & Services 2019 & 2032
- Table 128: Global Proteomics Market Volume K Unit Forecast, by Product & Services 2019 & 2032
- Table 129: Global Proteomics Market Revenue Million Forecast, by Application 2019 & 2032
- Table 130: Global Proteomics Market Volume K Unit Forecast, by Application 2019 & 2032
- Table 131: Global Proteomics Market Revenue Million Forecast, by Country 2019 & 2032
- Table 132: Global Proteomics Market Volume K Unit Forecast, by Country 2019 & 2032
- Table 133: Brazil Proteomics Market Revenue (Million) Forecast, by Application 2019 & 2032
- Table 134: Brazil Proteomics Market Volume (K Unit) Forecast, by Application 2019 & 2032
- Table 135: Argentina Proteomics Market Revenue (Million) Forecast, by Application 2019 & 2032
- Table 136: Argentina Proteomics Market Volume (K Unit) Forecast, by Application 2019 & 2032
- Table 137: Rest of South America Proteomics Market Revenue (Million) Forecast, by Application 2019 & 2032
- Table 138: Rest of South America Proteomics Market Volume (K Unit) Forecast, by Application 2019 & 2032
Frequently Asked Questions
1. What is the projected Compound Annual Growth Rate (CAGR) of the Proteomics Market?
The projected CAGR is approximately 8.42%.
2. Which companies are prominent players in the Proteomics Market?
Key companies in the market include Promega Corporation, Bio-Rad Laboratories Inc, Waters Corporation, Merck KGaA, GE Healthcare, Thermo Fisher Scientific Inc, Danaher Corporation, Agilent Technologies Inc, Bruker Corporation.
3. What are the main segments of the Proteomics Market?
The market segments include Product & Services, Application.
4. Can you provide details about the market size?
The market size is estimated to be USD 27.60 Million as of 2022.
5. What are some drivers contributing to market growth?
Rising Demand for Personalized Medicine; Increasing R&D Expenditure and Government Funding for Proteomics; Technological Advancements.
6. What are the notable trends driving market growth?
Drug Discovery is Expected to Witness Healthy CAGR in Future.
7. Are there any restraints impacting market growth?
High Cost of Instruments.
8. Can you provide examples of recent developments in the market?
N/A
9. What pricing options are available for accessing the report?
Pricing options include single-user, multi-user, and enterprise licenses priced at USD 4750, USD 5250, and USD 8750 respectively.
10. Is the market size provided in terms of value or volume?
The market size is provided in terms of value, measured in Million and volume, measured in K Unit.
11. Are there any specific market keywords associated with the report?
Yes, the market keyword associated with the report is "Proteomics Market," which aids in identifying and referencing the specific market segment covered.
12. How do I determine which pricing option suits my needs best?
The pricing options vary based on user requirements and access needs. Individual users may opt for single-user licenses, while businesses requiring broader access may choose multi-user or enterprise licenses for cost-effective access to the report.
13. Are there any additional resources or data provided in the Proteomics Market report?
While the report offers comprehensive insights, it's advisable to review the specific contents or supplementary materials provided to ascertain if additional resources or data are available.
14. How can I stay updated on further developments or reports in the Proteomics Market?
To stay informed about further developments, trends, and reports in the Proteomics Market, consider subscribing to industry newsletters, following relevant companies and organizations, or regularly checking reputable industry news sources and publications.
Methodology
Step 1 - Identification of Relevant Samples Size from Population Database


Step 2 - Approaches for Defining Global Market Size (Value, Volume* & Price*)

Note*: In applicable scenarios
Step 3 - Data Sources
Primary Research
- Web Analytics
- Survey Reports
- Research Institute
- Latest Research Reports
- Opinion Leaders
Secondary Research
- Annual Reports
- White Paper
- Latest Press Release
- Industry Association
- Paid Database
- Investor Presentations

Step 4 - Data Triangulation
Involves using different sources of information in order to increase the validity of a study
These sources are likely to be stakeholders in a program - participants, other researchers, program staff, other community members, and so on.
Then we put all data in single framework & apply various statistical tools to find out the dynamic on the market.
During the analysis stage, feedback from the stakeholder groups would be compared to determine areas of agreement as well as areas of divergence


