
Key Insights
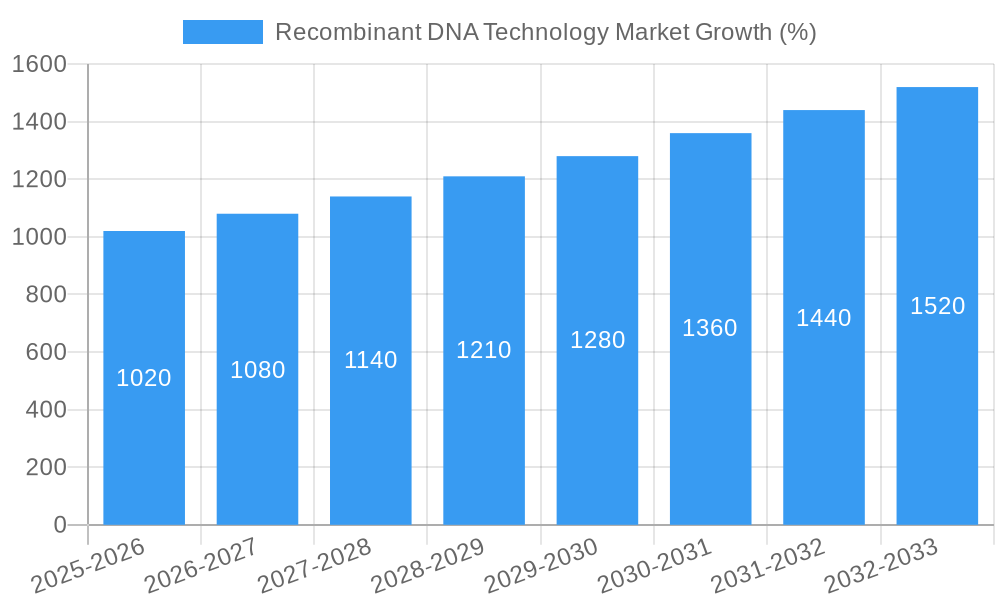
The Recombinant DNA Technology market is experiencing robust growth, projected to reach a substantial market size by 2033. A compound annual growth rate (CAGR) of 6.80% from 2025 to 2033 indicates a significant expansion driven by several key factors. The increasing prevalence of chronic diseases necessitates the development of novel therapeutics and diagnostics, fueling demand for recombinant DNA technology in the pharmaceutical and biotechnology sectors. Furthermore, advancements in gene editing technologies, such as CRISPR-Cas9, are accelerating research and development in areas like personalized medicine and gene therapy, thereby contributing to market expansion. The growing adoption of recombinant DNA technology in academic and government research institutes for basic and applied research further strengthens market growth. While regulatory hurdles and ethical concerns related to gene editing pose some restraints, the overall market trajectory remains positive. Significant growth is anticipated across various segments, including medical applications (e.g., therapeutic proteins, vaccines), non-medical applications (e.g., industrial enzymes), and different expression systems and cloning vectors. North America and Europe are currently leading the market due to robust research infrastructure and regulatory frameworks, but the Asia-Pacific region shows significant potential for future growth due to burgeoning pharmaceutical industries and increasing investment in research and development.
The segmentation of the market reveals opportunities across various end-users and product categories. Biotechnology and pharmaceutical companies constitute the largest end-user segment, driven by the continuous need for novel drug discovery and development. Academic and government research institutes are also crucial contributors to the market, fostering innovation and generating fundamental knowledge. The "Medical" product segment will likely retain dominance, driven by the demand for biopharmaceuticals and therapeutic proteins. Applications in health and disease research and development will remain the primary growth driver, with increasing diversification into food and agriculture and environmental applications. While established players such as Merck KGaA, Sanofi, and Novartis AG dominate the market, smaller biotechnology firms and research institutions are contributing significant innovations, leading to a competitive and dynamic market landscape. The sustained investment in research and development across diverse segments is expected to ensure the continued growth and expansion of the recombinant DNA technology market in the coming years.

Recombinant DNA Technology Market: A Comprehensive Report (2019-2033)
This detailed report provides a comprehensive analysis of the Recombinant DNA Technology market, covering market size, segmentation, growth drivers, challenges, opportunities, and key players. The study period spans from 2019 to 2033, with 2025 serving as the base and estimated year. The forecast period is 2025-2033, and the historical period is 2019-2024. This report is essential for industry stakeholders, investors, and researchers seeking a deep understanding of this dynamic market.
Recombinant DNA Technology Market Concentration & Innovation
This section analyzes the competitive landscape of the recombinant DNA technology market, examining market concentration, innovation drivers, regulatory frameworks, and industry dynamics. The market is characterized by a mix of large multinational corporations and smaller specialized companies. Market share data reveals that a few major players dominate the market, but a significant number of smaller companies contribute to innovation. The exact market share figures for each company are unavailable at this time (xx). However, based on revenue and market presence, we estimate that the top five players hold approximately 60% of the market.
Innovation Drivers: Key drivers include advancements in gene editing technologies (like CRISPR-Cas9), the development of novel expression systems, and increasing demand for personalized medicine. Significant R&D investments by both large pharmaceutical companies and smaller biotech firms are fueling innovation.
Regulatory Frameworks: Stringent regulatory approvals for new recombinant products impact market entry and growth, but these regulations also ensure product safety and efficacy. The regulatory landscape varies across different geographies, which can create complexities for companies operating globally.
Product Substitutes: While recombinant DNA technology offers unique advantages, certain applications might face competition from alternative technologies, particularly in specific niche markets. The extent of this competition varies across different segments.
M&A Activities: The recombinant DNA technology market has witnessed several mergers and acquisitions in recent years, with deal values ranging from xx Million to xx Million. These activities reflect the strategic importance of the sector and the ongoing consolidation among major players. Examples include the strategic acquisition of smaller biotech firms by large pharmaceutical companies to expand their product portfolios and technological capabilities.
End-User Trends: The increasing adoption of recombinant DNA technology across various end-user segments, primarily biotechnology and pharmaceutical companies, is a significant growth driver. Academic and government research institutes also play a crucial role in driving innovation and expanding the applications of the technology.
Recombinant DNA Technology Market Industry Trends & Insights
The recombinant DNA technology market is experiencing robust growth, driven by several key factors. The Compound Annual Growth Rate (CAGR) during the forecast period (2025-2033) is estimated to be xx%. This growth is fueled by the rising prevalence of chronic diseases, increasing demand for advanced therapeutics like biosimilars and personalized medicines, and growing investments in research and development.
Technological advancements, particularly in gene editing and synthetic biology, are revolutionizing the field. New expression systems and improved cloning vectors are enhancing the efficiency and scalability of recombinant DNA technology applications. The market penetration of these new technologies is steadily increasing, particularly in the medical and pharmaceutical sectors.
Consumer preferences are shifting towards personalized and targeted therapies, driving demand for tailored recombinant products. The competitive dynamics are shaped by a combination of factors, including technological innovation, regulatory changes, and strategic partnerships. The market is witnessing increasing collaboration between pharmaceutical companies and academic institutions. This fosters innovation and accelerates the development of new products.
Dominant Markets & Segments in Recombinant DNA Technology Market
The Recombinant DNA Technology market is experiencing growth across various segments. While market size data for individual segments is unavailable at this time (xx), a qualitative assessment of market dominance reveals the following:
- Dominant End User: Biotechnology and pharmaceutical companies represent the largest segment due to their substantial R&D investments and focus on developing novel therapeutics and diagnostics.
- Dominant Product: The medical segment holds the leading position, driven by the high demand for recombinant protein therapeutics and vaccines for various diseases.
- Dominant Component: Expression systems are a crucial component, representing a significant segment given their critical role in the production of recombinant proteins.
- Dominant Application: Health and disease applications dominate, reflecting the extensive use of recombinant DNA technology in developing novel therapeutics, diagnostics, and vaccines.
Key Drivers for Dominance:
- Biotechnology and Pharmaceutical Companies: Large R&D budgets, focus on novel therapeutics.
- Medical Product Segment: High demand for protein therapeutics, diagnostics and vaccines.
- Expression Systems: Essential for recombinant protein production, efficiency and scalability.
- Health and Disease Applications: Significant need for treatment and prevention of chronic diseases.
Recombinant DNA Technology Market Product Developments
The recombinant DNA technology market is experiencing rapid growth driven by continuous product innovations. These advancements enhance the efficiency, specificity, and scalability of recombinant protein production, opening doors to novel applications across diverse sectors. Significant progress in gene editing tools, particularly CRISPR-Cas9 technology, allows for more precise and efficient gene modification. This precision translates into improved protein quality and higher yields from novel expression systems. Simultaneously, innovative cloning vectors significantly improve the efficiency of gene transfer. The convergence of these technological advancements is leading to a better market fit, characterized by reduced manufacturing costs and demonstrably improved product efficacy. This makes recombinant DNA technology more accessible and cost-effective for a broader range of applications.
Report Scope & Segmentation Analysis
This report provides a comprehensive analysis of the recombinant DNA technology market, segmented across key parameters to offer a granular understanding of market dynamics. The segmentation includes:
End User: The market is categorized into Biotechnology and Pharmaceutical Companies, Academic and Government Research Institutes, and Other End Users. Growth projections for each segment are influenced by factors such as R&D investment levels, specific technological applications, and regulatory landscapes.
Product: The report distinguishes between Medical products (including therapeutics and diagnostics) and Vaccines (both medical and non-medical). Medical products currently hold a larger market share, driven by the high prevalence of diseases and the consequent demand for effective treatments. However, the vaccine segment is experiencing significant growth, particularly with the development of novel recombinant vaccines.
Component: Key components analyzed include Expression Systems (bacterial, mammalian, yeast, and insect cell systems) and Cloning Vectors. Advances in mammalian and yeast expression systems are pivotal in driving market growth, particularly for the production of complex therapeutic proteins.
Application: The market is further segmented by application into Food and Agriculture, Health and Disease, Environmental applications, and Other Applications. Health and disease applications, including personalized medicine and gene therapy, continue to dominate the market, showing substantial growth potential.
Key Drivers of Recombinant DNA Technology Market Growth
Several factors are driving the growth of the recombinant DNA technology market. These include:
- Technological advancements: Improved gene editing tools, higher-throughput screening methods, and more efficient expression systems.
- Growing demand for biopharmaceuticals: Increasing prevalence of chronic diseases, demand for personalized medicine.
- Favorable regulatory environment: Increasing approvals for novel recombinant therapeutics.
Challenges in the Recombinant DNA Technology Market Sector
The market faces several challenges:
- High R&D costs: Significant investments are needed for developing and validating new products.
- Stringent regulatory approvals: Lengthy and complex approval processes can delay product launches.
- Competition: Intense competition from established players and emerging companies. The level of competition varies across segments.
Emerging Opportunities in Recombinant DNA Technology Market
The recombinant DNA technology market presents several compelling emerging opportunities with significant growth potential:
- Gene Therapy: The escalating demand for effective gene-based therapies to treat a wide range of genetic disorders is a major driver of market expansion. Advances in gene editing and delivery systems are fueling this growth.
- Personalized Medicine: The development of targeted therapies tailored to individual genetic profiles is revolutionizing healthcare. Recombinant DNA technology plays a crucial role in enabling the production of personalized medicines.
- Synthetic Biology: The engineering of novel biological systems for diverse applications is opening new frontiers in various industries, from pharmaceuticals to biofuels. This field relies heavily on advanced recombinant DNA technologies.
- Biomanufacturing Advancements: Continuous improvements in bioreactor technology, process optimization, and downstream processing are enhancing the efficiency and cost-effectiveness of recombinant protein production.
Leading Players in the Recombinant DNA Technology Market Market
- Horizon Discovery
- Merck KGaA
- Sanofi
- Novartis AG
- Amgen Inc
- Eli Lilly and Company
- New England Biolabs
- F Hoffmann-La Roche Ltd (Genentech Inc )
- GenScript
- Novo Nordisk A/S
- Syngene International Limited
- Pfizer Inc
Key Developments in Recombinant DNA Technology Market Industry
- March 2022: VBI Vaccines Inc. launched PreHevbrio (Recombinant Hepatitis B Vaccine) in the US, marking a significant advancement in vaccine technology.
- February 2022: VBI Vaccines Inc. received a positive opinion from the EMA for PreHevbri (Hepatitis B vaccine) in Europe, paving the way for wider availability.
- [Add more recent key developments here, including mergers, acquisitions, new product launches, regulatory approvals etc. Include dates and brief descriptions.]
Strategic Outlook for Recombinant DNA Technology Market Market
The recombinant DNA technology market is poised for continued growth, driven by technological innovation, increasing demand for advanced therapeutics, and expanding applications across various sectors. The market will continue to be shaped by strategic partnerships, mergers and acquisitions, and ongoing R&D investments. New technologies like gene editing and synthetic biology will further expand the market's potential, creating opportunities for innovation and growth in the coming years.
Recombinant DNA Technology Market Segmentation
-
1. Product
-
1.1. Medical
- 1.1.1. Therapeutic Agent
- 1.1.2. Human Protein
- 1.1.3. Vaccine
-
1.2. Non-medical
- 1.2.1. Biotech Crops
- 1.2.2. Specialty Chemicals
- 1.2.3. Other Non-medical Products
-
1.1. Medical
-
2. Component
- 2.1. Expression System
- 2.2. Cloning Vector
-
3. Application
- 3.1. Food and Agriculture
- 3.2. Health and Disease
- 3.3. Environment
- 3.4. Other Applications
-
4. End User
- 4.1. Biotechnology and Pharmaceutical Companies
- 4.2. Academic and Government Research Institutes
- 4.3. Other End Users
Recombinant DNA Technology Market Segmentation By Geography
-
1. North America
- 1.1. United States
- 1.2. Canada
- 1.3. Mexico
-
2. Europe
- 2.1. Germany
- 2.2. United Kingdom
- 2.3. France
- 2.4. Italy
- 2.5. Spain
- 2.6. Rest of Europe
-
3. Asia Pacific
- 3.1. China
- 3.2. Japan
- 3.3. India
- 3.4. Australia
- 3.5. South korea
- 3.6. Rest of Asia Pacific
-
4. Middle East and Africa
- 4.1. GCC
- 4.2. South Africa
- 4.3. Rest of Middle East and Africa
-
5. South America
- 5.1. Brazil
- 5.2. Argentina
- 5.3. Rest of South America

Recombinant DNA Technology Market REPORT HIGHLIGHTS
| Aspects | Details |
|---|---|
| Study Period | 2019-2033 |
| Base Year | 2024 |
| Estimated Year | 2025 |
| Forecast Period | 2025-2033 |
| Historical Period | 2019-2024 |
| Growth Rate | CAGR of 6.80% from 2019-2033 |
| Segmentation |
|
Table of Contents
- 1. Introduction
- 1.1. Research Scope
- 1.2. Market Segmentation
- 1.3. Research Methodology
- 1.4. Definitions and Assumptions
- 2. Executive Summary
- 2.1. Introduction
- 3. Market Dynamics
- 3.1. Introduction
- 3.2. Market Drivers
- 3.2.1. Technological Advancements in Genomics; Expansion of Biopharmaceutical Industry; Increasing Demand and Applications of Recombinant/ Genetically Modified Products
- 3.3. Market Restrains
- 3.3.1 Regulatory
- 3.3.2 Scientific
- 3.3.3 and Ethical Challenges Associated with Gene Therapy
- 3.4. Market Trends
- 3.4.1. The Food and Agriculture Segment is Expected to Register the High CAGR Over the Forecast Period
- 4. Market Factor Analysis
- 4.1. Porters Five Forces
- 4.2. Supply/Value Chain
- 4.3. PESTEL analysis
- 4.4. Market Entropy
- 4.5. Patent/Trademark Analysis
- 5. Global Recombinant DNA Technology Market Analysis, Insights and Forecast, 2019-2031
- 5.1. Market Analysis, Insights and Forecast - by Product
- 5.1.1. Medical
- 5.1.1.1. Therapeutic Agent
- 5.1.1.2. Human Protein
- 5.1.1.3. Vaccine
- 5.1.2. Non-medical
- 5.1.2.1. Biotech Crops
- 5.1.2.2. Specialty Chemicals
- 5.1.2.3. Other Non-medical Products
- 5.1.1. Medical
- 5.2. Market Analysis, Insights and Forecast - by Component
- 5.2.1. Expression System
- 5.2.2. Cloning Vector
- 5.3. Market Analysis, Insights and Forecast - by Application
- 5.3.1. Food and Agriculture
- 5.3.2. Health and Disease
- 5.3.3. Environment
- 5.3.4. Other Applications
- 5.4. Market Analysis, Insights and Forecast - by End User
- 5.4.1. Biotechnology and Pharmaceutical Companies
- 5.4.2. Academic and Government Research Institutes
- 5.4.3. Other End Users
- 5.5. Market Analysis, Insights and Forecast - by Region
- 5.5.1. North America
- 5.5.2. Europe
- 5.5.3. Asia Pacific
- 5.5.4. Middle East and Africa
- 5.5.5. South America
- 5.1. Market Analysis, Insights and Forecast - by Product
- 6. North America Recombinant DNA Technology Market Analysis, Insights and Forecast, 2019-2031
- 6.1. Market Analysis, Insights and Forecast - by Product
- 6.1.1. Medical
- 6.1.1.1. Therapeutic Agent
- 6.1.1.2. Human Protein
- 6.1.1.3. Vaccine
- 6.1.2. Non-medical
- 6.1.2.1. Biotech Crops
- 6.1.2.2. Specialty Chemicals
- 6.1.2.3. Other Non-medical Products
- 6.1.1. Medical
- 6.2. Market Analysis, Insights and Forecast - by Component
- 6.2.1. Expression System
- 6.2.2. Cloning Vector
- 6.3. Market Analysis, Insights and Forecast - by Application
- 6.3.1. Food and Agriculture
- 6.3.2. Health and Disease
- 6.3.3. Environment
- 6.3.4. Other Applications
- 6.4. Market Analysis, Insights and Forecast - by End User
- 6.4.1. Biotechnology and Pharmaceutical Companies
- 6.4.2. Academic and Government Research Institutes
- 6.4.3. Other End Users
- 6.1. Market Analysis, Insights and Forecast - by Product
- 7. Europe Recombinant DNA Technology Market Analysis, Insights and Forecast, 2019-2031
- 7.1. Market Analysis, Insights and Forecast - by Product
- 7.1.1. Medical
- 7.1.1.1. Therapeutic Agent
- 7.1.1.2. Human Protein
- 7.1.1.3. Vaccine
- 7.1.2. Non-medical
- 7.1.2.1. Biotech Crops
- 7.1.2.2. Specialty Chemicals
- 7.1.2.3. Other Non-medical Products
- 7.1.1. Medical
- 7.2. Market Analysis, Insights and Forecast - by Component
- 7.2.1. Expression System
- 7.2.2. Cloning Vector
- 7.3. Market Analysis, Insights and Forecast - by Application
- 7.3.1. Food and Agriculture
- 7.3.2. Health and Disease
- 7.3.3. Environment
- 7.3.4. Other Applications
- 7.4. Market Analysis, Insights and Forecast - by End User
- 7.4.1. Biotechnology and Pharmaceutical Companies
- 7.4.2. Academic and Government Research Institutes
- 7.4.3. Other End Users
- 7.1. Market Analysis, Insights and Forecast - by Product
- 8. Asia Pacific Recombinant DNA Technology Market Analysis, Insights and Forecast, 2019-2031
- 8.1. Market Analysis, Insights and Forecast - by Product
- 8.1.1. Medical
- 8.1.1.1. Therapeutic Agent
- 8.1.1.2. Human Protein
- 8.1.1.3. Vaccine
- 8.1.2. Non-medical
- 8.1.2.1. Biotech Crops
- 8.1.2.2. Specialty Chemicals
- 8.1.2.3. Other Non-medical Products
- 8.1.1. Medical
- 8.2. Market Analysis, Insights and Forecast - by Component
- 8.2.1. Expression System
- 8.2.2. Cloning Vector
- 8.3. Market Analysis, Insights and Forecast - by Application
- 8.3.1. Food and Agriculture
- 8.3.2. Health and Disease
- 8.3.3. Environment
- 8.3.4. Other Applications
- 8.4. Market Analysis, Insights and Forecast - by End User
- 8.4.1. Biotechnology and Pharmaceutical Companies
- 8.4.2. Academic and Government Research Institutes
- 8.4.3. Other End Users
- 8.1. Market Analysis, Insights and Forecast - by Product
- 9. Middle East and Africa Recombinant DNA Technology Market Analysis, Insights and Forecast, 2019-2031
- 9.1. Market Analysis, Insights and Forecast - by Product
- 9.1.1. Medical
- 9.1.1.1. Therapeutic Agent
- 9.1.1.2. Human Protein
- 9.1.1.3. Vaccine
- 9.1.2. Non-medical
- 9.1.2.1. Biotech Crops
- 9.1.2.2. Specialty Chemicals
- 9.1.2.3. Other Non-medical Products
- 9.1.1. Medical
- 9.2. Market Analysis, Insights and Forecast - by Component
- 9.2.1. Expression System
- 9.2.2. Cloning Vector
- 9.3. Market Analysis, Insights and Forecast - by Application
- 9.3.1. Food and Agriculture
- 9.3.2. Health and Disease
- 9.3.3. Environment
- 9.3.4. Other Applications
- 9.4. Market Analysis, Insights and Forecast - by End User
- 9.4.1. Biotechnology and Pharmaceutical Companies
- 9.4.2. Academic and Government Research Institutes
- 9.4.3. Other End Users
- 9.1. Market Analysis, Insights and Forecast - by Product
- 10. South America Recombinant DNA Technology Market Analysis, Insights and Forecast, 2019-2031
- 10.1. Market Analysis, Insights and Forecast - by Product
- 10.1.1. Medical
- 10.1.1.1. Therapeutic Agent
- 10.1.1.2. Human Protein
- 10.1.1.3. Vaccine
- 10.1.2. Non-medical
- 10.1.2.1. Biotech Crops
- 10.1.2.2. Specialty Chemicals
- 10.1.2.3. Other Non-medical Products
- 10.1.1. Medical
- 10.2. Market Analysis, Insights and Forecast - by Component
- 10.2.1. Expression System
- 10.2.2. Cloning Vector
- 10.3. Market Analysis, Insights and Forecast - by Application
- 10.3.1. Food and Agriculture
- 10.3.2. Health and Disease
- 10.3.3. Environment
- 10.3.4. Other Applications
- 10.4. Market Analysis, Insights and Forecast - by End User
- 10.4.1. Biotechnology and Pharmaceutical Companies
- 10.4.2. Academic and Government Research Institutes
- 10.4.3. Other End Users
- 10.1. Market Analysis, Insights and Forecast - by Product
- 11. North America Recombinant DNA Technology Market Analysis, Insights and Forecast, 2019-2031
- 11.1. Market Analysis, Insights and Forecast - By Country/Sub-region
- 11.1.1 United States
- 11.1.2 Canada
- 11.1.3 Mexico
- 12. Europe Recombinant DNA Technology Market Analysis, Insights and Forecast, 2019-2031
- 12.1. Market Analysis, Insights and Forecast - By Country/Sub-region
- 12.1.1 Germany
- 12.1.2 United Kingdom
- 12.1.3 France
- 12.1.4 Italy
- 12.1.5 Spain
- 12.1.6 Rest of Europe
- 13. Asia Pacific Recombinant DNA Technology Market Analysis, Insights and Forecast, 2019-2031
- 13.1. Market Analysis, Insights and Forecast - By Country/Sub-region
- 13.1.1 China
- 13.1.2 Japan
- 13.1.3 India
- 13.1.4 Australia
- 13.1.5 South korea
- 13.1.6 Rest of Asia Pacific
- 14. Middle East and Africa Recombinant DNA Technology Market Analysis, Insights and Forecast, 2019-2031
- 14.1. Market Analysis, Insights and Forecast - By Country/Sub-region
- 14.1.1 GCC
- 14.1.2 South Africa
- 14.1.3 Rest of Middle East and Africa
- 15. South America Recombinant DNA Technology Market Analysis, Insights and Forecast, 2019-2031
- 15.1. Market Analysis, Insights and Forecast - By Country/Sub-region
- 15.1.1 Brazil
- 15.1.2 Argentina
- 15.1.3 Rest of South America
- 16. Competitive Analysis
- 16.1. Global Market Share Analysis 2024
- 16.2. Company Profiles
- 16.2.1 Horizon Discovery
- 16.2.1.1. Overview
- 16.2.1.2. Products
- 16.2.1.3. SWOT Analysis
- 16.2.1.4. Recent Developments
- 16.2.1.5. Financials (Based on Availability)
- 16.2.2 Merck KGaA
- 16.2.2.1. Overview
- 16.2.2.2. Products
- 16.2.2.3. SWOT Analysis
- 16.2.2.4. Recent Developments
- 16.2.2.5. Financials (Based on Availability)
- 16.2.3 Sanofi
- 16.2.3.1. Overview
- 16.2.3.2. Products
- 16.2.3.3. SWOT Analysis
- 16.2.3.4. Recent Developments
- 16.2.3.5. Financials (Based on Availability)
- 16.2.4 Novartis AG
- 16.2.4.1. Overview
- 16.2.4.2. Products
- 16.2.4.3. SWOT Analysis
- 16.2.4.4. Recent Developments
- 16.2.4.5. Financials (Based on Availability)
- 16.2.5 Amgen Inc
- 16.2.5.1. Overview
- 16.2.5.2. Products
- 16.2.5.3. SWOT Analysis
- 16.2.5.4. Recent Developments
- 16.2.5.5. Financials (Based on Availability)
- 16.2.6 Eli Lilly and Company
- 16.2.6.1. Overview
- 16.2.6.2. Products
- 16.2.6.3. SWOT Analysis
- 16.2.6.4. Recent Developments
- 16.2.6.5. Financials (Based on Availability)
- 16.2.7 New England Biolabs
- 16.2.7.1. Overview
- 16.2.7.2. Products
- 16.2.7.3. SWOT Analysis
- 16.2.7.4. Recent Developments
- 16.2.7.5. Financials (Based on Availability)
- 16.2.8 F Hoffmann-La Roche Ltd (Genentech Inc )
- 16.2.8.1. Overview
- 16.2.8.2. Products
- 16.2.8.3. SWOT Analysis
- 16.2.8.4. Recent Developments
- 16.2.8.5. Financials (Based on Availability)
- 16.2.9 GenScript
- 16.2.9.1. Overview
- 16.2.9.2. Products
- 16.2.9.3. SWOT Analysis
- 16.2.9.4. Recent Developments
- 16.2.9.5. Financials (Based on Availability)
- 16.2.10 Novo Nordisk A/S
- 16.2.10.1. Overview
- 16.2.10.2. Products
- 16.2.10.3. SWOT Analysis
- 16.2.10.4. Recent Developments
- 16.2.10.5. Financials (Based on Availability)
- 16.2.11 Syngene International Limited
- 16.2.11.1. Overview
- 16.2.11.2. Products
- 16.2.11.3. SWOT Analysis
- 16.2.11.4. Recent Developments
- 16.2.11.5. Financials (Based on Availability)
- 16.2.12 Pfizer Inc
- 16.2.12.1. Overview
- 16.2.12.2. Products
- 16.2.12.3. SWOT Analysis
- 16.2.12.4. Recent Developments
- 16.2.12.5. Financials (Based on Availability)
- 16.2.1 Horizon Discovery
List of Figures
- Figure 1: Global Recombinant DNA Technology Market Revenue Breakdown (Million, %) by Region 2024 & 2032
- Figure 2: Global Recombinant DNA Technology Market Volume Breakdown (K Unit, %) by Region 2024 & 2032
- Figure 3: North America Recombinant DNA Technology Market Revenue (Million), by Country 2024 & 2032
- Figure 4: North America Recombinant DNA Technology Market Volume (K Unit), by Country 2024 & 2032
- Figure 5: North America Recombinant DNA Technology Market Revenue Share (%), by Country 2024 & 2032
- Figure 6: North America Recombinant DNA Technology Market Volume Share (%), by Country 2024 & 2032
- Figure 7: Europe Recombinant DNA Technology Market Revenue (Million), by Country 2024 & 2032
- Figure 8: Europe Recombinant DNA Technology Market Volume (K Unit), by Country 2024 & 2032
- Figure 9: Europe Recombinant DNA Technology Market Revenue Share (%), by Country 2024 & 2032
- Figure 10: Europe Recombinant DNA Technology Market Volume Share (%), by Country 2024 & 2032
- Figure 11: Asia Pacific Recombinant DNA Technology Market Revenue (Million), by Country 2024 & 2032
- Figure 12: Asia Pacific Recombinant DNA Technology Market Volume (K Unit), by Country 2024 & 2032
- Figure 13: Asia Pacific Recombinant DNA Technology Market Revenue Share (%), by Country 2024 & 2032
- Figure 14: Asia Pacific Recombinant DNA Technology Market Volume Share (%), by Country 2024 & 2032
- Figure 15: Middle East and Africa Recombinant DNA Technology Market Revenue (Million), by Country 2024 & 2032
- Figure 16: Middle East and Africa Recombinant DNA Technology Market Volume (K Unit), by Country 2024 & 2032
- Figure 17: Middle East and Africa Recombinant DNA Technology Market Revenue Share (%), by Country 2024 & 2032
- Figure 18: Middle East and Africa Recombinant DNA Technology Market Volume Share (%), by Country 2024 & 2032
- Figure 19: South America Recombinant DNA Technology Market Revenue (Million), by Country 2024 & 2032
- Figure 20: South America Recombinant DNA Technology Market Volume (K Unit), by Country 2024 & 2032
- Figure 21: South America Recombinant DNA Technology Market Revenue Share (%), by Country 2024 & 2032
- Figure 22: South America Recombinant DNA Technology Market Volume Share (%), by Country 2024 & 2032
- Figure 23: North America Recombinant DNA Technology Market Revenue (Million), by Product 2024 & 2032
- Figure 24: North America Recombinant DNA Technology Market Volume (K Unit), by Product 2024 & 2032
- Figure 25: North America Recombinant DNA Technology Market Revenue Share (%), by Product 2024 & 2032
- Figure 26: North America Recombinant DNA Technology Market Volume Share (%), by Product 2024 & 2032
- Figure 27: North America Recombinant DNA Technology Market Revenue (Million), by Component 2024 & 2032
- Figure 28: North America Recombinant DNA Technology Market Volume (K Unit), by Component 2024 & 2032
- Figure 29: North America Recombinant DNA Technology Market Revenue Share (%), by Component 2024 & 2032
- Figure 30: North America Recombinant DNA Technology Market Volume Share (%), by Component 2024 & 2032
- Figure 31: North America Recombinant DNA Technology Market Revenue (Million), by Application 2024 & 2032
- Figure 32: North America Recombinant DNA Technology Market Volume (K Unit), by Application 2024 & 2032
- Figure 33: North America Recombinant DNA Technology Market Revenue Share (%), by Application 2024 & 2032
- Figure 34: North America Recombinant DNA Technology Market Volume Share (%), by Application 2024 & 2032
- Figure 35: North America Recombinant DNA Technology Market Revenue (Million), by End User 2024 & 2032
- Figure 36: North America Recombinant DNA Technology Market Volume (K Unit), by End User 2024 & 2032
- Figure 37: North America Recombinant DNA Technology Market Revenue Share (%), by End User 2024 & 2032
- Figure 38: North America Recombinant DNA Technology Market Volume Share (%), by End User 2024 & 2032
- Figure 39: North America Recombinant DNA Technology Market Revenue (Million), by Country 2024 & 2032
- Figure 40: North America Recombinant DNA Technology Market Volume (K Unit), by Country 2024 & 2032
- Figure 41: North America Recombinant DNA Technology Market Revenue Share (%), by Country 2024 & 2032
- Figure 42: North America Recombinant DNA Technology Market Volume Share (%), by Country 2024 & 2032
- Figure 43: Europe Recombinant DNA Technology Market Revenue (Million), by Product 2024 & 2032
- Figure 44: Europe Recombinant DNA Technology Market Volume (K Unit), by Product 2024 & 2032
- Figure 45: Europe Recombinant DNA Technology Market Revenue Share (%), by Product 2024 & 2032
- Figure 46: Europe Recombinant DNA Technology Market Volume Share (%), by Product 2024 & 2032
- Figure 47: Europe Recombinant DNA Technology Market Revenue (Million), by Component 2024 & 2032
- Figure 48: Europe Recombinant DNA Technology Market Volume (K Unit), by Component 2024 & 2032
- Figure 49: Europe Recombinant DNA Technology Market Revenue Share (%), by Component 2024 & 2032
- Figure 50: Europe Recombinant DNA Technology Market Volume Share (%), by Component 2024 & 2032
- Figure 51: Europe Recombinant DNA Technology Market Revenue (Million), by Application 2024 & 2032
- Figure 52: Europe Recombinant DNA Technology Market Volume (K Unit), by Application 2024 & 2032
- Figure 53: Europe Recombinant DNA Technology Market Revenue Share (%), by Application 2024 & 2032
- Figure 54: Europe Recombinant DNA Technology Market Volume Share (%), by Application 2024 & 2032
- Figure 55: Europe Recombinant DNA Technology Market Revenue (Million), by End User 2024 & 2032
- Figure 56: Europe Recombinant DNA Technology Market Volume (K Unit), by End User 2024 & 2032
- Figure 57: Europe Recombinant DNA Technology Market Revenue Share (%), by End User 2024 & 2032
- Figure 58: Europe Recombinant DNA Technology Market Volume Share (%), by End User 2024 & 2032
- Figure 59: Europe Recombinant DNA Technology Market Revenue (Million), by Country 2024 & 2032
- Figure 60: Europe Recombinant DNA Technology Market Volume (K Unit), by Country 2024 & 2032
- Figure 61: Europe Recombinant DNA Technology Market Revenue Share (%), by Country 2024 & 2032
- Figure 62: Europe Recombinant DNA Technology Market Volume Share (%), by Country 2024 & 2032
- Figure 63: Asia Pacific Recombinant DNA Technology Market Revenue (Million), by Product 2024 & 2032
- Figure 64: Asia Pacific Recombinant DNA Technology Market Volume (K Unit), by Product 2024 & 2032
- Figure 65: Asia Pacific Recombinant DNA Technology Market Revenue Share (%), by Product 2024 & 2032
- Figure 66: Asia Pacific Recombinant DNA Technology Market Volume Share (%), by Product 2024 & 2032
- Figure 67: Asia Pacific Recombinant DNA Technology Market Revenue (Million), by Component 2024 & 2032
- Figure 68: Asia Pacific Recombinant DNA Technology Market Volume (K Unit), by Component 2024 & 2032
- Figure 69: Asia Pacific Recombinant DNA Technology Market Revenue Share (%), by Component 2024 & 2032
- Figure 70: Asia Pacific Recombinant DNA Technology Market Volume Share (%), by Component 2024 & 2032
- Figure 71: Asia Pacific Recombinant DNA Technology Market Revenue (Million), by Application 2024 & 2032
- Figure 72: Asia Pacific Recombinant DNA Technology Market Volume (K Unit), by Application 2024 & 2032
- Figure 73: Asia Pacific Recombinant DNA Technology Market Revenue Share (%), by Application 2024 & 2032
- Figure 74: Asia Pacific Recombinant DNA Technology Market Volume Share (%), by Application 2024 & 2032
- Figure 75: Asia Pacific Recombinant DNA Technology Market Revenue (Million), by End User 2024 & 2032
- Figure 76: Asia Pacific Recombinant DNA Technology Market Volume (K Unit), by End User 2024 & 2032
- Figure 77: Asia Pacific Recombinant DNA Technology Market Revenue Share (%), by End User 2024 & 2032
- Figure 78: Asia Pacific Recombinant DNA Technology Market Volume Share (%), by End User 2024 & 2032
- Figure 79: Asia Pacific Recombinant DNA Technology Market Revenue (Million), by Country 2024 & 2032
- Figure 80: Asia Pacific Recombinant DNA Technology Market Volume (K Unit), by Country 2024 & 2032
- Figure 81: Asia Pacific Recombinant DNA Technology Market Revenue Share (%), by Country 2024 & 2032
- Figure 82: Asia Pacific Recombinant DNA Technology Market Volume Share (%), by Country 2024 & 2032
- Figure 83: Middle East and Africa Recombinant DNA Technology Market Revenue (Million), by Product 2024 & 2032
- Figure 84: Middle East and Africa Recombinant DNA Technology Market Volume (K Unit), by Product 2024 & 2032
- Figure 85: Middle East and Africa Recombinant DNA Technology Market Revenue Share (%), by Product 2024 & 2032
- Figure 86: Middle East and Africa Recombinant DNA Technology Market Volume Share (%), by Product 2024 & 2032
- Figure 87: Middle East and Africa Recombinant DNA Technology Market Revenue (Million), by Component 2024 & 2032
- Figure 88: Middle East and Africa Recombinant DNA Technology Market Volume (K Unit), by Component 2024 & 2032
- Figure 89: Middle East and Africa Recombinant DNA Technology Market Revenue Share (%), by Component 2024 & 2032
- Figure 90: Middle East and Africa Recombinant DNA Technology Market Volume Share (%), by Component 2024 & 2032
- Figure 91: Middle East and Africa Recombinant DNA Technology Market Revenue (Million), by Application 2024 & 2032
- Figure 92: Middle East and Africa Recombinant DNA Technology Market Volume (K Unit), by Application 2024 & 2032
- Figure 93: Middle East and Africa Recombinant DNA Technology Market Revenue Share (%), by Application 2024 & 2032
- Figure 94: Middle East and Africa Recombinant DNA Technology Market Volume Share (%), by Application 2024 & 2032
- Figure 95: Middle East and Africa Recombinant DNA Technology Market Revenue (Million), by End User 2024 & 2032
- Figure 96: Middle East and Africa Recombinant DNA Technology Market Volume (K Unit), by End User 2024 & 2032
- Figure 97: Middle East and Africa Recombinant DNA Technology Market Revenue Share (%), by End User 2024 & 2032
- Figure 98: Middle East and Africa Recombinant DNA Technology Market Volume Share (%), by End User 2024 & 2032
- Figure 99: Middle East and Africa Recombinant DNA Technology Market Revenue (Million), by Country 2024 & 2032
- Figure 100: Middle East and Africa Recombinant DNA Technology Market Volume (K Unit), by Country 2024 & 2032
- Figure 101: Middle East and Africa Recombinant DNA Technology Market Revenue Share (%), by Country 2024 & 2032
- Figure 102: Middle East and Africa Recombinant DNA Technology Market Volume Share (%), by Country 2024 & 2032
- Figure 103: South America Recombinant DNA Technology Market Revenue (Million), by Product 2024 & 2032
- Figure 104: South America Recombinant DNA Technology Market Volume (K Unit), by Product 2024 & 2032
- Figure 105: South America Recombinant DNA Technology Market Revenue Share (%), by Product 2024 & 2032
- Figure 106: South America Recombinant DNA Technology Market Volume Share (%), by Product 2024 & 2032
- Figure 107: South America Recombinant DNA Technology Market Revenue (Million), by Component 2024 & 2032
- Figure 108: South America Recombinant DNA Technology Market Volume (K Unit), by Component 2024 & 2032
- Figure 109: South America Recombinant DNA Technology Market Revenue Share (%), by Component 2024 & 2032
- Figure 110: South America Recombinant DNA Technology Market Volume Share (%), by Component 2024 & 2032
- Figure 111: South America Recombinant DNA Technology Market Revenue (Million), by Application 2024 & 2032
- Figure 112: South America Recombinant DNA Technology Market Volume (K Unit), by Application 2024 & 2032
- Figure 113: South America Recombinant DNA Technology Market Revenue Share (%), by Application 2024 & 2032
- Figure 114: South America Recombinant DNA Technology Market Volume Share (%), by Application 2024 & 2032
- Figure 115: South America Recombinant DNA Technology Market Revenue (Million), by End User 2024 & 2032
- Figure 116: South America Recombinant DNA Technology Market Volume (K Unit), by End User 2024 & 2032
- Figure 117: South America Recombinant DNA Technology Market Revenue Share (%), by End User 2024 & 2032
- Figure 118: South America Recombinant DNA Technology Market Volume Share (%), by End User 2024 & 2032
- Figure 119: South America Recombinant DNA Technology Market Revenue (Million), by Country 2024 & 2032
- Figure 120: South America Recombinant DNA Technology Market Volume (K Unit), by Country 2024 & 2032
- Figure 121: South America Recombinant DNA Technology Market Revenue Share (%), by Country 2024 & 2032
- Figure 122: South America Recombinant DNA Technology Market Volume Share (%), by Country 2024 & 2032
List of Tables
- Table 1: Global Recombinant DNA Technology Market Revenue Million Forecast, by Region 2019 & 2032
- Table 2: Global Recombinant DNA Technology Market Volume K Unit Forecast, by Region 2019 & 2032
- Table 3: Global Recombinant DNA Technology Market Revenue Million Forecast, by Product 2019 & 2032
- Table 4: Global Recombinant DNA Technology Market Volume K Unit Forecast, by Product 2019 & 2032
- Table 5: Global Recombinant DNA Technology Market Revenue Million Forecast, by Component 2019 & 2032
- Table 6: Global Recombinant DNA Technology Market Volume K Unit Forecast, by Component 2019 & 2032
- Table 7: Global Recombinant DNA Technology Market Revenue Million Forecast, by Application 2019 & 2032
- Table 8: Global Recombinant DNA Technology Market Volume K Unit Forecast, by Application 2019 & 2032
- Table 9: Global Recombinant DNA Technology Market Revenue Million Forecast, by End User 2019 & 2032
- Table 10: Global Recombinant DNA Technology Market Volume K Unit Forecast, by End User 2019 & 2032
- Table 11: Global Recombinant DNA Technology Market Revenue Million Forecast, by Region 2019 & 2032
- Table 12: Global Recombinant DNA Technology Market Volume K Unit Forecast, by Region 2019 & 2032
- Table 13: Global Recombinant DNA Technology Market Revenue Million Forecast, by Country 2019 & 2032
- Table 14: Global Recombinant DNA Technology Market Volume K Unit Forecast, by Country 2019 & 2032
- Table 15: United States Recombinant DNA Technology Market Revenue (Million) Forecast, by Application 2019 & 2032
- Table 16: United States Recombinant DNA Technology Market Volume (K Unit) Forecast, by Application 2019 & 2032
- Table 17: Canada Recombinant DNA Technology Market Revenue (Million) Forecast, by Application 2019 & 2032
- Table 18: Canada Recombinant DNA Technology Market Volume (K Unit) Forecast, by Application 2019 & 2032
- Table 19: Mexico Recombinant DNA Technology Market Revenue (Million) Forecast, by Application 2019 & 2032
- Table 20: Mexico Recombinant DNA Technology Market Volume (K Unit) Forecast, by Application 2019 & 2032
- Table 21: Global Recombinant DNA Technology Market Revenue Million Forecast, by Country 2019 & 2032
- Table 22: Global Recombinant DNA Technology Market Volume K Unit Forecast, by Country 2019 & 2032
- Table 23: Germany Recombinant DNA Technology Market Revenue (Million) Forecast, by Application 2019 & 2032
- Table 24: Germany Recombinant DNA Technology Market Volume (K Unit) Forecast, by Application 2019 & 2032
- Table 25: United Kingdom Recombinant DNA Technology Market Revenue (Million) Forecast, by Application 2019 & 2032
- Table 26: United Kingdom Recombinant DNA Technology Market Volume (K Unit) Forecast, by Application 2019 & 2032
- Table 27: France Recombinant DNA Technology Market Revenue (Million) Forecast, by Application 2019 & 2032
- Table 28: France Recombinant DNA Technology Market Volume (K Unit) Forecast, by Application 2019 & 2032
- Table 29: Italy Recombinant DNA Technology Market Revenue (Million) Forecast, by Application 2019 & 2032
- Table 30: Italy Recombinant DNA Technology Market Volume (K Unit) Forecast, by Application 2019 & 2032
- Table 31: Spain Recombinant DNA Technology Market Revenue (Million) Forecast, by Application 2019 & 2032
- Table 32: Spain Recombinant DNA Technology Market Volume (K Unit) Forecast, by Application 2019 & 2032
- Table 33: Rest of Europe Recombinant DNA Technology Market Revenue (Million) Forecast, by Application 2019 & 2032
- Table 34: Rest of Europe Recombinant DNA Technology Market Volume (K Unit) Forecast, by Application 2019 & 2032
- Table 35: Global Recombinant DNA Technology Market Revenue Million Forecast, by Country 2019 & 2032
- Table 36: Global Recombinant DNA Technology Market Volume K Unit Forecast, by Country 2019 & 2032
- Table 37: China Recombinant DNA Technology Market Revenue (Million) Forecast, by Application 2019 & 2032
- Table 38: China Recombinant DNA Technology Market Volume (K Unit) Forecast, by Application 2019 & 2032
- Table 39: Japan Recombinant DNA Technology Market Revenue (Million) Forecast, by Application 2019 & 2032
- Table 40: Japan Recombinant DNA Technology Market Volume (K Unit) Forecast, by Application 2019 & 2032
- Table 41: India Recombinant DNA Technology Market Revenue (Million) Forecast, by Application 2019 & 2032
- Table 42: India Recombinant DNA Technology Market Volume (K Unit) Forecast, by Application 2019 & 2032
- Table 43: Australia Recombinant DNA Technology Market Revenue (Million) Forecast, by Application 2019 & 2032
- Table 44: Australia Recombinant DNA Technology Market Volume (K Unit) Forecast, by Application 2019 & 2032
- Table 45: South korea Recombinant DNA Technology Market Revenue (Million) Forecast, by Application 2019 & 2032
- Table 46: South korea Recombinant DNA Technology Market Volume (K Unit) Forecast, by Application 2019 & 2032
- Table 47: Rest of Asia Pacific Recombinant DNA Technology Market Revenue (Million) Forecast, by Application 2019 & 2032
- Table 48: Rest of Asia Pacific Recombinant DNA Technology Market Volume (K Unit) Forecast, by Application 2019 & 2032
- Table 49: Global Recombinant DNA Technology Market Revenue Million Forecast, by Country 2019 & 2032
- Table 50: Global Recombinant DNA Technology Market Volume K Unit Forecast, by Country 2019 & 2032
- Table 51: GCC Recombinant DNA Technology Market Revenue (Million) Forecast, by Application 2019 & 2032
- Table 52: GCC Recombinant DNA Technology Market Volume (K Unit) Forecast, by Application 2019 & 2032
- Table 53: South Africa Recombinant DNA Technology Market Revenue (Million) Forecast, by Application 2019 & 2032
- Table 54: South Africa Recombinant DNA Technology Market Volume (K Unit) Forecast, by Application 2019 & 2032
- Table 55: Rest of Middle East and Africa Recombinant DNA Technology Market Revenue (Million) Forecast, by Application 2019 & 2032
- Table 56: Rest of Middle East and Africa Recombinant DNA Technology Market Volume (K Unit) Forecast, by Application 2019 & 2032
- Table 57: Global Recombinant DNA Technology Market Revenue Million Forecast, by Country 2019 & 2032
- Table 58: Global Recombinant DNA Technology Market Volume K Unit Forecast, by Country 2019 & 2032
- Table 59: Brazil Recombinant DNA Technology Market Revenue (Million) Forecast, by Application 2019 & 2032
- Table 60: Brazil Recombinant DNA Technology Market Volume (K Unit) Forecast, by Application 2019 & 2032
- Table 61: Argentina Recombinant DNA Technology Market Revenue (Million) Forecast, by Application 2019 & 2032
- Table 62: Argentina Recombinant DNA Technology Market Volume (K Unit) Forecast, by Application 2019 & 2032
- Table 63: Rest of South America Recombinant DNA Technology Market Revenue (Million) Forecast, by Application 2019 & 2032
- Table 64: Rest of South America Recombinant DNA Technology Market Volume (K Unit) Forecast, by Application 2019 & 2032
- Table 65: Global Recombinant DNA Technology Market Revenue Million Forecast, by Product 2019 & 2032
- Table 66: Global Recombinant DNA Technology Market Volume K Unit Forecast, by Product 2019 & 2032
- Table 67: Global Recombinant DNA Technology Market Revenue Million Forecast, by Component 2019 & 2032
- Table 68: Global Recombinant DNA Technology Market Volume K Unit Forecast, by Component 2019 & 2032
- Table 69: Global Recombinant DNA Technology Market Revenue Million Forecast, by Application 2019 & 2032
- Table 70: Global Recombinant DNA Technology Market Volume K Unit Forecast, by Application 2019 & 2032
- Table 71: Global Recombinant DNA Technology Market Revenue Million Forecast, by End User 2019 & 2032
- Table 72: Global Recombinant DNA Technology Market Volume K Unit Forecast, by End User 2019 & 2032
- Table 73: Global Recombinant DNA Technology Market Revenue Million Forecast, by Country 2019 & 2032
- Table 74: Global Recombinant DNA Technology Market Volume K Unit Forecast, by Country 2019 & 2032
- Table 75: United States Recombinant DNA Technology Market Revenue (Million) Forecast, by Application 2019 & 2032
- Table 76: United States Recombinant DNA Technology Market Volume (K Unit) Forecast, by Application 2019 & 2032
- Table 77: Canada Recombinant DNA Technology Market Revenue (Million) Forecast, by Application 2019 & 2032
- Table 78: Canada Recombinant DNA Technology Market Volume (K Unit) Forecast, by Application 2019 & 2032
- Table 79: Mexico Recombinant DNA Technology Market Revenue (Million) Forecast, by Application 2019 & 2032
- Table 80: Mexico Recombinant DNA Technology Market Volume (K Unit) Forecast, by Application 2019 & 2032
- Table 81: Global Recombinant DNA Technology Market Revenue Million Forecast, by Product 2019 & 2032
- Table 82: Global Recombinant DNA Technology Market Volume K Unit Forecast, by Product 2019 & 2032
- Table 83: Global Recombinant DNA Technology Market Revenue Million Forecast, by Component 2019 & 2032
- Table 84: Global Recombinant DNA Technology Market Volume K Unit Forecast, by Component 2019 & 2032
- Table 85: Global Recombinant DNA Technology Market Revenue Million Forecast, by Application 2019 & 2032
- Table 86: Global Recombinant DNA Technology Market Volume K Unit Forecast, by Application 2019 & 2032
- Table 87: Global Recombinant DNA Technology Market Revenue Million Forecast, by End User 2019 & 2032
- Table 88: Global Recombinant DNA Technology Market Volume K Unit Forecast, by End User 2019 & 2032
- Table 89: Global Recombinant DNA Technology Market Revenue Million Forecast, by Country 2019 & 2032
- Table 90: Global Recombinant DNA Technology Market Volume K Unit Forecast, by Country 2019 & 2032
- Table 91: Germany Recombinant DNA Technology Market Revenue (Million) Forecast, by Application 2019 & 2032
- Table 92: Germany Recombinant DNA Technology Market Volume (K Unit) Forecast, by Application 2019 & 2032
- Table 93: United Kingdom Recombinant DNA Technology Market Revenue (Million) Forecast, by Application 2019 & 2032
- Table 94: United Kingdom Recombinant DNA Technology Market Volume (K Unit) Forecast, by Application 2019 & 2032
- Table 95: France Recombinant DNA Technology Market Revenue (Million) Forecast, by Application 2019 & 2032
- Table 96: France Recombinant DNA Technology Market Volume (K Unit) Forecast, by Application 2019 & 2032
- Table 97: Italy Recombinant DNA Technology Market Revenue (Million) Forecast, by Application 2019 & 2032
- Table 98: Italy Recombinant DNA Technology Market Volume (K Unit) Forecast, by Application 2019 & 2032
- Table 99: Spain Recombinant DNA Technology Market Revenue (Million) Forecast, by Application 2019 & 2032
- Table 100: Spain Recombinant DNA Technology Market Volume (K Unit) Forecast, by Application 2019 & 2032
- Table 101: Rest of Europe Recombinant DNA Technology Market Revenue (Million) Forecast, by Application 2019 & 2032
- Table 102: Rest of Europe Recombinant DNA Technology Market Volume (K Unit) Forecast, by Application 2019 & 2032
- Table 103: Global Recombinant DNA Technology Market Revenue Million Forecast, by Product 2019 & 2032
- Table 104: Global Recombinant DNA Technology Market Volume K Unit Forecast, by Product 2019 & 2032
- Table 105: Global Recombinant DNA Technology Market Revenue Million Forecast, by Component 2019 & 2032
- Table 106: Global Recombinant DNA Technology Market Volume K Unit Forecast, by Component 2019 & 2032
- Table 107: Global Recombinant DNA Technology Market Revenue Million Forecast, by Application 2019 & 2032
- Table 108: Global Recombinant DNA Technology Market Volume K Unit Forecast, by Application 2019 & 2032
- Table 109: Global Recombinant DNA Technology Market Revenue Million Forecast, by End User 2019 & 2032
- Table 110: Global Recombinant DNA Technology Market Volume K Unit Forecast, by End User 2019 & 2032
- Table 111: Global Recombinant DNA Technology Market Revenue Million Forecast, by Country 2019 & 2032
- Table 112: Global Recombinant DNA Technology Market Volume K Unit Forecast, by Country 2019 & 2032
- Table 113: China Recombinant DNA Technology Market Revenue (Million) Forecast, by Application 2019 & 2032
- Table 114: China Recombinant DNA Technology Market Volume (K Unit) Forecast, by Application 2019 & 2032
- Table 115: Japan Recombinant DNA Technology Market Revenue (Million) Forecast, by Application 2019 & 2032
- Table 116: Japan Recombinant DNA Technology Market Volume (K Unit) Forecast, by Application 2019 & 2032
- Table 117: India Recombinant DNA Technology Market Revenue (Million) Forecast, by Application 2019 & 2032
- Table 118: India Recombinant DNA Technology Market Volume (K Unit) Forecast, by Application 2019 & 2032
- Table 119: Australia Recombinant DNA Technology Market Revenue (Million) Forecast, by Application 2019 & 2032
- Table 120: Australia Recombinant DNA Technology Market Volume (K Unit) Forecast, by Application 2019 & 2032
- Table 121: South korea Recombinant DNA Technology Market Revenue (Million) Forecast, by Application 2019 & 2032
- Table 122: South korea Recombinant DNA Technology Market Volume (K Unit) Forecast, by Application 2019 & 2032
- Table 123: Rest of Asia Pacific Recombinant DNA Technology Market Revenue (Million) Forecast, by Application 2019 & 2032
- Table 124: Rest of Asia Pacific Recombinant DNA Technology Market Volume (K Unit) Forecast, by Application 2019 & 2032
- Table 125: Global Recombinant DNA Technology Market Revenue Million Forecast, by Product 2019 & 2032
- Table 126: Global Recombinant DNA Technology Market Volume K Unit Forecast, by Product 2019 & 2032
- Table 127: Global Recombinant DNA Technology Market Revenue Million Forecast, by Component 2019 & 2032
- Table 128: Global Recombinant DNA Technology Market Volume K Unit Forecast, by Component 2019 & 2032
- Table 129: Global Recombinant DNA Technology Market Revenue Million Forecast, by Application 2019 & 2032
- Table 130: Global Recombinant DNA Technology Market Volume K Unit Forecast, by Application 2019 & 2032
- Table 131: Global Recombinant DNA Technology Market Revenue Million Forecast, by End User 2019 & 2032
- Table 132: Global Recombinant DNA Technology Market Volume K Unit Forecast, by End User 2019 & 2032
- Table 133: Global Recombinant DNA Technology Market Revenue Million Forecast, by Country 2019 & 2032
- Table 134: Global Recombinant DNA Technology Market Volume K Unit Forecast, by Country 2019 & 2032
- Table 135: GCC Recombinant DNA Technology Market Revenue (Million) Forecast, by Application 2019 & 2032
- Table 136: GCC Recombinant DNA Technology Market Volume (K Unit) Forecast, by Application 2019 & 2032
- Table 137: South Africa Recombinant DNA Technology Market Revenue (Million) Forecast, by Application 2019 & 2032
- Table 138: South Africa Recombinant DNA Technology Market Volume (K Unit) Forecast, by Application 2019 & 2032
- Table 139: Rest of Middle East and Africa Recombinant DNA Technology Market Revenue (Million) Forecast, by Application 2019 & 2032
- Table 140: Rest of Middle East and Africa Recombinant DNA Technology Market Volume (K Unit) Forecast, by Application 2019 & 2032
- Table 141: Global Recombinant DNA Technology Market Revenue Million Forecast, by Product 2019 & 2032
- Table 142: Global Recombinant DNA Technology Market Volume K Unit Forecast, by Product 2019 & 2032
- Table 143: Global Recombinant DNA Technology Market Revenue Million Forecast, by Component 2019 & 2032
- Table 144: Global Recombinant DNA Technology Market Volume K Unit Forecast, by Component 2019 & 2032
- Table 145: Global Recombinant DNA Technology Market Revenue Million Forecast, by Application 2019 & 2032
- Table 146: Global Recombinant DNA Technology Market Volume K Unit Forecast, by Application 2019 & 2032
- Table 147: Global Recombinant DNA Technology Market Revenue Million Forecast, by End User 2019 & 2032
- Table 148: Global Recombinant DNA Technology Market Volume K Unit Forecast, by End User 2019 & 2032
- Table 149: Global Recombinant DNA Technology Market Revenue Million Forecast, by Country 2019 & 2032
- Table 150: Global Recombinant DNA Technology Market Volume K Unit Forecast, by Country 2019 & 2032
- Table 151: Brazil Recombinant DNA Technology Market Revenue (Million) Forecast, by Application 2019 & 2032
- Table 152: Brazil Recombinant DNA Technology Market Volume (K Unit) Forecast, by Application 2019 & 2032
- Table 153: Argentina Recombinant DNA Technology Market Revenue (Million) Forecast, by Application 2019 & 2032
- Table 154: Argentina Recombinant DNA Technology Market Volume (K Unit) Forecast, by Application 2019 & 2032
- Table 155: Rest of South America Recombinant DNA Technology Market Revenue (Million) Forecast, by Application 2019 & 2032
- Table 156: Rest of South America Recombinant DNA Technology Market Volume (K Unit) Forecast, by Application 2019 & 2032
Frequently Asked Questions
1. What is the projected Compound Annual Growth Rate (CAGR) of the Recombinant DNA Technology Market?
The projected CAGR is approximately 6.80%.
2. Which companies are prominent players in the Recombinant DNA Technology Market?
Key companies in the market include Horizon Discovery, Merck KGaA, Sanofi, Novartis AG, Amgen Inc, Eli Lilly and Company, New England Biolabs, F Hoffmann-La Roche Ltd (Genentech Inc ), GenScript, Novo Nordisk A/S, Syngene International Limited, Pfizer Inc.
3. What are the main segments of the Recombinant DNA Technology Market?
The market segments include Product, Component, Application, End User.
4. Can you provide details about the market size?
The market size is estimated to be USD XX Million as of 2022.
5. What are some drivers contributing to market growth?
Technological Advancements in Genomics; Expansion of Biopharmaceutical Industry; Increasing Demand and Applications of Recombinant/ Genetically Modified Products.
6. What are the notable trends driving market growth?
The Food and Agriculture Segment is Expected to Register the High CAGR Over the Forecast Period.
7. Are there any restraints impacting market growth?
Regulatory. Scientific. and Ethical Challenges Associated with Gene Therapy.
8. Can you provide examples of recent developments in the market?
In March 2022, VBI Vaccines Inc. launched PreHevbrio (Recombinant Hepatitis B Vaccine) in the United States for the prevention of infection caused by all known subtypes of hepatitis B virus (HBV) in adults age 18 years and older.
9. What pricing options are available for accessing the report?
Pricing options include single-user, multi-user, and enterprise licenses priced at USD 4750, USD 5250, and USD 8750 respectively.
10. Is the market size provided in terms of value or volume?
The market size is provided in terms of value, measured in Million and volume, measured in K Unit.
11. Are there any specific market keywords associated with the report?
Yes, the market keyword associated with the report is "Recombinant DNA Technology Market," which aids in identifying and referencing the specific market segment covered.
12. How do I determine which pricing option suits my needs best?
The pricing options vary based on user requirements and access needs. Individual users may opt for single-user licenses, while businesses requiring broader access may choose multi-user or enterprise licenses for cost-effective access to the report.
13. Are there any additional resources or data provided in the Recombinant DNA Technology Market report?
While the report offers comprehensive insights, it's advisable to review the specific contents or supplementary materials provided to ascertain if additional resources or data are available.
14. How can I stay updated on further developments or reports in the Recombinant DNA Technology Market?
To stay informed about further developments, trends, and reports in the Recombinant DNA Technology Market, consider subscribing to industry newsletters, following relevant companies and organizations, or regularly checking reputable industry news sources and publications.
Methodology
Step 1 - Identification of Relevant Samples Size from Population Database


Step 2 - Approaches for Defining Global Market Size (Value, Volume* & Price*)

Note*: In applicable scenarios
Step 3 - Data Sources
Primary Research
- Web Analytics
- Survey Reports
- Research Institute
- Latest Research Reports
- Opinion Leaders
Secondary Research
- Annual Reports
- White Paper
- Latest Press Release
- Industry Association
- Paid Database
- Investor Presentations

Step 4 - Data Triangulation
Involves using different sources of information in order to increase the validity of a study
These sources are likely to be stakeholders in a program - participants, other researchers, program staff, other community members, and so on.
Then we put all data in single framework & apply various statistical tools to find out the dynamic on the market.
During the analysis stage, feedback from the stakeholder groups would be compared to determine areas of agreement as well as areas of divergence


