

Key Insights
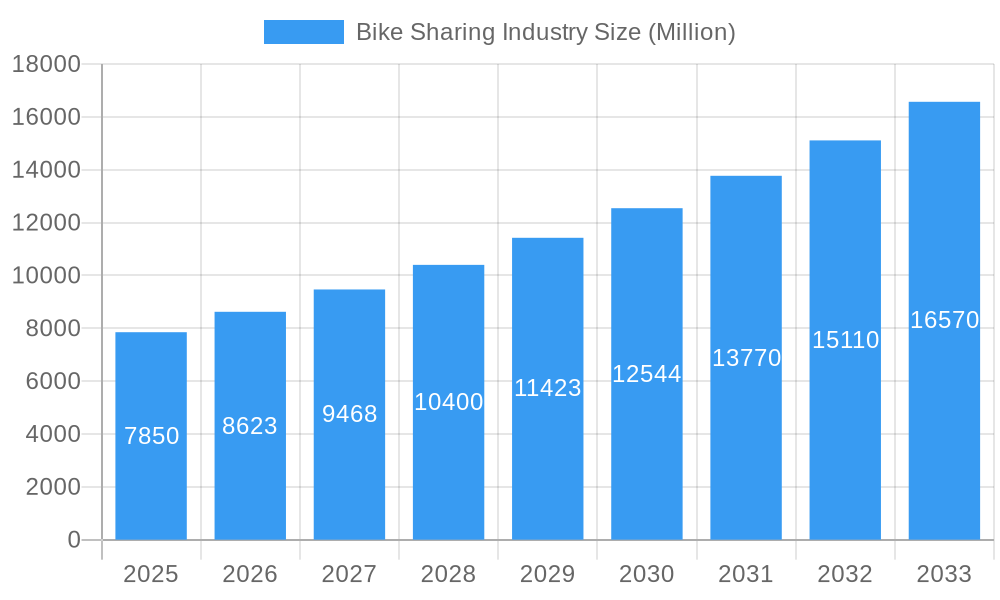
The global bike-sharing market, valued at $7.85 billion in 2025, is projected to experience robust growth, driven by increasing urbanization, growing environmental consciousness, and the rising popularity of micromobility solutions. The market's Compound Annual Growth Rate (CAGR) of 9.65% from 2025 to 2033 indicates significant expansion potential. Several factors contribute to this growth. The rise of e-bikes, offering extended range and convenience, is a major driver, expanding the appeal beyond short-distance commutes. Technological advancements in dockless systems, enhancing user experience and operational efficiency, are also fueling market expansion. Furthermore, initiatives promoting sustainable transportation and reducing carbon emissions are bolstering adoption rates in various regions. The segmentation of the market into traditional bikes, e-bikes, and sharing systems (docked and dockless) reflects the diverse options available to consumers, catering to various preferences and needs. Key players like JCDecaux Group, Didi Chuxing, and Uber are actively shaping the market landscape through strategic investments and technological innovations.
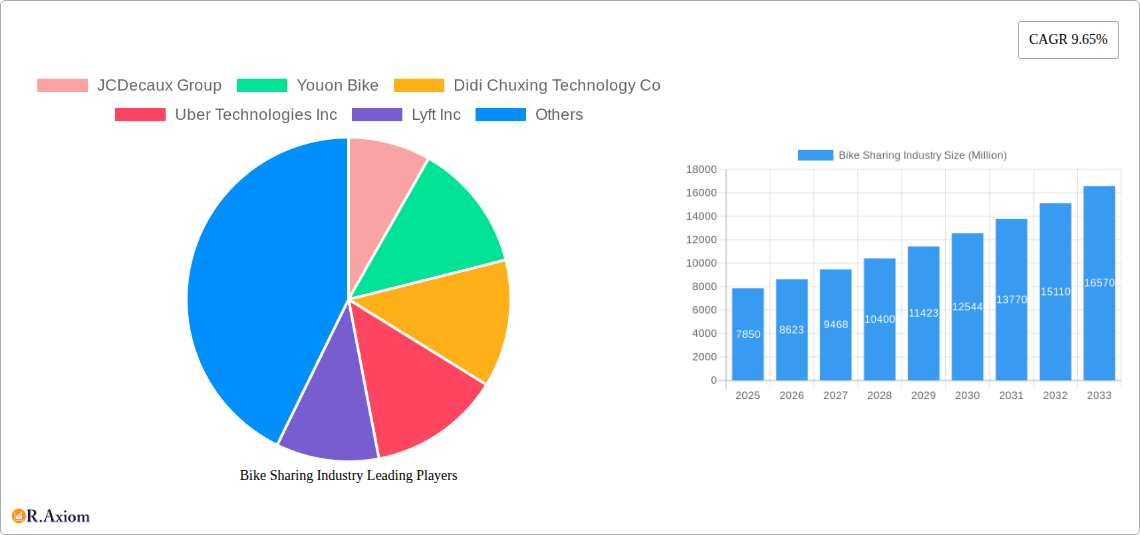
Bike Sharing Industry Market Size (In Billion)
Geographical distribution reveals significant regional variations. While Asia Pacific, with its high population density and rapidly developing urban centers, is expected to dominate the market, North America and Europe are also witnessing substantial growth, driven by increasing investments in sustainable urban infrastructure and the popularity of bike-sharing programs. The market faces some challenges, including regulatory hurdles in some regions, concerns about bike safety and vandalism, and the need for sustainable operational models. However, technological innovation and evolving business strategies are likely to mitigate these challenges. The forecast period, 2025-2033, promises continued growth, driven by ongoing technological advancements, increasing urban populations, and the growing emphasis on environmentally friendly transportation solutions.
Bike Sharing Industry Company Market Share
Bike Sharing Industry: A Comprehensive Market Report (2019-2033)
This detailed report provides a comprehensive analysis of the global bike-sharing industry, offering invaluable insights for industry stakeholders, investors, and strategists. With a study period spanning 2019-2033, a base year of 2025, and a forecast period of 2025-2033, this report leverages historical data (2019-2024) to project future market trends and growth potential. The report delves into market segmentation, analyzing traditional and e-bikes within docked and dockless sharing systems, identifying key players, and uncovering emerging opportunities. Expected market value projections are included throughout, though some values are unavailable for specific years and will be marked as "xx Million" until the full report is complete.
Bike Sharing Industry Market Concentration & Innovation
This section analyzes the competitive landscape of the bike-sharing industry, exploring market concentration, innovation drivers, regulatory influences, and market dynamics. Key aspects include the analysis of Mergers & Acquisitions (M&A) activities and their impact on market share. While precise market share figures for each company require further detailed investigation, the following provides a preliminary assessment. The report will include a more detailed analysis.
Market Concentration: The bike-sharing market exhibits a moderately concentrated structure, with a few major players holding significant market share, particularly in established markets. However, regional variations exist, with a greater level of fragmentation in developing markets. The report will analyze concentration ratios to pinpoint the level of market dominance.
Innovation Drivers: Innovation is crucial for this sector. The emergence of e-bikes, improved mobile applications, and innovative sharing models (e.g., subscription services) significantly drives market growth. Smart bike technology, integrating GPS tracking and theft prevention features, also represents a major innovation.
Regulatory Frameworks: Varying regulations across different regions significantly impact industry development. Some areas have robust regulations governing bike-sharing operations, impacting pricing, infrastructure requirements, and safety measures. Other areas may have lax regulatory environments. The report will analyze the impact of these varying legal frameworks.
Product Substitutes: Competition exists from other micro-mobility solutions such as e-scooters, ride-hailing services (Uber, Lyft), and public transport. The report will quantify the competitive pressure stemming from these substitutes.
End-User Trends: Growing environmental consciousness, concerns about traffic congestion, and the desire for convenient last-mile connectivity fuel the increasing adoption of bike-sharing services. This trend is further propelled by increasing urbanization in many parts of the world.
M&A Activities: Significant M&A activity has been observed in the industry. For example, while the exact deal values are not available at this stage, consolidation within the market through acquisitions can help companies achieve economies of scale and expand their geographic reach. The report will include a detailed breakdown of all observed M&A activity, including deal values where available.
Bike Sharing Industry Industry Trends & Insights
This section explores the dynamic trends and insights shaping the bike-sharing industry. Key considerations will include market growth projections, technological advancement, consumer behavior, and competitive strategies. While specific figures will be detailed in the full report, we can anticipate the following key trends:
The global bike-sharing market is projected to witness a Compound Annual Growth Rate (CAGR) of xx% during the forecast period (2025-2033). This growth is driven by various factors, including the expanding adoption of e-bikes, increasing urbanization, and growing environmental awareness. Technological advancements in bike design, battery technology, and mobile applications also contribute to market expansion. Consumer preferences are shifting towards convenient, affordable, and sustainable transportation options, benefiting the bike-sharing industry. The competitive dynamics within the industry are highly dynamic, characterized by fierce competition amongst established players and the continuous emergence of new entrants. Market penetration is expected to increase significantly, especially in developing urban areas. The full report will provide a detailed analysis of specific numbers and metrics.
Dominant Markets & Segments in Bike Sharing Industry
This section identifies the leading regions, countries, and market segments within the bike-sharing industry. The market's expansion is heavily influenced by government initiatives, investments in cycling infrastructure, and consumer preferences.
Leading Regions/Countries: While specific dominance will be detailed in the final report, key regions are expected to include major urban centers across Europe, North America, and Asia-Pacific, with potential for rapid growth in developing economies with high population densities and developing transportation infrastructure.
Dominant Segments: The report will detail the market share and growth prospects for each segment:
Bike Type: E-bikes are projected to demonstrate faster growth compared to traditional bikes due to their increased convenience and range. However, traditional bikes will still retain a significant market share due to lower costs.
Sharing System: Dockless systems are expected to maintain a larger market share due to their flexibility and convenience, although docked systems remain prevalent in certain regions due to management and security advantages.
Key Drivers (by segment):
E-bikes: Technological advancements, government incentives for sustainable transport, and increasing consumer preference for assisted cycling.
Traditional Bikes: Lower cost, simpler maintenance, and suitability for shorter distances.
Dockless Systems: Convenience, flexibility, and wider area coverage.
Docked Systems: Enhanced security, easier bike maintenance and management, and potential for integration with public transportation.
The report will include a detailed analysis of each segment's dominant factors and projections.
Bike Sharing Industry Product Developments
The bike-sharing industry is witnessing continuous product innovations. E-bike advancements include improved battery technology, increased range, and enhanced safety features. Smart locks, GPS tracking, and integrated mobile applications enhance security and user experience. Technological integration aims to improve overall system efficiency and provide valuable data-driven insights. Product development focuses on improving cost-effectiveness, durability, and user satisfaction.
Report Scope & Segmentation Analysis
This report segments the bike-sharing market based on bike type (traditional/regular bikes, e-bikes) and sharing system (docked, dockless). Each segment is analyzed considering its market size, growth projections, and competitive dynamics. Projected market sizes for each segment will be available in the complete report, expressed in millions of dollars. The report will also include a detailed competitive analysis of the leading players within each segment.
Key Drivers of Bike Sharing Industry Growth
Several factors propel the growth of the bike-sharing industry. Technological advancements (e.g., improved e-bike battery technology, smart locking mechanisms), supportive government policies (e.g., subsidies, infrastructure investments), and increasing urbanization are key drivers. Additionally, growing consumer awareness of environmental sustainability and the convenience of bike-sharing contribute significantly to market expansion.
Challenges in the Bike Sharing Industry Sector
The bike-sharing industry faces numerous challenges. Regulatory hurdles, including permit requirements and operational regulations, can impede expansion. Supply chain issues can affect the availability of bikes and components. Furthermore, intense competition from other micro-mobility solutions and the risk of vandalism and theft pose significant operational challenges. The report will quantify the financial impact of these issues whenever possible.
Emerging Opportunities in Bike Sharing Industry
The bike-sharing industry presents several promising opportunities. Expanding into underserved markets, especially in developing countries, offers significant growth potential. Integrating bike-sharing with other micro-mobility solutions or public transportation networks can enhance convenience and create synergistic opportunities. Exploring new business models, such as subscription services, will further capitalize on evolving user needs and preferences.
Leading Players in the Bike Sharing Industry Market
- JCDecaux Group
- Youon Bike
- Didi Chuxing Technology Co
- Uber Technologies Inc
- Lyft Inc
- Bluegogo
- Hellobike
- Meituan Bik
- Bird Rides Inc
- Neutron Holdings Inc
Key Developments in Bike Sharing Industry Industry
March 2023: MYBYK launched two electric bicycle variants, the MYBYK Electric and MYBYK Electric Cargo, impacting the e-bike segment and last-mile delivery solutions.
March 2023: Brighton and Hove's partnership with Beryl to launch a bike-sharing scheme expanded the market presence in the UK.
December 2023: The USD 23 Million investment in Tembici by the DFC and IDB Invest signifies substantial growth opportunities in Latin America.
Strategic Outlook for Bike Sharing Industry Market
The bike-sharing market exhibits strong future potential driven by technological advancements, supportive government policies, and rising environmental awareness. The industry's growth is expected to continue, particularly in developing urban areas. Expanding into new markets, focusing on sustainable and innovative solutions, and leveraging technological advancements will be crucial for capturing the emerging opportunities within this dynamic industry. The report will offer specific predictions regarding future market size and growth potential.
Bike Sharing Industry Segmentation
-
1. Bike
- 1.1. Traditional/Regular Bike
- 1.2. E-bike
-
2. Sharing System
- 2.1. Docked
- 2.2. Dockless
Bike Sharing Industry Segmentation By Geography
- 1. North America
- 2. Europe
- 3. Asia Pacific
- 4. Rest of the World
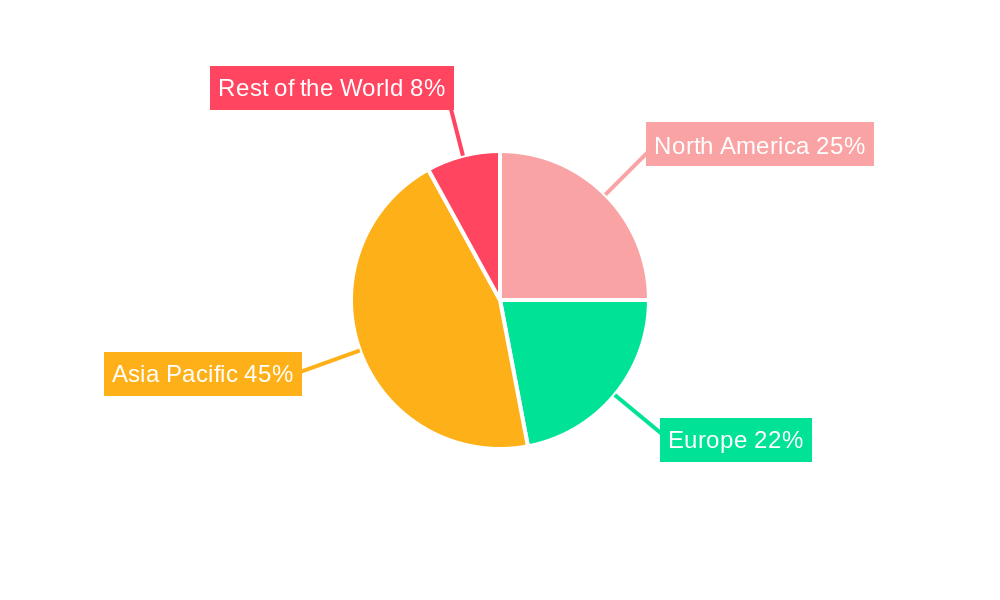
Bike Sharing Industry Regional Market Share
Geographic Coverage of Bike Sharing Industry
Bike Sharing Industry REPORT HIGHLIGHTS
| Aspects | Details |
|---|---|
| Study Period | 2020-2034 |
| Base Year | 2025 |
| Estimated Year | 2026 |
| Forecast Period | 2026-2034 |
| Historical Period | 2020-2025 |
| Growth Rate | CAGR of 9.65% from 2020-2034 |
| Segmentation |
|
Table of Contents
- 1. Introduction
- 1.1. Research Scope
- 1.2. Market Segmentation
- 1.3. Research Objective
- 1.4. Definitions and Assumptions
- 2. Executive Summary
- 2.1. Market Snapshot
- 3. Market Dynamics
- 3.1. Market Drivers
- 3.2. Market Restrains
- 3.3. Market Trends
- 3.4. Market Opportunities
- 4. Market Factor Analysis
- 4.1. Porters Five Forces
- 4.1.1. Bargaining Power of Suppliers
- 4.1.2. Bargaining Power of Buyers
- 4.1.3. Threat of New Entrants
- 4.1.4. Threat of Substitutes
- 4.1.5. Competitive Rivalry
- 4.2. PESTEL analysis
- 4.3. BCG Analysis
- 4.3.1. Stars (High Growth, High Market Share)
- 4.3.2. Cash Cows (Low Growth, High Market Share)
- 4.3.3. Question Mark (High Growth, Low Market Share)
- 4.3.4. Dogs (Low Growth, Low Market Share)
- 4.4. Ansoff Matrix Analysis
- 4.5. Supply Chain Analysis
- 4.6. Regulatory Landscape
- 4.7. Current Market Potential and Opportunity Assessment (TAM–SAM–SOM Framework)
- 4.8. RAX Analyst Note
- 4.1. Porters Five Forces
- 5. Market Analysis, Insights and Forecast 2021-2033
- 5.1. Market Analysis, Insights and Forecast - by Bike
- 5.1.1. Traditional/Regular Bike
- 5.1.2. E-bike
- 5.2. Market Analysis, Insights and Forecast - by Sharing System
- 5.2.1. Docked
- 5.2.2. Dockless
- 5.3. Market Analysis, Insights and Forecast - by Region
- 5.3.1. North America
- 5.3.2. Europe
- 5.3.3. Asia Pacific
- 5.3.4. Rest of the World
- 5.1. Market Analysis, Insights and Forecast - by Bike
- 6. Global Bike Sharing Industry Analysis, Insights and Forecast, 2021-2033
- 6.1. Market Analysis, Insights and Forecast - by Bike
- 6.1.1. Traditional/Regular Bike
- 6.1.2. E-bike
- 6.2. Market Analysis, Insights and Forecast - by Sharing System
- 6.2.1. Docked
- 6.2.2. Dockless
- 6.1. Market Analysis, Insights and Forecast - by Bike
- 7. North America Bike Sharing Industry Analysis, Insights and Forecast, 2020-2032
- 7.1. Market Analysis, Insights and Forecast - by Bike
- 7.1.1. Traditional/Regular Bike
- 7.1.2. E-bike
- 7.2. Market Analysis, Insights and Forecast - by Sharing System
- 7.2.1. Docked
- 7.2.2. Dockless
- 7.1. Market Analysis, Insights and Forecast - by Bike
- 8. Europe Bike Sharing Industry Analysis, Insights and Forecast, 2020-2032
- 8.1. Market Analysis, Insights and Forecast - by Bike
- 8.1.1. Traditional/Regular Bike
- 8.1.2. E-bike
- 8.2. Market Analysis, Insights and Forecast - by Sharing System
- 8.2.1. Docked
- 8.2.2. Dockless
- 8.1. Market Analysis, Insights and Forecast - by Bike
- 9. Asia Pacific Bike Sharing Industry Analysis, Insights and Forecast, 2020-2032
- 9.1. Market Analysis, Insights and Forecast - by Bike
- 9.1.1. Traditional/Regular Bike
- 9.1.2. E-bike
- 9.2. Market Analysis, Insights and Forecast - by Sharing System
- 9.2.1. Docked
- 9.2.2. Dockless
- 9.1. Market Analysis, Insights and Forecast - by Bike
- 10. Rest of the World Bike Sharing Industry Analysis, Insights and Forecast, 2020-2032
- 10.1. Market Analysis, Insights and Forecast - by Bike
- 10.1.1. Traditional/Regular Bike
- 10.1.2. E-bike
- 10.2. Market Analysis, Insights and Forecast - by Sharing System
- 10.2.1. Docked
- 10.2.2. Dockless
- 10.1. Market Analysis, Insights and Forecast - by Bike
- 11. Competitive Analysis
- 11.1. Company Profiles
- 11.1.1 JCDecaux Group
- 11.1.1.1. Company Overview
- 11.1.1.2. Products
- 11.1.1.3. Company Financials
- 11.1.1.4. SWOT Analysis
- 11.1.2 Youon Bike
- 11.1.2.1. Company Overview
- 11.1.2.2. Products
- 11.1.2.3. Company Financials
- 11.1.2.4. SWOT Analysis
- 11.1.3 Didi Chuxing Technology Co
- 11.1.3.1. Company Overview
- 11.1.3.2. Products
- 11.1.3.3. Company Financials
- 11.1.3.4. SWOT Analysis
- 11.1.4 Uber Technologies Inc
- 11.1.4.1. Company Overview
- 11.1.4.2. Products
- 11.1.4.3. Company Financials
- 11.1.4.4. SWOT Analysis
- 11.1.5 Lyft Inc
- 11.1.5.1. Company Overview
- 11.1.5.2. Products
- 11.1.5.3. Company Financials
- 11.1.5.4. SWOT Analysis
- 11.1.6 Bluegogo
- 11.1.6.1. Company Overview
- 11.1.6.2. Products
- 11.1.6.3. Company Financials
- 11.1.6.4. SWOT Analysis
- 11.1.7 Hellobike
- 11.1.7.1. Company Overview
- 11.1.7.2. Products
- 11.1.7.3. Company Financials
- 11.1.7.4. SWOT Analysis
- 11.1.8 Meituan Bik
- 11.1.8.1. Company Overview
- 11.1.8.2. Products
- 11.1.8.3. Company Financials
- 11.1.8.4. SWOT Analysis
- 11.1.9 Bird Rides Inc
- 11.1.9.1. Company Overview
- 11.1.9.2. Products
- 11.1.9.3. Company Financials
- 11.1.9.4. SWOT Analysis
- 11.1.10 Neutron Holdings Inc
- 11.1.10.1. Company Overview
- 11.1.10.2. Products
- 11.1.10.3. Company Financials
- 11.1.10.4. SWOT Analysis
- 11.1.1 JCDecaux Group
- 11.2. Market Entropy
- 11.2.1 Company's Key Areas Served
- 11.2.2 Recent Developments
- 11.3. Company Market Share Analysis 2025
- 11.3.1 Top 5 Companies Market Share Analysis
- 11.3.2 Top 3 Companies Market Share Analysis
- 11.4. List of Potential Customers
- 12. Research Methodology
List of Figures
- Figure 1: Global Bike Sharing Industry Revenue Breakdown (Million, %) by Region 2025 & 2033
- Figure 2: North America Bike Sharing Industry Revenue (Million), by Bike 2025 & 2033
- Figure 3: North America Bike Sharing Industry Revenue Share (%), by Bike 2025 & 2033
- Figure 4: North America Bike Sharing Industry Revenue (Million), by Sharing System 2025 & 2033
- Figure 5: North America Bike Sharing Industry Revenue Share (%), by Sharing System 2025 & 2033
- Figure 6: North America Bike Sharing Industry Revenue (Million), by Country 2025 & 2033
- Figure 7: North America Bike Sharing Industry Revenue Share (%), by Country 2025 & 2033
- Figure 8: Europe Bike Sharing Industry Revenue (Million), by Bike 2025 & 2033
- Figure 9: Europe Bike Sharing Industry Revenue Share (%), by Bike 2025 & 2033
- Figure 10: Europe Bike Sharing Industry Revenue (Million), by Sharing System 2025 & 2033
- Figure 11: Europe Bike Sharing Industry Revenue Share (%), by Sharing System 2025 & 2033
- Figure 12: Europe Bike Sharing Industry Revenue (Million), by Country 2025 & 2033
- Figure 13: Europe Bike Sharing Industry Revenue Share (%), by Country 2025 & 2033
- Figure 14: Asia Pacific Bike Sharing Industry Revenue (Million), by Bike 2025 & 2033
- Figure 15: Asia Pacific Bike Sharing Industry Revenue Share (%), by Bike 2025 & 2033
- Figure 16: Asia Pacific Bike Sharing Industry Revenue (Million), by Sharing System 2025 & 2033
- Figure 17: Asia Pacific Bike Sharing Industry Revenue Share (%), by Sharing System 2025 & 2033
- Figure 18: Asia Pacific Bike Sharing Industry Revenue (Million), by Country 2025 & 2033
- Figure 19: Asia Pacific Bike Sharing Industry Revenue Share (%), by Country 2025 & 2033
- Figure 20: Rest of the World Bike Sharing Industry Revenue (Million), by Bike 2025 & 2033
- Figure 21: Rest of the World Bike Sharing Industry Revenue Share (%), by Bike 2025 & 2033
- Figure 22: Rest of the World Bike Sharing Industry Revenue (Million), by Sharing System 2025 & 2033
- Figure 23: Rest of the World Bike Sharing Industry Revenue Share (%), by Sharing System 2025 & 2033
- Figure 24: Rest of the World Bike Sharing Industry Revenue (Million), by Country 2025 & 2033
- Figure 25: Rest of the World Bike Sharing Industry Revenue Share (%), by Country 2025 & 2033
List of Tables
- Table 1: Global Bike Sharing Industry Revenue Million Forecast, by Bike 2020 & 2033
- Table 2: Global Bike Sharing Industry Revenue Million Forecast, by Sharing System 2020 & 2033
- Table 3: Global Bike Sharing Industry Revenue Million Forecast, by Region 2020 & 2033
- Table 4: Global Bike Sharing Industry Revenue Million Forecast, by Bike 2020 & 2033
- Table 5: Global Bike Sharing Industry Revenue Million Forecast, by Sharing System 2020 & 2033
- Table 6: Global Bike Sharing Industry Revenue Million Forecast, by Country 2020 & 2033
- Table 7: Global Bike Sharing Industry Revenue Million Forecast, by Bike 2020 & 2033
- Table 8: Global Bike Sharing Industry Revenue Million Forecast, by Sharing System 2020 & 2033
- Table 9: Global Bike Sharing Industry Revenue Million Forecast, by Country 2020 & 2033
- Table 10: Global Bike Sharing Industry Revenue Million Forecast, by Bike 2020 & 2033
- Table 11: Global Bike Sharing Industry Revenue Million Forecast, by Sharing System 2020 & 2033
- Table 12: Global Bike Sharing Industry Revenue Million Forecast, by Country 2020 & 2033
- Table 13: Global Bike Sharing Industry Revenue Million Forecast, by Bike 2020 & 2033
- Table 14: Global Bike Sharing Industry Revenue Million Forecast, by Sharing System 2020 & 2033
- Table 15: Global Bike Sharing Industry Revenue Million Forecast, by Country 2020 & 2033
Frequently Asked Questions
1. What is the projected Compound Annual Growth Rate (CAGR) of the Bike Sharing Industry?
The projected CAGR is approximately 9.65%.
2. Which companies are prominent players in the Bike Sharing Industry?
Key companies in the market include JCDecaux Group, Youon Bike, Didi Chuxing Technology Co, Uber Technologies Inc, Lyft Inc, Bluegogo, Hellobike, Meituan Bik, Bird Rides Inc, Neutron Holdings Inc.
3. What are the main segments of the Bike Sharing Industry?
The market segments include Bike, Sharing System.
4. Can you provide details about the market size?
The market size is estimated to be USD 7.85 Million as of 2022.
5. What are some drivers contributing to market growth?
Increasing Inclusion of E-bikes in the Sharing Fleet.
6. What are the notable trends driving market growth?
E-bike Segment Expected to be the Fastest-growing Segment Over the Forecast Period.
7. Are there any restraints impacting market growth?
Limited Infrastructure May Hinder Market Growth.
8. Can you provide examples of recent developments in the market?
December 2023: The US International Development Finance Corporation (DFC) and IDB Invest announced that they were co-investing a combined USD 23 million in equity in micro-mobility platform Tembici to support the expansion of bicycle-sharing services in Latin America.
9. What pricing options are available for accessing the report?
Pricing options include single-user, multi-user, and enterprise licenses priced at USD 4750, USD 5250, and USD 8750 respectively.
10. Is the market size provided in terms of value or volume?
The market size is provided in terms of value, measured in Million.
11. Are there any specific market keywords associated with the report?
Yes, the market keyword associated with the report is "Bike Sharing Industry," which aids in identifying and referencing the specific market segment covered.
12. How do I determine which pricing option suits my needs best?
The pricing options vary based on user requirements and access needs. Individual users may opt for single-user licenses, while businesses requiring broader access may choose multi-user or enterprise licenses for cost-effective access to the report.
13. Are there any additional resources or data provided in the Bike Sharing Industry report?
While the report offers comprehensive insights, it's advisable to review the specific contents or supplementary materials provided to ascertain if additional resources or data are available.
14. How can I stay updated on further developments or reports in the Bike Sharing Industry?
To stay informed about further developments, trends, and reports in the Bike Sharing Industry, consider subscribing to industry newsletters, following relevant companies and organizations, or regularly checking reputable industry news sources and publications.
Methodology
Step 1 - Identification of Relevant Samples Size from Population Database


Step 2 - Approaches for Defining Global Market Size (Value, Volume* & Price*)

Note*: In applicable scenarios
Step 3 - Data Sources
Primary Research
- Web Analytics
- Survey Reports
- Research Institute
- Latest Research Reports
- Opinion Leaders
Secondary Research
- Annual Reports
- White Paper
- Latest Press Release
- Industry Association
- Paid Database
- Investor Presentations

Step 4 - Data Triangulation
Involves using different sources of information in order to increase the validity of a study
These sources are likely to be stakeholders in a program - participants, other researchers, program staff, other community members, and so on.
Then we put all data in single framework & apply various statistical tools to find out the dynamic on the market.
During the analysis stage, feedback from the stakeholder groups would be compared to determine areas of agreement as well as areas of divergence