
Key Insights
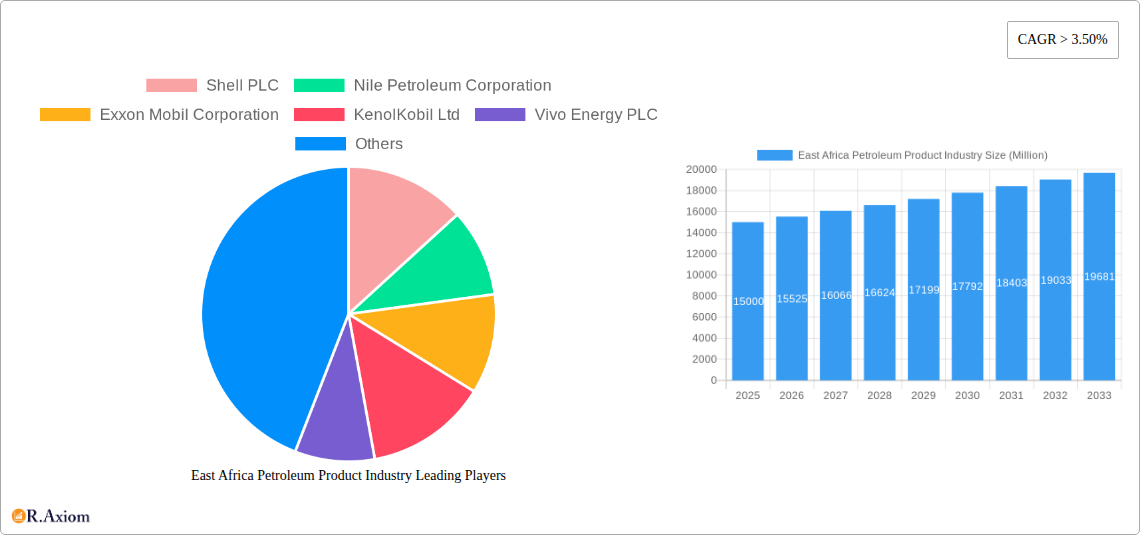
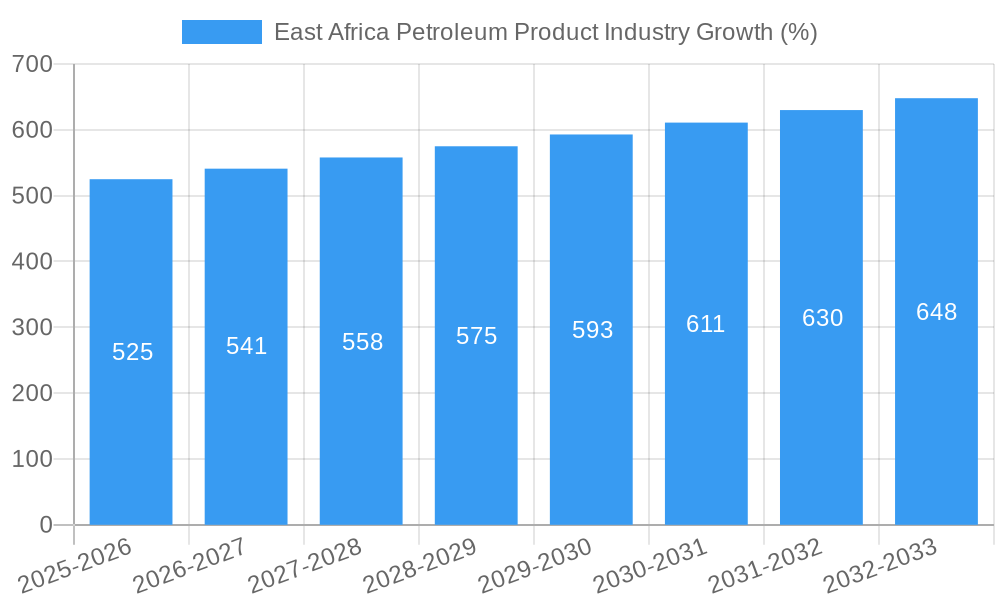
The East African petroleum product market, encompassing countries like Kenya, Uganda, Tanzania, Sudan, South Africa, and the rest of the region, presents a dynamic landscape with significant growth potential. Driven by increasing urbanization, industrialization, and a burgeoning automotive sector, the market exhibited a Compound Annual Growth Rate (CAGR) exceeding 3.5% between 2019 and 2024. This upward trajectory is projected to continue through 2033, fueled by rising energy demand across various sectors, including transportation, power generation, and manufacturing. The market is segmented into light, middle, and heavy distillates, each experiencing varying growth rates depending on specific consumption patterns and infrastructure developments within the region. Major players such as Shell PLC, Exxon Mobil Corporation, and TotalEnergies SE are actively competing for market share, while local companies like KenolKobil Ltd and Nile Petroleum Corporation also play a crucial role. Challenges remain, however, including infrastructure limitations in certain areas, fluctuating global oil prices, and the increasing emphasis on renewable energy sources, which may influence long-term market growth. Despite these challenges, the market's underlying strength, particularly in its transportation sector, points towards considerable future expansion.
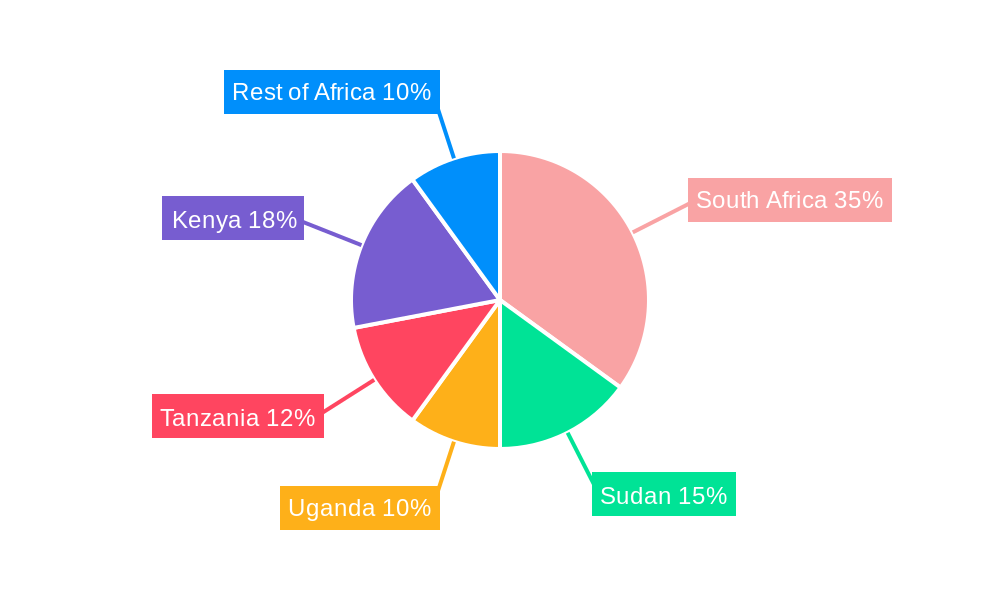
The forecast period (2025-2033) is expected to see continued growth, albeit potentially at a slightly moderated pace compared to the historical period. The expansion of regional infrastructure projects, including pipelines and refineries, is likely to contribute to this growth. However, the transition towards cleaner energy sources presents a noteworthy long-term challenge, requiring industry players to adapt and diversify their portfolios. South Africa, due to its larger economy and existing infrastructure, is expected to retain a significant market share, but other countries, notably Kenya and Tanzania, are predicted to witness substantial growth based on their increasing populations and economic development. The strategic focus of major players will likely encompass both expanding their market presence through infrastructure investment and adapting to the evolving energy landscape. Market consolidation may also occur as smaller players adapt or are acquired by larger entities.
East Africa Petroleum Product Industry: 2019-2033 Market Analysis & Forecast Report
This comprehensive report provides an in-depth analysis of the East African petroleum product industry, covering the period from 2019 to 2033. It offers valuable insights into market dynamics, competitive landscapes, and future growth prospects, equipping stakeholders with actionable intelligence for strategic decision-making. The report leverages extensive data and analysis to offer a detailed understanding of market trends, segment performance, and key players within the region.
East Africa Petroleum Product Industry Market Concentration & Innovation
This section analyzes the competitive landscape of the East African petroleum product market, focusing on market concentration, innovation drivers, regulatory frameworks, and M&A activities. The report examines the market share held by key players like Shell PLC, Nile Petroleum Corporation, Exxon Mobil Corporation, KenolKobil Ltd, Vivo Energy PLC, TotalEnergies SE, and National Oil Ethiopia PLC. We analyze the impact of mergers and acquisitions (M&A), estimating a total M&A deal value of approximately $xx Million during the historical period (2019-2024). The influence of regulatory frameworks on market concentration and innovation is thoroughly assessed, including an examination of product substitutes and their impact on market share. Analysis of end-user trends and their influence on product demand is included. Specific metrics such as market share percentages for each major player and the cumulative value of M&A deals are provided in detailed tables within the report.
- Market Share Analysis: Detailed breakdown of market share for each major player (Shell PLC, Nile Petroleum Corporation, etc.) for each segment (Light, Middle, and Heavy Distillates).
- M&A Activity: Analysis of significant mergers and acquisitions, including deal values and their impact on market consolidation.
- Regulatory Landscape: Assessment of existing regulations and their effect on innovation and market competition.
- Substitute Products: Evaluation of the impact of alternative energy sources and their potential to disrupt the market.
- End-User Trends: Exploration of evolving fuel consumption patterns and their implications for industry players.
East Africa Petroleum Product Industry Industry Trends & Insights
This section delves into the key trends shaping the East African petroleum product industry. We project a Compound Annual Growth Rate (CAGR) of xx% for the forecast period (2025-2033), driven by factors such as increasing urbanization, economic growth in certain East African nations, and rising vehicle ownership. The report explores technological disruptions, analyzing the adoption of new refining technologies and their effects on efficiency and product quality. Consumer preferences regarding fuel types and brands are examined, providing insights into market segmentation and targeting strategies. The competitive dynamics are also explored, with an analysis of pricing strategies, brand positioning, and market penetration of major players. The section further analyzes the impact of fluctuating global crude oil prices on market stability and profitability. Market penetration rates for key players are detailed, illustrating market dominance and competitiveness.
Dominant Markets & Segments in East Africa Petroleum Product Industry
This section identifies the leading regions, countries, and segments within the East African petroleum product industry. Based on our analysis, [Country Name] emerges as the dominant market due to [explain reasons with quantifiable data]. Key drivers contributing to this dominance include [list of drivers with supporting data e.g., robust economic growth, favorable government policies, and extensive infrastructure]. A detailed comparison of Light, Middle, and Heavy Distillates is provided, highlighting the leading segment.
Key Drivers for Dominant Market:
- Economic Growth: Quantifiable data on GDP growth and its correlation with fuel consumption.
- Government Policies: Analysis of supportive policies and their impact on market expansion.
- Infrastructure Development: Assessment of the role of road networks and transportation infrastructure.
Segment Dominance Analysis: Detailed analysis of each segment (Light, Middle, Heavy Distillates), comparing market size, growth rate, and key players.
East Africa Petroleum Product Industry Product Developments
The East African petroleum product industry is witnessing ongoing product innovation, driven by the need for cleaner fuels and improved efficiency. New formulations focusing on reduced emissions and enhanced performance are gaining traction. The adoption of advanced refining technologies is leading to improved product quality and yield. This section explores these developments, highlighting their competitive advantages and market fit. The increased demand for higher-octane fuels and specialized blends is also analyzed.
Report Scope & Segmentation Analysis
This report segments the East African petroleum product market by product type: Light Distillates, Middle Distillates, and Heavy Distillates.
Light Distillates: This segment comprises gasoline and other light fuels. The market size for 2025 is estimated at $xx Million, projected to reach $xx Million by 2033, with a CAGR of xx%. Competitive dynamics are characterized by [description].
Middle Distillates: This segment includes diesel and kerosene. The 2025 market size is estimated at $xx Million, projected to reach $xx Million by 2033, with a CAGR of xx%. Competitive dynamics are influenced by [description].
Heavy Distillates: This segment covers fuel oil and other heavy products. The 2025 market size is estimated at $xx Million, projected to reach $xx Million by 2033, with a CAGR of xx%. Competition within this segment is [description].
Key Drivers of East Africa Petroleum Product Industry Growth
Several factors drive the growth of the East African petroleum product industry. These include sustained economic expansion across several countries in the region, resulting in increased industrial activity and transportation demand. Government investments in infrastructure development, particularly road networks, contribute significantly to fuel consumption. The expanding urban population and rising vehicle ownership further fuel market growth. Technological advancements in refining and fuel efficiency also play a pivotal role.
Challenges in the East Africa Petroleum Product Industry Sector
The East African petroleum product industry faces several challenges. Fluctuating global crude oil prices create considerable price volatility, impacting profitability. Infrastructure limitations in some regions hinder efficient distribution and increase transportation costs. Stricter environmental regulations increase operational expenses for companies. Furthermore, intense competition among established players and the entry of new companies create significant competitive pressures. This leads to reduced profit margins and increased investment in modernizing refining infrastructure.
Emerging Opportunities in East Africa Petroleum Product Industry
The industry presents several promising opportunities. The increasing demand for cleaner fuels creates openings for companies investing in biofuels and other renewable alternatives. The development of more efficient refining technologies promises enhanced profitability. Expansion into underserved regions offers growth potential. Government support for infrastructure development projects creates favorable conditions for market expansion.
Leading Players in the East Africa Petroleum Product Industry Market
- Shell PLC
- Nile Petroleum Corporation
- Exxon Mobil Corporation
- KenolKobil Ltd
- Vivo Energy PLC
- TotalEnergies SE
- National Oil Ethiopia PLC
Key Developments in East Africa Petroleum Product Industry Industry
- 2022-Q4: Shell PLC announces investment in a new refinery in [Country Name].
- 2023-Q1: KenolKobil Ltd expands its network of petrol stations in [Country Name].
- 2023-Q2: New regulations on fuel emissions come into effect in [Country Name]. (Further details on other developments would be included in the full report).
Strategic Outlook for East Africa Petroleum Product Industry Market
The East African petroleum product industry is poised for continued growth, driven by increasing energy demand and infrastructure development. However, navigating challenges such as price volatility and environmental regulations will be crucial. Companies focusing on innovation, diversification, and sustainable practices will be better positioned to succeed in this dynamic market. Opportunities exist in expanding into new markets, adopting efficient technologies, and catering to evolving consumer preferences for cleaner fuels. The long-term outlook remains positive, with significant potential for market expansion over the forecast period.
East Africa Petroleum Product Industry Segmentation
-
1. Type
- 1.1. Light Distillates
- 1.2. Middle Distillates
- 1.3. Heavy Distillates
-
2. Geography
- 2.1. Uganda
- 2.2. Kenya
- 2.3. Tanzania
- 2.4. Mozambique
- 2.5. Rest of East Africa
East Africa Petroleum Product Industry Segmentation By Geography
- 1. Uganda
- 2. Kenya
- 3. Tanzania
- 4. Mozambique
- 5. Rest of East Africa
East Africa Petroleum Product Industry REPORT HIGHLIGHTS
| Aspects | Details |
|---|---|
| Study Period | 2019-2033 |
| Base Year | 2024 |
| Estimated Year | 2025 |
| Forecast Period | 2025-2033 |
| Historical Period | 2019-2024 |
| Growth Rate | CAGR of > 3.50% from 2019-2033 |
| Segmentation |
|
Table of Contents
- 1. Introduction
- 1.1. Research Scope
- 1.2. Market Segmentation
- 1.3. Research Methodology
- 1.4. Definitions and Assumptions
- 2. Executive Summary
- 2.1. Introduction
- 3. Market Dynamics
- 3.1. Introduction
- 3.2. Market Drivers
- 3.2.1. 4.; Abundant Oil and Gas Reserves4.; Favorable Investment in Upstream Sector
- 3.3. Market Restrains
- 3.3.1. 4.; Volatility of Crude Oil Prices
- 3.4. Market Trends
- 3.4.1. Middle Distillates to Dominate the Market
- 4. Market Factor Analysis
- 4.1. Porters Five Forces
- 4.2. Supply/Value Chain
- 4.3. PESTEL analysis
- 4.4. Market Entropy
- 4.5. Patent/Trademark Analysis
- 5. East Africa Petroleum Product Industry Analysis, Insights and Forecast, 2019-2031
- 5.1. Market Analysis, Insights and Forecast - by Type
- 5.1.1. Light Distillates
- 5.1.2. Middle Distillates
- 5.1.3. Heavy Distillates
- 5.2. Market Analysis, Insights and Forecast - by Geography
- 5.2.1. Uganda
- 5.2.2. Kenya
- 5.2.3. Tanzania
- 5.2.4. Mozambique
- 5.2.5. Rest of East Africa
- 5.3. Market Analysis, Insights and Forecast - by Region
- 5.3.1. Uganda
- 5.3.2. Kenya
- 5.3.3. Tanzania
- 5.3.4. Mozambique
- 5.3.5. Rest of East Africa
- 5.1. Market Analysis, Insights and Forecast - by Type
- 6. Uganda East Africa Petroleum Product Industry Analysis, Insights and Forecast, 2019-2031
- 6.1. Market Analysis, Insights and Forecast - by Type
- 6.1.1. Light Distillates
- 6.1.2. Middle Distillates
- 6.1.3. Heavy Distillates
- 6.2. Market Analysis, Insights and Forecast - by Geography
- 6.2.1. Uganda
- 6.2.2. Kenya
- 6.2.3. Tanzania
- 6.2.4. Mozambique
- 6.2.5. Rest of East Africa
- 6.1. Market Analysis, Insights and Forecast - by Type
- 7. Kenya East Africa Petroleum Product Industry Analysis, Insights and Forecast, 2019-2031
- 7.1. Market Analysis, Insights and Forecast - by Type
- 7.1.1. Light Distillates
- 7.1.2. Middle Distillates
- 7.1.3. Heavy Distillates
- 7.2. Market Analysis, Insights and Forecast - by Geography
- 7.2.1. Uganda
- 7.2.2. Kenya
- 7.2.3. Tanzania
- 7.2.4. Mozambique
- 7.2.5. Rest of East Africa
- 7.1. Market Analysis, Insights and Forecast - by Type
- 8. Tanzania East Africa Petroleum Product Industry Analysis, Insights and Forecast, 2019-2031
- 8.1. Market Analysis, Insights and Forecast - by Type
- 8.1.1. Light Distillates
- 8.1.2. Middle Distillates
- 8.1.3. Heavy Distillates
- 8.2. Market Analysis, Insights and Forecast - by Geography
- 8.2.1. Uganda
- 8.2.2. Kenya
- 8.2.3. Tanzania
- 8.2.4. Mozambique
- 8.2.5. Rest of East Africa
- 8.1. Market Analysis, Insights and Forecast - by Type
- 9. Mozambique East Africa Petroleum Product Industry Analysis, Insights and Forecast, 2019-2031
- 9.1. Market Analysis, Insights and Forecast - by Type
- 9.1.1. Light Distillates
- 9.1.2. Middle Distillates
- 9.1.3. Heavy Distillates
- 9.2. Market Analysis, Insights and Forecast - by Geography
- 9.2.1. Uganda
- 9.2.2. Kenya
- 9.2.3. Tanzania
- 9.2.4. Mozambique
- 9.2.5. Rest of East Africa
- 9.1. Market Analysis, Insights and Forecast - by Type
- 10. Rest of East Africa East Africa Petroleum Product Industry Analysis, Insights and Forecast, 2019-2031
- 10.1. Market Analysis, Insights and Forecast - by Type
- 10.1.1. Light Distillates
- 10.1.2. Middle Distillates
- 10.1.3. Heavy Distillates
- 10.2. Market Analysis, Insights and Forecast - by Geography
- 10.2.1. Uganda
- 10.2.2. Kenya
- 10.2.3. Tanzania
- 10.2.4. Mozambique
- 10.2.5. Rest of East Africa
- 10.1. Market Analysis, Insights and Forecast - by Type
- 11. South Africa East Africa Petroleum Product Industry Analysis, Insights and Forecast, 2019-2031
- 12. Sudan East Africa Petroleum Product Industry Analysis, Insights and Forecast, 2019-2031
- 13. Uganda East Africa Petroleum Product Industry Analysis, Insights and Forecast, 2019-2031
- 14. Tanzania East Africa Petroleum Product Industry Analysis, Insights and Forecast, 2019-2031
- 15. Kenya East Africa Petroleum Product Industry Analysis, Insights and Forecast, 2019-2031
- 16. Rest of Africa East Africa Petroleum Product Industry Analysis, Insights and Forecast, 2019-2031
- 17. Competitive Analysis
- 17.1. Market Share Analysis 2024
- 17.2. Company Profiles
- 17.2.1 Shell PLC
- 17.2.1.1. Overview
- 17.2.1.2. Products
- 17.2.1.3. SWOT Analysis
- 17.2.1.4. Recent Developments
- 17.2.1.5. Financials (Based on Availability)
- 17.2.2 Nile Petroleum Corporation
- 17.2.2.1. Overview
- 17.2.2.2. Products
- 17.2.2.3. SWOT Analysis
- 17.2.2.4. Recent Developments
- 17.2.2.5. Financials (Based on Availability)
- 17.2.3 Exxon Mobil Corporation
- 17.2.3.1. Overview
- 17.2.3.2. Products
- 17.2.3.3. SWOT Analysis
- 17.2.3.4. Recent Developments
- 17.2.3.5. Financials (Based on Availability)
- 17.2.4 KenolKobil Ltd
- 17.2.4.1. Overview
- 17.2.4.2. Products
- 17.2.4.3. SWOT Analysis
- 17.2.4.4. Recent Developments
- 17.2.4.5. Financials (Based on Availability)
- 17.2.5 Vivo Energy PLC
- 17.2.5.1. Overview
- 17.2.5.2. Products
- 17.2.5.3. SWOT Analysis
- 17.2.5.4. Recent Developments
- 17.2.5.5. Financials (Based on Availability)
- 17.2.6 TotalEnergies SE
- 17.2.6.1. Overview
- 17.2.6.2. Products
- 17.2.6.3. SWOT Analysis
- 17.2.6.4. Recent Developments
- 17.2.6.5. Financials (Based on Availability)
- 17.2.7 National Oil Ethiopia PLC
- 17.2.7.1. Overview
- 17.2.7.2. Products
- 17.2.7.3. SWOT Analysis
- 17.2.7.4. Recent Developments
- 17.2.7.5. Financials (Based on Availability)
- 17.2.1 Shell PLC
List of Figures
- Figure 1: East Africa Petroleum Product Industry Revenue Breakdown (Million, %) by Product 2024 & 2032
- Figure 2: East Africa Petroleum Product Industry Share (%) by Company 2024
List of Tables
- Table 1: East Africa Petroleum Product Industry Revenue Million Forecast, by Region 2019 & 2032
- Table 2: East Africa Petroleum Product Industry Volume K Unit Forecast, by Region 2019 & 2032
- Table 3: East Africa Petroleum Product Industry Revenue Million Forecast, by Type 2019 & 2032
- Table 4: East Africa Petroleum Product Industry Volume K Unit Forecast, by Type 2019 & 2032
- Table 5: East Africa Petroleum Product Industry Revenue Million Forecast, by Geography 2019 & 2032
- Table 6: East Africa Petroleum Product Industry Volume K Unit Forecast, by Geography 2019 & 2032
- Table 7: East Africa Petroleum Product Industry Revenue Million Forecast, by Region 2019 & 2032
- Table 8: East Africa Petroleum Product Industry Volume K Unit Forecast, by Region 2019 & 2032
- Table 9: East Africa Petroleum Product Industry Revenue Million Forecast, by Country 2019 & 2032
- Table 10: East Africa Petroleum Product Industry Volume K Unit Forecast, by Country 2019 & 2032
- Table 11: South Africa East Africa Petroleum Product Industry Revenue (Million) Forecast, by Application 2019 & 2032
- Table 12: South Africa East Africa Petroleum Product Industry Volume (K Unit) Forecast, by Application 2019 & 2032
- Table 13: Sudan East Africa Petroleum Product Industry Revenue (Million) Forecast, by Application 2019 & 2032
- Table 14: Sudan East Africa Petroleum Product Industry Volume (K Unit) Forecast, by Application 2019 & 2032
- Table 15: Uganda East Africa Petroleum Product Industry Revenue (Million) Forecast, by Application 2019 & 2032
- Table 16: Uganda East Africa Petroleum Product Industry Volume (K Unit) Forecast, by Application 2019 & 2032
- Table 17: Tanzania East Africa Petroleum Product Industry Revenue (Million) Forecast, by Application 2019 & 2032
- Table 18: Tanzania East Africa Petroleum Product Industry Volume (K Unit) Forecast, by Application 2019 & 2032
- Table 19: Kenya East Africa Petroleum Product Industry Revenue (Million) Forecast, by Application 2019 & 2032
- Table 20: Kenya East Africa Petroleum Product Industry Volume (K Unit) Forecast, by Application 2019 & 2032
- Table 21: Rest of Africa East Africa Petroleum Product Industry Revenue (Million) Forecast, by Application 2019 & 2032
- Table 22: Rest of Africa East Africa Petroleum Product Industry Volume (K Unit) Forecast, by Application 2019 & 2032
- Table 23: East Africa Petroleum Product Industry Revenue Million Forecast, by Type 2019 & 2032
- Table 24: East Africa Petroleum Product Industry Volume K Unit Forecast, by Type 2019 & 2032
- Table 25: East Africa Petroleum Product Industry Revenue Million Forecast, by Geography 2019 & 2032
- Table 26: East Africa Petroleum Product Industry Volume K Unit Forecast, by Geography 2019 & 2032
- Table 27: East Africa Petroleum Product Industry Revenue Million Forecast, by Country 2019 & 2032
- Table 28: East Africa Petroleum Product Industry Volume K Unit Forecast, by Country 2019 & 2032
- Table 29: East Africa Petroleum Product Industry Revenue Million Forecast, by Type 2019 & 2032
- Table 30: East Africa Petroleum Product Industry Volume K Unit Forecast, by Type 2019 & 2032
- Table 31: East Africa Petroleum Product Industry Revenue Million Forecast, by Geography 2019 & 2032
- Table 32: East Africa Petroleum Product Industry Volume K Unit Forecast, by Geography 2019 & 2032
- Table 33: East Africa Petroleum Product Industry Revenue Million Forecast, by Country 2019 & 2032
- Table 34: East Africa Petroleum Product Industry Volume K Unit Forecast, by Country 2019 & 2032
- Table 35: East Africa Petroleum Product Industry Revenue Million Forecast, by Type 2019 & 2032
- Table 36: East Africa Petroleum Product Industry Volume K Unit Forecast, by Type 2019 & 2032
- Table 37: East Africa Petroleum Product Industry Revenue Million Forecast, by Geography 2019 & 2032
- Table 38: East Africa Petroleum Product Industry Volume K Unit Forecast, by Geography 2019 & 2032
- Table 39: East Africa Petroleum Product Industry Revenue Million Forecast, by Country 2019 & 2032
- Table 40: East Africa Petroleum Product Industry Volume K Unit Forecast, by Country 2019 & 2032
- Table 41: East Africa Petroleum Product Industry Revenue Million Forecast, by Type 2019 & 2032
- Table 42: East Africa Petroleum Product Industry Volume K Unit Forecast, by Type 2019 & 2032
- Table 43: East Africa Petroleum Product Industry Revenue Million Forecast, by Geography 2019 & 2032
- Table 44: East Africa Petroleum Product Industry Volume K Unit Forecast, by Geography 2019 & 2032
- Table 45: East Africa Petroleum Product Industry Revenue Million Forecast, by Country 2019 & 2032
- Table 46: East Africa Petroleum Product Industry Volume K Unit Forecast, by Country 2019 & 2032
- Table 47: East Africa Petroleum Product Industry Revenue Million Forecast, by Type 2019 & 2032
- Table 48: East Africa Petroleum Product Industry Volume K Unit Forecast, by Type 2019 & 2032
- Table 49: East Africa Petroleum Product Industry Revenue Million Forecast, by Geography 2019 & 2032
- Table 50: East Africa Petroleum Product Industry Volume K Unit Forecast, by Geography 2019 & 2032
- Table 51: East Africa Petroleum Product Industry Revenue Million Forecast, by Country 2019 & 2032
- Table 52: East Africa Petroleum Product Industry Volume K Unit Forecast, by Country 2019 & 2032
Frequently Asked Questions
1. What is the projected Compound Annual Growth Rate (CAGR) of the East Africa Petroleum Product Industry?
The projected CAGR is approximately > 3.50%.
2. Which companies are prominent players in the East Africa Petroleum Product Industry?
Key companies in the market include Shell PLC, Nile Petroleum Corporation, Exxon Mobil Corporation, KenolKobil Ltd, Vivo Energy PLC, TotalEnergies SE, National Oil Ethiopia PLC.
3. What are the main segments of the East Africa Petroleum Product Industry?
The market segments include Type, Geography.
4. Can you provide details about the market size?
The market size is estimated to be USD XX Million as of 2022.
5. What are some drivers contributing to market growth?
4.; Abundant Oil and Gas Reserves4.; Favorable Investment in Upstream Sector.
6. What are the notable trends driving market growth?
Middle Distillates to Dominate the Market.
7. Are there any restraints impacting market growth?
4.; Volatility of Crude Oil Prices.
8. Can you provide examples of recent developments in the market?
N/A
9. What pricing options are available for accessing the report?
Pricing options include single-user, multi-user, and enterprise licenses priced at USD 4750, USD 5250, and USD 8750 respectively.
10. Is the market size provided in terms of value or volume?
The market size is provided in terms of value, measured in Million and volume, measured in K Unit.
11. Are there any specific market keywords associated with the report?
Yes, the market keyword associated with the report is "East Africa Petroleum Product Industry," which aids in identifying and referencing the specific market segment covered.
12. How do I determine which pricing option suits my needs best?
The pricing options vary based on user requirements and access needs. Individual users may opt for single-user licenses, while businesses requiring broader access may choose multi-user or enterprise licenses for cost-effective access to the report.
13. Are there any additional resources or data provided in the East Africa Petroleum Product Industry report?
While the report offers comprehensive insights, it's advisable to review the specific contents or supplementary materials provided to ascertain if additional resources or data are available.
14. How can I stay updated on further developments or reports in the East Africa Petroleum Product Industry?
To stay informed about further developments, trends, and reports in the East Africa Petroleum Product Industry, consider subscribing to industry newsletters, following relevant companies and organizations, or regularly checking reputable industry news sources and publications.
Methodology
Step 1 - Identification of Relevant Samples Size from Population Database


Step 2 - Approaches for Defining Global Market Size (Value, Volume* & Price*)

Note*: In applicable scenarios
Step 3 - Data Sources
Primary Research
- Web Analytics
- Survey Reports
- Research Institute
- Latest Research Reports
- Opinion Leaders
Secondary Research
- Annual Reports
- White Paper
- Latest Press Release
- Industry Association
- Paid Database
- Investor Presentations

Step 4 - Data Triangulation
Involves using different sources of information in order to increase the validity of a study
These sources are likely to be stakeholders in a program - participants, other researchers, program staff, other community members, and so on.
Then we put all data in single framework & apply various statistical tools to find out the dynamic on the market.
During the analysis stage, feedback from the stakeholder groups would be compared to determine areas of agreement as well as areas of divergence


