

Key Insights
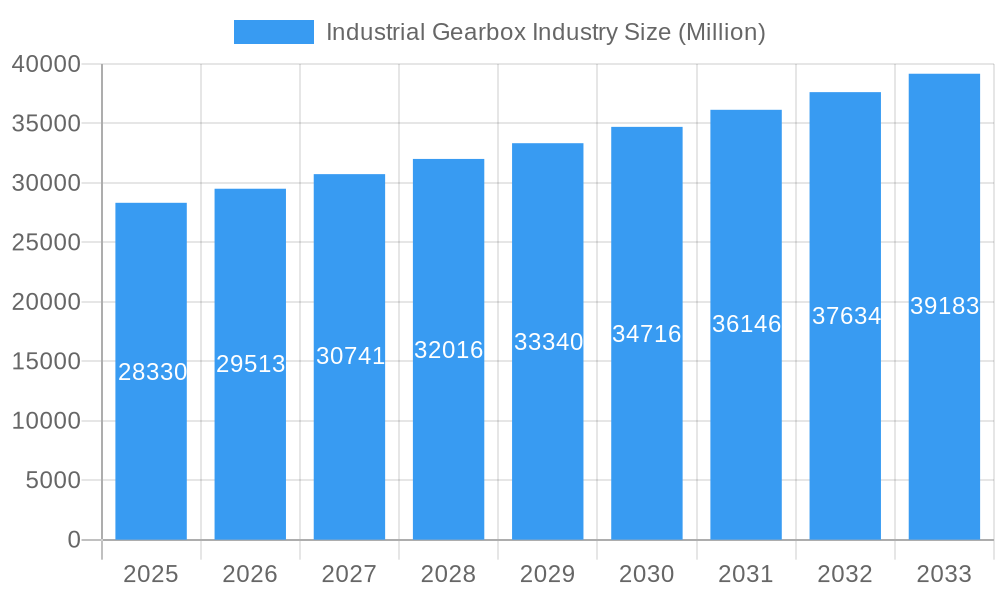
The global industrial gearbox market is poised for robust expansion, with a current valuation of approximately $28.33 billion in 2025, projected to grow at a Compound Annual Growth Rate (CAGR) of 4.20% through 2033. This sustained growth is primarily fueled by increasing industrial automation across burgeoning sectors such as manufacturing, power generation, and mining. The escalating demand for energy efficiency and the subsequent adoption of advanced gearbox technologies that minimize energy loss are key drivers. Furthermore, the continuous need for reliable and high-performance equipment in critical infrastructure like steel plants and wastewater treatment facilities underscores the market's inherent strength. Emerging economies, particularly in the Asia Pacific region, are witnessing accelerated industrial development, creating substantial opportunities for gearbox manufacturers. Innovations in materials and design, leading to more compact, durable, and intelligent gearboxes, are also shaping market dynamics and encouraging technological advancements.
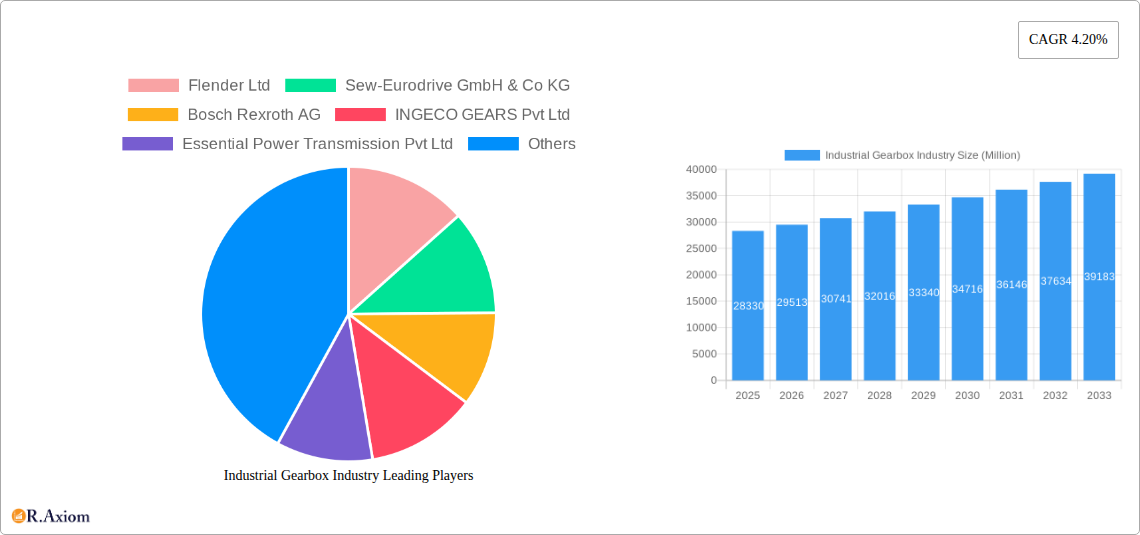
Industrial Gearbox Industry Market Size (In Billion)
The competitive landscape is characterized by the presence of both established global players and emerging regional manufacturers, each vying for market share through product innovation, strategic partnerships, and market penetration initiatives. Key segments within the industrial gearbox market include Worm Gearboxes, Helical Gearboxes, Bevel Helical Gearboxes, and Planetary Gearboxes, each catering to specific performance requirements and applications. The Power and Manufacturing industries represent significant application segments, driving demand for a wide array of gearbox types. While the market presents considerable growth prospects, challenges such as fluctuating raw material costs and the need for substantial initial investment in advanced manufacturing capabilities can pose restraints. However, the overarching trend towards Industry 4.0 and the integration of smart technologies within industrial machinery are expected to further propel the demand for sophisticated and efficient industrial gearboxes, ensuring continued market vitality.
Industrial Gearbox Industry Company Market Share
Industrial Gearbox Industry Market Concentration & Innovation
The Industrial Gearbox industry exhibits a moderately concentrated market, with key players like Flender Ltd, Sew-Eurodrive GmbH & Co KG, and Bosch Rexroth AG dominating significant market share, estimated to be over 60% collectively. Innovation is a critical differentiator, driven by the demand for increased efficiency, reduced energy consumption, and enhanced reliability across diverse applications such as the Power Industry, Steel Industry, and Manufacturing Industry. Regulatory frameworks, particularly those concerning environmental standards and safety, play a crucial role in shaping product development and market entry. The threat of product substitutes, while present in the form of integrated motor-drives or advanced belt systems in niche applications, remains limited due to the inherent durability and power transmission capabilities of industrial gearboxes. End-user trends are increasingly leaning towards customized solutions and smart gearboxes with integrated monitoring capabilities for predictive maintenance, a trend further fueled by Industry 4.0 initiatives. Mergers and Acquisitions (M&A) activities, while not as frequent as in other sectors, are strategic moves to consolidate market presence, acquire technological expertise, or expand product portfolios. For instance, M&A deal values in recent years have ranged from tens of millions to hundreds of millions of dollars, signaling a strong appetite for growth and synergy.
- Market Concentration: Dominated by a few key global players with extensive product offerings and distribution networks.
- Innovation Drivers: Energy efficiency, reliability, reduced maintenance, Industry 4.0 integration, and customization.
- Regulatory Frameworks: Stringent environmental and safety standards influencing design and manufacturing processes.
- Product Substitutes: Limited but present in specific low-torque or less demanding applications.
- End-User Trends: Demand for smart gearboxes, predictive maintenance solutions, and application-specific designs.
- M&A Activities: Strategic acquisitions to enhance technological capabilities and market reach.
Industrial Gearbox Industry Industry Trends & Insights
The global Industrial Gearbox market is poised for significant growth, projected to expand at a Compound Annual Growth Rate (CAGR) of approximately 5.5% from its base year valuation of USD 25,000 million in 2025 to an estimated USD 38,000 million by 2033. This robust growth is underpinned by several interconnected trends shaping the industrial landscape. Foremost among these is the escalating demand for energy-efficient machinery across all industrial sectors. As energy costs rise and environmental regulations tighten, industries are increasingly prioritizing gearbox solutions that minimize energy losses during power transmission. This has led to a surge in demand for advanced helical and planetary gearboxes, renowned for their superior efficiency ratings compared to traditional worm gearboxes. Technological disruptions, particularly the integration of the Internet of Things (IoT) and artificial intelligence (AI) into gearbox design, are transforming the market. Smart gearboxes equipped with sensors for real-time monitoring of parameters like temperature, vibration, and torque are becoming indispensable for predictive maintenance, thereby reducing downtime and operational costs. This shift towards data-driven maintenance strategies is a major growth catalyst. Consumer preferences are evolving; end-users are no longer solely focused on the initial purchase price but are increasingly evaluating the total cost of ownership, including maintenance, energy consumption, and longevity. This preference for performance and reliability over upfront cost is a significant market penetration driver. The competitive dynamics are characterized by intense innovation, strategic partnerships, and a growing emphasis on localized manufacturing to serve regional demands. Companies are investing heavily in research and development to create more compact, lighter, and more durable gearbox solutions. The increasing automation in manufacturing processes across the globe, from the Steel Industry to the Manufacturing Industry, directly fuels the demand for high-performance industrial gearboxes that can handle continuous operation and heavy loads. Furthermore, the expansion of renewable energy projects, particularly in the wind power sector, which relies heavily on robust gearbox technology, represents another significant growth avenue. The adoption of advanced materials and manufacturing techniques, such as additive manufacturing, is also contributing to the development of more sophisticated and customized gearbox designs, further pushing the market forward. The increasing complexity of industrial operations and the need for precise motion control in sectors like Robotics and Automation are also driving the demand for specialized gearbox types, such as cycloidal and harmonic drives.
Dominant Markets & Segments in Industrial Gearbox Industry
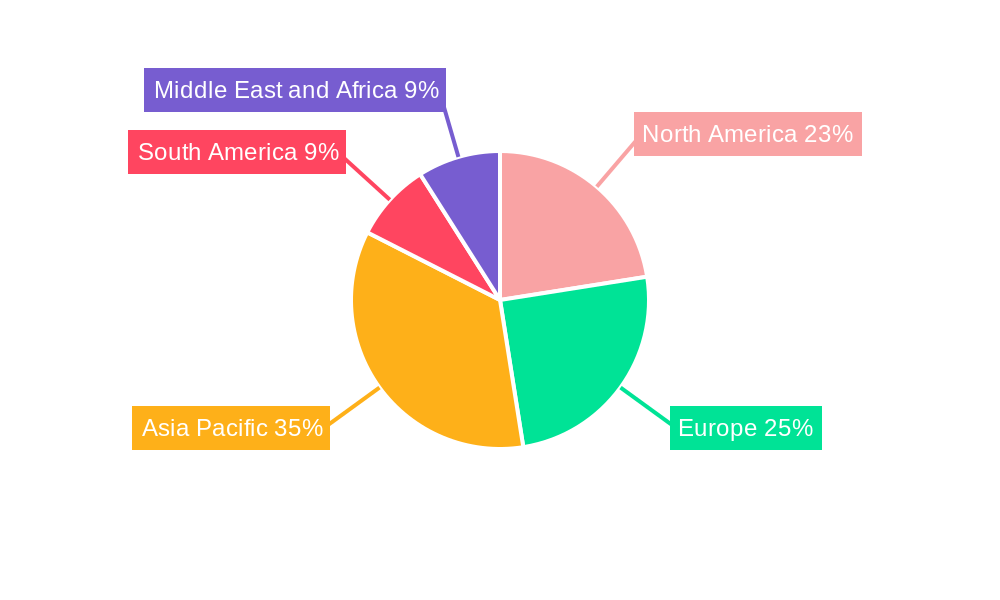
The Industrial Gearbox market’s dominance is sculpted by a confluence of regional economic strength, industrial output, and the specific demands of various application sectors. Globally, North America and Europe currently represent the most mature and dominant markets, accounting for an estimated 35% and 30% of the global market share respectively. This dominance is attributed to their well-established industrial infrastructure, significant investment in technological advancements, and stringent regulatory environments that promote efficiency and reliability. However, the Asia-Pacific region, particularly China and India, is rapidly emerging as a dominant force, projected to witness the highest growth rates due to rapid industrialization, infrastructure development, and a burgeoning manufacturing sector. Within segments, the Helical Gearbox segment is a leading contributor, estimated to hold approximately 28% of the market share in 2025. Its popularity stems from its high efficiency, quiet operation, and suitability for high-speed applications. The Power Industry and the Manufacturing Industry are the primary application segments driving this demand, requiring robust and efficient power transmission solutions for turbines, conveyor systems, and processing machinery.
- Leading Region: North America and Europe (established markets), with Asia-Pacific (rapidly emerging growth).
- Drivers in North America/Europe: Mature industrial base, high R&D investment, stringent efficiency standards.
- Drivers in Asia-Pacific: Rapid industrialization, government initiatives for manufacturing growth, infrastructure development.
- Dominant Segment (Type): Helical Gearbox.
- Key Drivers: High efficiency, versatility, suitability for various speeds and torque loads.
- Primary Applications: Power Generation, Manufacturing, Material Handling.
- Dominant Segment (Application): Power Industry and Manufacturing Industry.
- Power Industry Drivers: Demand for renewable energy infrastructure (wind turbines), efficient power generation and transmission.
- Manufacturing Industry Drivers: Automation, increased production output requirements, need for reliable machinery in diverse production lines.
- Other Key Segments:
- Planetary Gearboxes: High torque density, compact design, crucial for robotics, aerospace, and heavy-duty machinery (estimated 20% market share).
- Worm Gearboxes: Cost-effectiveness and self-locking capabilities make them suitable for slower speed, high torque applications, particularly in material handling and conveyors (estimated 18% market share).
- Bevel Helical Gearboxes: Combine the benefits of both bevel and helical gears, offering high efficiency and right-angle drive capabilities, essential for complex machinery layouts (estimated 15% market share).
- Mines and Minerals Industry: Significant demand for robust gearboxes capable of withstanding harsh environments and heavy loads, contributing to an estimated 9% market share.
- Wastewater Treatment Industry: Growing need for reliable and low-maintenance gearboxes for pumps, mixers, and clarifiers, representing an estimated 6% market share.
Industrial Gearbox Industry Product Developments
Recent product developments in the Industrial Gearbox industry are sharply focused on enhancing efficiency, durability, and integration with smart technologies. Manufacturers are innovating with advanced materials to reduce weight and improve thermal management, while new lubrication technologies are extending service life and reducing maintenance intervals. The integration of sensors for real-time monitoring and diagnostics is a significant trend, enabling predictive maintenance and reducing unplanned downtime. Companies are also developing modular designs for greater customization and faster delivery, catering to the specific needs of diverse applications like the Power Industry, Steel Industry, and Manufacturing Industry. These advancements are crucial for maintaining competitive advantages in a market increasingly driven by performance and operational intelligence.
Report Scope & Segmentation Analysis
This comprehensive report meticulously analyzes the global Industrial Gearbox market, encompassing detailed segmentation by Type and Application. The study period spans from 2019 to 2033, with a Base Year of 2025, offering historical context and forward-looking projections.
- Segmentation by Type: The market is broken down into Worm Gearbox, Helical Gearbox, Bevel Helical Gearbox, Planetary Gearbox, and Other Types. Each segment is analyzed for its market size, growth rate, key market drivers, and competitive landscape within the forecast period (2025–2033).
- Segmentation by Application: Key applications covered include the Power Industry, Steel Industry, Mines and Minerals Industry, Wastewater Treatment Industry, Manufacturing Industry, and Other Applications. Growth projections, market penetration, and the specific demands driving gearbox adoption in each sector are detailed.
Key Drivers of Industrial Gearbox Industry Growth
The Industrial Gearbox industry is experiencing robust growth driven by several pivotal factors. The increasing global demand for energy efficiency is a primary catalyst, pushing industries to adopt advanced gearbox technologies that minimize power loss.
- Industrial Automation and Modernization: Extensive investments in automation across sectors like manufacturing, mining, and energy are directly translating to higher demand for reliable and precise power transmission solutions.
- Infrastructure Development: Significant global investments in infrastructure projects, including power grids, transportation networks, and manufacturing facilities, necessitate robust industrial gearboxes.
- Technological Advancements: The integration of IoT, AI, and advanced materials is leading to the development of smart, highly efficient, and durable gearboxes, fueling market expansion.
- Growth in Renewable Energy: The expanding wind energy sector, in particular, is a significant driver, relying heavily on advanced and reliable gearboxes for turbine operation.
Challenges in the Industrial Gearbox Industry Sector
Despite the positive growth trajectory, the Industrial Gearbox industry faces several challenges that can impede its progress. Supply chain disruptions, often exacerbated by geopolitical instability and raw material price volatility, can impact production timelines and costs.
- Raw Material Price Volatility: Fluctuations in the prices of steel, copper, and other key materials directly affect manufacturing costs and profit margins.
- Intense Competition: The market is characterized by fierce competition, leading to price pressures and a constant need for product innovation to maintain market share.
- Skilled Labor Shortage: A lack of skilled engineers and technicians capable of designing, manufacturing, and maintaining advanced gearbox systems poses a challenge for many companies.
- Harsh Operating Environments: Gearboxes operating in demanding sectors like mining and heavy manufacturing face wear and tear, requiring robust designs and frequent maintenance, which can increase operational costs for end-users.
- Stringent Environmental Regulations: While driving innovation, compliance with evolving environmental standards can increase R&D and manufacturing costs.
Emerging Opportunities in Industrial Gearbox Industry
The Industrial Gearbox market is ripe with emerging opportunities driven by evolving technological landscapes and industry needs. The growing adoption of Industry 4.0 principles presents a significant opportunity for smart gearboxes with integrated IoT capabilities for predictive maintenance and remote monitoring.
- Smart Gearboxes and IoT Integration: Developing gearboxes with advanced sensors and connectivity for real-time data analytics and predictive maintenance.
- Expansion in Renewable Energy: Increasing demand for high-efficiency gearboxes in wind turbines and other renewable energy applications.
- Emerging Markets: Tapping into the rapidly industrializing economies in Asia-Pacific, Africa, and Latin America.
- Customization and Application-Specific Solutions: Catering to the niche requirements of specialized industries with tailor-made gearbox designs.
- Aftermarket Services and Upgrades: Providing comprehensive maintenance, repair, and upgrade services to extend the lifespan of existing gearbox installations.
Leading Players in the Industrial Gearbox Industry Market
- Flender Ltd
- Sew-Eurodrive GmbH & Co KG
- Bosch Rexroth AG
- INGECO GEARS Pvt Ltd
- Essential Power Transmission Pvt Ltd
- Getriebebau NORD GmbH & Co KG
- Nanjing High Accurate Drive Equipment Manufacturing Group Co Ltd
- Zollern GmbH & Co KG
- Lenze SE
- Kngear
- Elecon Engineering Company Limited
- Bonfiglioli Drives Co Ltd
Key Developments in Industrial Gearbox Industry Industry
- May 2023: Triumph Group, Inc. announced that it had been awarded a long-term agreement from General Electric (GE) through its Geared Solutions business for LEAP-1A, LEAP-1B, and LEAP-1C programs. TRIUMPH has collaborated with GE on LEAP and CFM56 IGBs for over 35 years, shipping over 25,000 gearboxes till now. TRIUMPH will supply thousands of IGBs annually to GE into the next decade with this contract extension.
- January 2023: Airbus Helicopters announced the acquisition of a significant gearbox and component supplier for H145 and H135 programs to strengthen its transmission production and overhaul capabilities. Under the deal, Airbus purchased ZF Luftfahrttechnik from ZF Friedrichshafen for an undisclosed amount.
Strategic Outlook for Industrial Gearbox Industry Market
The strategic outlook for the Industrial Gearbox market is exceptionally positive, fueled by ongoing industrial expansion and technological evolution. The increasing emphasis on energy efficiency and automation worldwide will continue to drive demand for advanced gearbox solutions. Strategic investments in research and development, particularly in the areas of smart technologies and sustainable manufacturing, will be crucial for market leaders. Furthermore, the expansion into emerging economies and the development of specialized, application-specific gearboxes will open new avenues for growth. The continuous need for reliable power transmission in critical sectors like energy, manufacturing, and infrastructure ensures a sustained demand, positioning the Industrial Gearbox industry for continued prosperity and innovation.
Industrial Gearbox Industry Segmentation
-
1. Type
- 1.1. Worm Gearbox
- 1.2. Helical Gearbox
- 1.3. Bevel Helical Gearbox
- 1.4. Planetary Gearbox
- 1.5. Other Types
-
2. Application
- 2.1. Power Industry
- 2.2. Steel Industry
- 2.3. Mines and Minerals Industry
- 2.4. Wastewater Treatment Industry
- 2.5. Manufacturing Industry
- 2.6. Other Applications
Industrial Gearbox Industry Segmentation By Geography
-
1. North America
- 1.1. United States
- 1.2. Canada
- 1.3. Rest of North America
-
2. Europe
- 2.1. Germany
- 2.2. France
- 2.3. United Kingdom
- 2.4. Rest of Europe
-
3. Asia Pacific
- 3.1. China
- 3.2. India
- 3.3. Japan
- 3.4. South Korea
- 3.5. Rest of Asia Pacific
-
4. South America
- 4.1. Brazil
- 4.2. Argentina
- 4.3. Rest of South America
-
5. Middle East and Africa
- 5.1. Saudi Arabia
- 5.2. United Arab Emirates
- 5.3. South Africa
- 5.4. Rest of Middle East and Africa
Industrial Gearbox Industry Regional Market Share
Geographic Coverage of Industrial Gearbox Industry
Industrial Gearbox Industry REPORT HIGHLIGHTS
| Aspects | Details |
|---|---|
| Study Period | 2020-2034 |
| Base Year | 2025 |
| Estimated Year | 2026 |
| Forecast Period | 2026-2034 |
| Historical Period | 2020-2025 |
| Growth Rate | CAGR of 4.20% from 2020-2034 |
| Segmentation |
|
Table of Contents
- 1. Introduction
- 1.1. Research Scope
- 1.2. Market Segmentation
- 1.3. Research Objective
- 1.4. Definitions and Assumptions
- 2. Executive Summary
- 2.1. Market Snapshot
- 3. Market Dynamics
- 3.1. Market Drivers
- 3.2. Market Restrains
- 3.3. Market Trends
- 3.4. Market Opportunities
- 4. Market Factor Analysis
- 4.1. Porters Five Forces
- 4.1.1. Bargaining Power of Suppliers
- 4.1.2. Bargaining Power of Buyers
- 4.1.3. Threat of New Entrants
- 4.1.4. Threat of Substitutes
- 4.1.5. Competitive Rivalry
- 4.2. PESTEL analysis
- 4.3. BCG Analysis
- 4.3.1. Stars (High Growth, High Market Share)
- 4.3.2. Cash Cows (Low Growth, High Market Share)
- 4.3.3. Question Mark (High Growth, Low Market Share)
- 4.3.4. Dogs (Low Growth, Low Market Share)
- 4.4. Ansoff Matrix Analysis
- 4.5. Supply Chain Analysis
- 4.6. Regulatory Landscape
- 4.7. Current Market Potential and Opportunity Assessment (TAM–SAM–SOM Framework)
- 4.8. RAX Analyst Note
- 4.1. Porters Five Forces
- 5. Market Analysis, Insights and Forecast 2021-2033
- 5.1. Market Analysis, Insights and Forecast - by Type
- 5.1.1. Worm Gearbox
- 5.1.2. Helical Gearbox
- 5.1.3. Bevel Helical Gearbox
- 5.1.4. Planetary Gearbox
- 5.1.5. Other Types
- 5.2. Market Analysis, Insights and Forecast - by Application
- 5.2.1. Power Industry
- 5.2.2. Steel Industry
- 5.2.3. Mines and Minerals Industry
- 5.2.4. Wastewater Treatment Industry
- 5.2.5. Manufacturing Industry
- 5.2.6. Other Applications
- 5.3. Market Analysis, Insights and Forecast - by Region
- 5.3.1. North America
- 5.3.2. Europe
- 5.3.3. Asia Pacific
- 5.3.4. South America
- 5.3.5. Middle East and Africa
- 5.1. Market Analysis, Insights and Forecast - by Type
- 6. Global Industrial Gearbox Industry Analysis, Insights and Forecast, 2021-2033
- 6.1. Market Analysis, Insights and Forecast - by Type
- 6.1.1. Worm Gearbox
- 6.1.2. Helical Gearbox
- 6.1.3. Bevel Helical Gearbox
- 6.1.4. Planetary Gearbox
- 6.1.5. Other Types
- 6.2. Market Analysis, Insights and Forecast - by Application
- 6.2.1. Power Industry
- 6.2.2. Steel Industry
- 6.2.3. Mines and Minerals Industry
- 6.2.4. Wastewater Treatment Industry
- 6.2.5. Manufacturing Industry
- 6.2.6. Other Applications
- 6.1. Market Analysis, Insights and Forecast - by Type
- 7. North America Industrial Gearbox Industry Analysis, Insights and Forecast, 2020-2032
- 7.1. Market Analysis, Insights and Forecast - by Type
- 7.1.1. Worm Gearbox
- 7.1.2. Helical Gearbox
- 7.1.3. Bevel Helical Gearbox
- 7.1.4. Planetary Gearbox
- 7.1.5. Other Types
- 7.2. Market Analysis, Insights and Forecast - by Application
- 7.2.1. Power Industry
- 7.2.2. Steel Industry
- 7.2.3. Mines and Minerals Industry
- 7.2.4. Wastewater Treatment Industry
- 7.2.5. Manufacturing Industry
- 7.2.6. Other Applications
- 7.1. Market Analysis, Insights and Forecast - by Type
- 8. Europe Industrial Gearbox Industry Analysis, Insights and Forecast, 2020-2032
- 8.1. Market Analysis, Insights and Forecast - by Type
- 8.1.1. Worm Gearbox
- 8.1.2. Helical Gearbox
- 8.1.3. Bevel Helical Gearbox
- 8.1.4. Planetary Gearbox
- 8.1.5. Other Types
- 8.2. Market Analysis, Insights and Forecast - by Application
- 8.2.1. Power Industry
- 8.2.2. Steel Industry
- 8.2.3. Mines and Minerals Industry
- 8.2.4. Wastewater Treatment Industry
- 8.2.5. Manufacturing Industry
- 8.2.6. Other Applications
- 8.1. Market Analysis, Insights and Forecast - by Type
- 9. Asia Pacific Industrial Gearbox Industry Analysis, Insights and Forecast, 2020-2032
- 9.1. Market Analysis, Insights and Forecast - by Type
- 9.1.1. Worm Gearbox
- 9.1.2. Helical Gearbox
- 9.1.3. Bevel Helical Gearbox
- 9.1.4. Planetary Gearbox
- 9.1.5. Other Types
- 9.2. Market Analysis, Insights and Forecast - by Application
- 9.2.1. Power Industry
- 9.2.2. Steel Industry
- 9.2.3. Mines and Minerals Industry
- 9.2.4. Wastewater Treatment Industry
- 9.2.5. Manufacturing Industry
- 9.2.6. Other Applications
- 9.1. Market Analysis, Insights and Forecast - by Type
- 10. South America Industrial Gearbox Industry Analysis, Insights and Forecast, 2020-2032
- 10.1. Market Analysis, Insights and Forecast - by Type
- 10.1.1. Worm Gearbox
- 10.1.2. Helical Gearbox
- 10.1.3. Bevel Helical Gearbox
- 10.1.4. Planetary Gearbox
- 10.1.5. Other Types
- 10.2. Market Analysis, Insights and Forecast - by Application
- 10.2.1. Power Industry
- 10.2.2. Steel Industry
- 10.2.3. Mines and Minerals Industry
- 10.2.4. Wastewater Treatment Industry
- 10.2.5. Manufacturing Industry
- 10.2.6. Other Applications
- 10.1. Market Analysis, Insights and Forecast - by Type
- 11. Middle East and Africa Industrial Gearbox Industry Analysis, Insights and Forecast, 2020-2032
- 11.1. Market Analysis, Insights and Forecast - by Type
- 11.1.1. Worm Gearbox
- 11.1.2. Helical Gearbox
- 11.1.3. Bevel Helical Gearbox
- 11.1.4. Planetary Gearbox
- 11.1.5. Other Types
- 11.2. Market Analysis, Insights and Forecast - by Application
- 11.2.1. Power Industry
- 11.2.2. Steel Industry
- 11.2.3. Mines and Minerals Industry
- 11.2.4. Wastewater Treatment Industry
- 11.2.5. Manufacturing Industry
- 11.2.6. Other Applications
- 11.1. Market Analysis, Insights and Forecast - by Type
- 12. Competitive Analysis
- 12.1. Company Profiles
- 12.1.1 Flender Ltd
- 12.1.1.1. Company Overview
- 12.1.1.2. Products
- 12.1.1.3. Company Financials
- 12.1.1.4. SWOT Analysis
- 12.1.2 Sew-Eurodrive GmbH & Co KG
- 12.1.2.1. Company Overview
- 12.1.2.2. Products
- 12.1.2.3. Company Financials
- 12.1.2.4. SWOT Analysis
- 12.1.3 Bosch Rexroth AG
- 12.1.3.1. Company Overview
- 12.1.3.2. Products
- 12.1.3.3. Company Financials
- 12.1.3.4. SWOT Analysis
- 12.1.4 INGECO GEARS Pvt Ltd
- 12.1.4.1. Company Overview
- 12.1.4.2. Products
- 12.1.4.3. Company Financials
- 12.1.4.4. SWOT Analysis
- 12.1.5 Essential Power Transmission Pvt Ltd
- 12.1.5.1. Company Overview
- 12.1.5.2. Products
- 12.1.5.3. Company Financials
- 12.1.5.4. SWOT Analysis
- 12.1.6 Getriebebau NORD GmbH & Co KG
- 12.1.6.1. Company Overview
- 12.1.6.2. Products
- 12.1.6.3. Company Financials
- 12.1.6.4. SWOT Analysis
- 12.1.7 Nanjing High Accurate Drive Equipment Manufacturing Group Co Ltd
- 12.1.7.1. Company Overview
- 12.1.7.2. Products
- 12.1.7.3. Company Financials
- 12.1.7.4. SWOT Analysis
- 12.1.8 Zollern GmbH & Co KG
- 12.1.8.1. Company Overview
- 12.1.8.2. Products
- 12.1.8.3. Company Financials
- 12.1.8.4. SWOT Analysis
- 12.1.9 Lenze SE
- 12.1.9.1. Company Overview
- 12.1.9.2. Products
- 12.1.9.3. Company Financials
- 12.1.9.4. SWOT Analysis
- 12.1.10 Kngear
- 12.1.10.1. Company Overview
- 12.1.10.2. Products
- 12.1.10.3. Company Financials
- 12.1.10.4. SWOT Analysis
- 12.1.11 Elecon Engineering Company Limited
- 12.1.11.1. Company Overview
- 12.1.11.2. Products
- 12.1.11.3. Company Financials
- 12.1.11.4. SWOT Analysis
- 12.1.12 Bonfiglioli Drives Co Ltd
- 12.1.12.1. Company Overview
- 12.1.12.2. Products
- 12.1.12.3. Company Financials
- 12.1.12.4. SWOT Analysis
- 12.1.1 Flender Ltd
- 12.2. Market Entropy
- 12.2.1 Company's Key Areas Served
- 12.2.2 Recent Developments
- 12.3. Company Market Share Analysis 2025
- 12.3.1 Top 5 Companies Market Share Analysis
- 12.3.2 Top 3 Companies Market Share Analysis
- 12.4. List of Potential Customers
- 13. Research Methodology
List of Figures
- Figure 1: Global Industrial Gearbox Industry Revenue Breakdown (Million, %) by Region 2025 & 2033
- Figure 2: Global Industrial Gearbox Industry Volume Breakdown (K Unit, %) by Region 2025 & 2033
- Figure 3: North America Industrial Gearbox Industry Revenue (Million), by Type 2025 & 2033
- Figure 4: North America Industrial Gearbox Industry Volume (K Unit), by Type 2025 & 2033
- Figure 5: North America Industrial Gearbox Industry Revenue Share (%), by Type 2025 & 2033
- Figure 6: North America Industrial Gearbox Industry Volume Share (%), by Type 2025 & 2033
- Figure 7: North America Industrial Gearbox Industry Revenue (Million), by Application 2025 & 2033
- Figure 8: North America Industrial Gearbox Industry Volume (K Unit), by Application 2025 & 2033
- Figure 9: North America Industrial Gearbox Industry Revenue Share (%), by Application 2025 & 2033
- Figure 10: North America Industrial Gearbox Industry Volume Share (%), by Application 2025 & 2033
- Figure 11: North America Industrial Gearbox Industry Revenue (Million), by Country 2025 & 2033
- Figure 12: North America Industrial Gearbox Industry Volume (K Unit), by Country 2025 & 2033
- Figure 13: North America Industrial Gearbox Industry Revenue Share (%), by Country 2025 & 2033
- Figure 14: North America Industrial Gearbox Industry Volume Share (%), by Country 2025 & 2033
- Figure 15: Europe Industrial Gearbox Industry Revenue (Million), by Type 2025 & 2033
- Figure 16: Europe Industrial Gearbox Industry Volume (K Unit), by Type 2025 & 2033
- Figure 17: Europe Industrial Gearbox Industry Revenue Share (%), by Type 2025 & 2033
- Figure 18: Europe Industrial Gearbox Industry Volume Share (%), by Type 2025 & 2033
- Figure 19: Europe Industrial Gearbox Industry Revenue (Million), by Application 2025 & 2033
- Figure 20: Europe Industrial Gearbox Industry Volume (K Unit), by Application 2025 & 2033
- Figure 21: Europe Industrial Gearbox Industry Revenue Share (%), by Application 2025 & 2033
- Figure 22: Europe Industrial Gearbox Industry Volume Share (%), by Application 2025 & 2033
- Figure 23: Europe Industrial Gearbox Industry Revenue (Million), by Country 2025 & 2033
- Figure 24: Europe Industrial Gearbox Industry Volume (K Unit), by Country 2025 & 2033
- Figure 25: Europe Industrial Gearbox Industry Revenue Share (%), by Country 2025 & 2033
- Figure 26: Europe Industrial Gearbox Industry Volume Share (%), by Country 2025 & 2033
- Figure 27: Asia Pacific Industrial Gearbox Industry Revenue (Million), by Type 2025 & 2033
- Figure 28: Asia Pacific Industrial Gearbox Industry Volume (K Unit), by Type 2025 & 2033
- Figure 29: Asia Pacific Industrial Gearbox Industry Revenue Share (%), by Type 2025 & 2033
- Figure 30: Asia Pacific Industrial Gearbox Industry Volume Share (%), by Type 2025 & 2033
- Figure 31: Asia Pacific Industrial Gearbox Industry Revenue (Million), by Application 2025 & 2033
- Figure 32: Asia Pacific Industrial Gearbox Industry Volume (K Unit), by Application 2025 & 2033
- Figure 33: Asia Pacific Industrial Gearbox Industry Revenue Share (%), by Application 2025 & 2033
- Figure 34: Asia Pacific Industrial Gearbox Industry Volume Share (%), by Application 2025 & 2033
- Figure 35: Asia Pacific Industrial Gearbox Industry Revenue (Million), by Country 2025 & 2033
- Figure 36: Asia Pacific Industrial Gearbox Industry Volume (K Unit), by Country 2025 & 2033
- Figure 37: Asia Pacific Industrial Gearbox Industry Revenue Share (%), by Country 2025 & 2033
- Figure 38: Asia Pacific Industrial Gearbox Industry Volume Share (%), by Country 2025 & 2033
- Figure 39: South America Industrial Gearbox Industry Revenue (Million), by Type 2025 & 2033
- Figure 40: South America Industrial Gearbox Industry Volume (K Unit), by Type 2025 & 2033
- Figure 41: South America Industrial Gearbox Industry Revenue Share (%), by Type 2025 & 2033
- Figure 42: South America Industrial Gearbox Industry Volume Share (%), by Type 2025 & 2033
- Figure 43: South America Industrial Gearbox Industry Revenue (Million), by Application 2025 & 2033
- Figure 44: South America Industrial Gearbox Industry Volume (K Unit), by Application 2025 & 2033
- Figure 45: South America Industrial Gearbox Industry Revenue Share (%), by Application 2025 & 2033
- Figure 46: South America Industrial Gearbox Industry Volume Share (%), by Application 2025 & 2033
- Figure 47: South America Industrial Gearbox Industry Revenue (Million), by Country 2025 & 2033
- Figure 48: South America Industrial Gearbox Industry Volume (K Unit), by Country 2025 & 2033
- Figure 49: South America Industrial Gearbox Industry Revenue Share (%), by Country 2025 & 2033
- Figure 50: South America Industrial Gearbox Industry Volume Share (%), by Country 2025 & 2033
- Figure 51: Middle East and Africa Industrial Gearbox Industry Revenue (Million), by Type 2025 & 2033
- Figure 52: Middle East and Africa Industrial Gearbox Industry Volume (K Unit), by Type 2025 & 2033
- Figure 53: Middle East and Africa Industrial Gearbox Industry Revenue Share (%), by Type 2025 & 2033
- Figure 54: Middle East and Africa Industrial Gearbox Industry Volume Share (%), by Type 2025 & 2033
- Figure 55: Middle East and Africa Industrial Gearbox Industry Revenue (Million), by Application 2025 & 2033
- Figure 56: Middle East and Africa Industrial Gearbox Industry Volume (K Unit), by Application 2025 & 2033
- Figure 57: Middle East and Africa Industrial Gearbox Industry Revenue Share (%), by Application 2025 & 2033
- Figure 58: Middle East and Africa Industrial Gearbox Industry Volume Share (%), by Application 2025 & 2033
- Figure 59: Middle East and Africa Industrial Gearbox Industry Revenue (Million), by Country 2025 & 2033
- Figure 60: Middle East and Africa Industrial Gearbox Industry Volume (K Unit), by Country 2025 & 2033
- Figure 61: Middle East and Africa Industrial Gearbox Industry Revenue Share (%), by Country 2025 & 2033
- Figure 62: Middle East and Africa Industrial Gearbox Industry Volume Share (%), by Country 2025 & 2033
List of Tables
- Table 1: Global Industrial Gearbox Industry Revenue Million Forecast, by Type 2020 & 2033
- Table 2: Global Industrial Gearbox Industry Volume K Unit Forecast, by Type 2020 & 2033
- Table 3: Global Industrial Gearbox Industry Revenue Million Forecast, by Application 2020 & 2033
- Table 4: Global Industrial Gearbox Industry Volume K Unit Forecast, by Application 2020 & 2033
- Table 5: Global Industrial Gearbox Industry Revenue Million Forecast, by Region 2020 & 2033
- Table 6: Global Industrial Gearbox Industry Volume K Unit Forecast, by Region 2020 & 2033
- Table 7: Global Industrial Gearbox Industry Revenue Million Forecast, by Type 2020 & 2033
- Table 8: Global Industrial Gearbox Industry Volume K Unit Forecast, by Type 2020 & 2033
- Table 9: Global Industrial Gearbox Industry Revenue Million Forecast, by Application 2020 & 2033
- Table 10: Global Industrial Gearbox Industry Volume K Unit Forecast, by Application 2020 & 2033
- Table 11: Global Industrial Gearbox Industry Revenue Million Forecast, by Country 2020 & 2033
- Table 12: Global Industrial Gearbox Industry Volume K Unit Forecast, by Country 2020 & 2033
- Table 13: United States Industrial Gearbox Industry Revenue (Million) Forecast, by Application 2020 & 2033
- Table 14: United States Industrial Gearbox Industry Volume (K Unit) Forecast, by Application 2020 & 2033
- Table 15: Canada Industrial Gearbox Industry Revenue (Million) Forecast, by Application 2020 & 2033
- Table 16: Canada Industrial Gearbox Industry Volume (K Unit) Forecast, by Application 2020 & 2033
- Table 17: Rest of North America Industrial Gearbox Industry Revenue (Million) Forecast, by Application 2020 & 2033
- Table 18: Rest of North America Industrial Gearbox Industry Volume (K Unit) Forecast, by Application 2020 & 2033
- Table 19: Global Industrial Gearbox Industry Revenue Million Forecast, by Type 2020 & 2033
- Table 20: Global Industrial Gearbox Industry Volume K Unit Forecast, by Type 2020 & 2033
- Table 21: Global Industrial Gearbox Industry Revenue Million Forecast, by Application 2020 & 2033
- Table 22: Global Industrial Gearbox Industry Volume K Unit Forecast, by Application 2020 & 2033
- Table 23: Global Industrial Gearbox Industry Revenue Million Forecast, by Country 2020 & 2033
- Table 24: Global Industrial Gearbox Industry Volume K Unit Forecast, by Country 2020 & 2033
- Table 25: Germany Industrial Gearbox Industry Revenue (Million) Forecast, by Application 2020 & 2033
- Table 26: Germany Industrial Gearbox Industry Volume (K Unit) Forecast, by Application 2020 & 2033
- Table 27: France Industrial Gearbox Industry Revenue (Million) Forecast, by Application 2020 & 2033
- Table 28: France Industrial Gearbox Industry Volume (K Unit) Forecast, by Application 2020 & 2033
- Table 29: United Kingdom Industrial Gearbox Industry Revenue (Million) Forecast, by Application 2020 & 2033
- Table 30: United Kingdom Industrial Gearbox Industry Volume (K Unit) Forecast, by Application 2020 & 2033
- Table 31: Rest of Europe Industrial Gearbox Industry Revenue (Million) Forecast, by Application 2020 & 2033
- Table 32: Rest of Europe Industrial Gearbox Industry Volume (K Unit) Forecast, by Application 2020 & 2033
- Table 33: Global Industrial Gearbox Industry Revenue Million Forecast, by Type 2020 & 2033
- Table 34: Global Industrial Gearbox Industry Volume K Unit Forecast, by Type 2020 & 2033
- Table 35: Global Industrial Gearbox Industry Revenue Million Forecast, by Application 2020 & 2033
- Table 36: Global Industrial Gearbox Industry Volume K Unit Forecast, by Application 2020 & 2033
- Table 37: Global Industrial Gearbox Industry Revenue Million Forecast, by Country 2020 & 2033
- Table 38: Global Industrial Gearbox Industry Volume K Unit Forecast, by Country 2020 & 2033
- Table 39: China Industrial Gearbox Industry Revenue (Million) Forecast, by Application 2020 & 2033
- Table 40: China Industrial Gearbox Industry Volume (K Unit) Forecast, by Application 2020 & 2033
- Table 41: India Industrial Gearbox Industry Revenue (Million) Forecast, by Application 2020 & 2033
- Table 42: India Industrial Gearbox Industry Volume (K Unit) Forecast, by Application 2020 & 2033
- Table 43: Japan Industrial Gearbox Industry Revenue (Million) Forecast, by Application 2020 & 2033
- Table 44: Japan Industrial Gearbox Industry Volume (K Unit) Forecast, by Application 2020 & 2033
- Table 45: South Korea Industrial Gearbox Industry Revenue (Million) Forecast, by Application 2020 & 2033
- Table 46: South Korea Industrial Gearbox Industry Volume (K Unit) Forecast, by Application 2020 & 2033
- Table 47: Rest of Asia Pacific Industrial Gearbox Industry Revenue (Million) Forecast, by Application 2020 & 2033
- Table 48: Rest of Asia Pacific Industrial Gearbox Industry Volume (K Unit) Forecast, by Application 2020 & 2033
- Table 49: Global Industrial Gearbox Industry Revenue Million Forecast, by Type 2020 & 2033
- Table 50: Global Industrial Gearbox Industry Volume K Unit Forecast, by Type 2020 & 2033
- Table 51: Global Industrial Gearbox Industry Revenue Million Forecast, by Application 2020 & 2033
- Table 52: Global Industrial Gearbox Industry Volume K Unit Forecast, by Application 2020 & 2033
- Table 53: Global Industrial Gearbox Industry Revenue Million Forecast, by Country 2020 & 2033
- Table 54: Global Industrial Gearbox Industry Volume K Unit Forecast, by Country 2020 & 2033
- Table 55: Brazil Industrial Gearbox Industry Revenue (Million) Forecast, by Application 2020 & 2033
- Table 56: Brazil Industrial Gearbox Industry Volume (K Unit) Forecast, by Application 2020 & 2033
- Table 57: Argentina Industrial Gearbox Industry Revenue (Million) Forecast, by Application 2020 & 2033
- Table 58: Argentina Industrial Gearbox Industry Volume (K Unit) Forecast, by Application 2020 & 2033
- Table 59: Rest of South America Industrial Gearbox Industry Revenue (Million) Forecast, by Application 2020 & 2033
- Table 60: Rest of South America Industrial Gearbox Industry Volume (K Unit) Forecast, by Application 2020 & 2033
- Table 61: Global Industrial Gearbox Industry Revenue Million Forecast, by Type 2020 & 2033
- Table 62: Global Industrial Gearbox Industry Volume K Unit Forecast, by Type 2020 & 2033
- Table 63: Global Industrial Gearbox Industry Revenue Million Forecast, by Application 2020 & 2033
- Table 64: Global Industrial Gearbox Industry Volume K Unit Forecast, by Application 2020 & 2033
- Table 65: Global Industrial Gearbox Industry Revenue Million Forecast, by Country 2020 & 2033
- Table 66: Global Industrial Gearbox Industry Volume K Unit Forecast, by Country 2020 & 2033
- Table 67: Saudi Arabia Industrial Gearbox Industry Revenue (Million) Forecast, by Application 2020 & 2033
- Table 68: Saudi Arabia Industrial Gearbox Industry Volume (K Unit) Forecast, by Application 2020 & 2033
- Table 69: United Arab Emirates Industrial Gearbox Industry Revenue (Million) Forecast, by Application 2020 & 2033
- Table 70: United Arab Emirates Industrial Gearbox Industry Volume (K Unit) Forecast, by Application 2020 & 2033
- Table 71: South Africa Industrial Gearbox Industry Revenue (Million) Forecast, by Application 2020 & 2033
- Table 72: South Africa Industrial Gearbox Industry Volume (K Unit) Forecast, by Application 2020 & 2033
- Table 73: Rest of Middle East and Africa Industrial Gearbox Industry Revenue (Million) Forecast, by Application 2020 & 2033
- Table 74: Rest of Middle East and Africa Industrial Gearbox Industry Volume (K Unit) Forecast, by Application 2020 & 2033
Frequently Asked Questions
1. What is the projected Compound Annual Growth Rate (CAGR) of the Industrial Gearbox Industry?
The projected CAGR is approximately 4.20%.
2. Which companies are prominent players in the Industrial Gearbox Industry?
Key companies in the market include Flender Ltd, Sew-Eurodrive GmbH & Co KG, Bosch Rexroth AG, INGECO GEARS Pvt Ltd, Essential Power Transmission Pvt Ltd, Getriebebau NORD GmbH & Co KG, Nanjing High Accurate Drive Equipment Manufacturing Group Co Ltd, Zollern GmbH & Co KG, Lenze SE, Kngear, Elecon Engineering Company Limited, Bonfiglioli Drives Co Ltd.
3. What are the main segments of the Industrial Gearbox Industry?
The market segments include Type, Application.
4. Can you provide details about the market size?
The market size is estimated to be USD 28.33 Million as of 2022.
5. What are some drivers contributing to market growth?
4.; Growing Adoption of Industrial Automation across Various Industrial Sectors4.; Rising Sales for Automobiles across the World.
6. What are the notable trends driving market growth?
Helical Gearbox Type Segment to Dominate the Market.
7. Are there any restraints impacting market growth?
4.; Slow Down in Economic and Industrial Activities.
8. Can you provide examples of recent developments in the market?
May 2023: Triumph Group, Inc. announced that it had been awarded a long-term agreement from General Electric (GE) through its Geared Solutions business for LEAP-1A, LEAP-1B, and LEAP-1C programs. TRIUMPH has collaborated with GE on LEAP and CFM56 IGBs for over 35 years, shipping over 25,000 gearboxes till now. TRIUMPH will supply thousands of IGBs annually to GE into the next decade with this contract extension.
9. What pricing options are available for accessing the report?
Pricing options include single-user, multi-user, and enterprise licenses priced at USD 4750, USD 5250, and USD 8750 respectively.
10. Is the market size provided in terms of value or volume?
The market size is provided in terms of value, measured in Million and volume, measured in K Unit.
11. Are there any specific market keywords associated with the report?
Yes, the market keyword associated with the report is "Industrial Gearbox Industry," which aids in identifying and referencing the specific market segment covered.
12. How do I determine which pricing option suits my needs best?
The pricing options vary based on user requirements and access needs. Individual users may opt for single-user licenses, while businesses requiring broader access may choose multi-user or enterprise licenses for cost-effective access to the report.
13. Are there any additional resources or data provided in the Industrial Gearbox Industry report?
While the report offers comprehensive insights, it's advisable to review the specific contents or supplementary materials provided to ascertain if additional resources or data are available.
14. How can I stay updated on further developments or reports in the Industrial Gearbox Industry?
To stay informed about further developments, trends, and reports in the Industrial Gearbox Industry, consider subscribing to industry newsletters, following relevant companies and organizations, or regularly checking reputable industry news sources and publications.
Methodology
Step 1 - Identification of Relevant Samples Size from Population Database


Step 2 - Approaches for Defining Global Market Size (Value, Volume* & Price*)

Note*: In applicable scenarios
Step 3 - Data Sources
Primary Research
- Web Analytics
- Survey Reports
- Research Institute
- Latest Research Reports
- Opinion Leaders
Secondary Research
- Annual Reports
- White Paper
- Latest Press Release
- Industry Association
- Paid Database
- Investor Presentations

Step 4 - Data Triangulation
Involves using different sources of information in order to increase the validity of a study
These sources are likely to be stakeholders in a program - participants, other researchers, program staff, other community members, and so on.
Then we put all data in single framework & apply various statistical tools to find out the dynamic on the market.
During the analysis stage, feedback from the stakeholder groups would be compared to determine areas of agreement as well as areas of divergence