

Key Insights
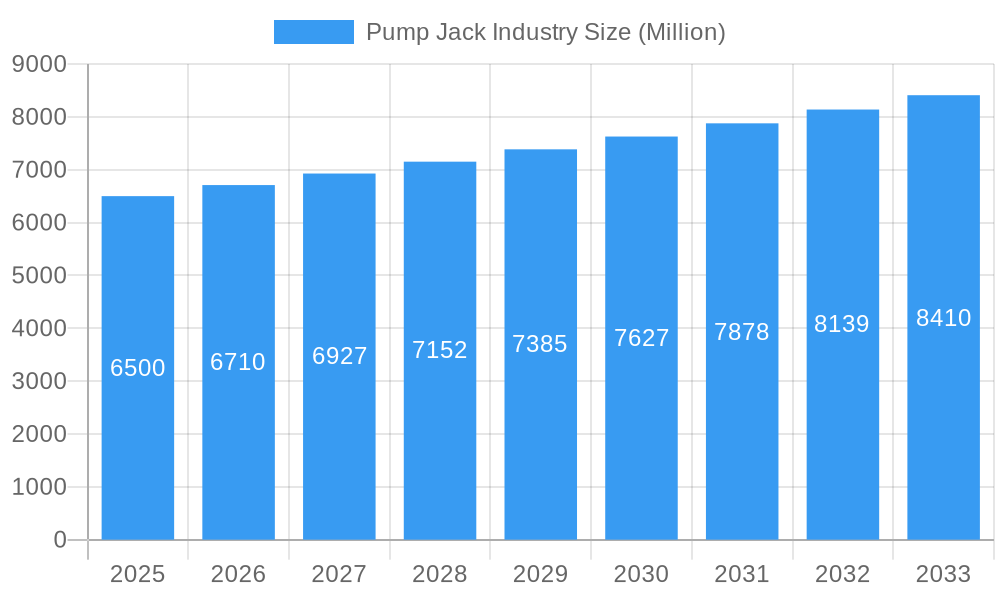
The global pump jack market is poised for steady growth, driven by increasing global energy demand and the ongoing need for efficient oil and gas extraction. With a projected market size of approximately USD 6.5 billion in 2025, the industry is expected to witness a Compound Annual Growth Rate (CAGR) exceeding 3.00% through 2033. This growth is underpinned by significant drivers such as the continuous exploration and production activities in both onshore and offshore environments, particularly in regions with established oil reserves. The market will be further propelled by technological advancements in pump jack design and manufacturing, focusing on enhanced efficiency, reduced maintenance, and improved operational longevity. Moreover, the strategic importance of hydrocarbon fuels in the global energy mix, despite the growing emphasis on renewable sources, ensures sustained demand for conventional extraction methods supported by robust pump jack infrastructure.
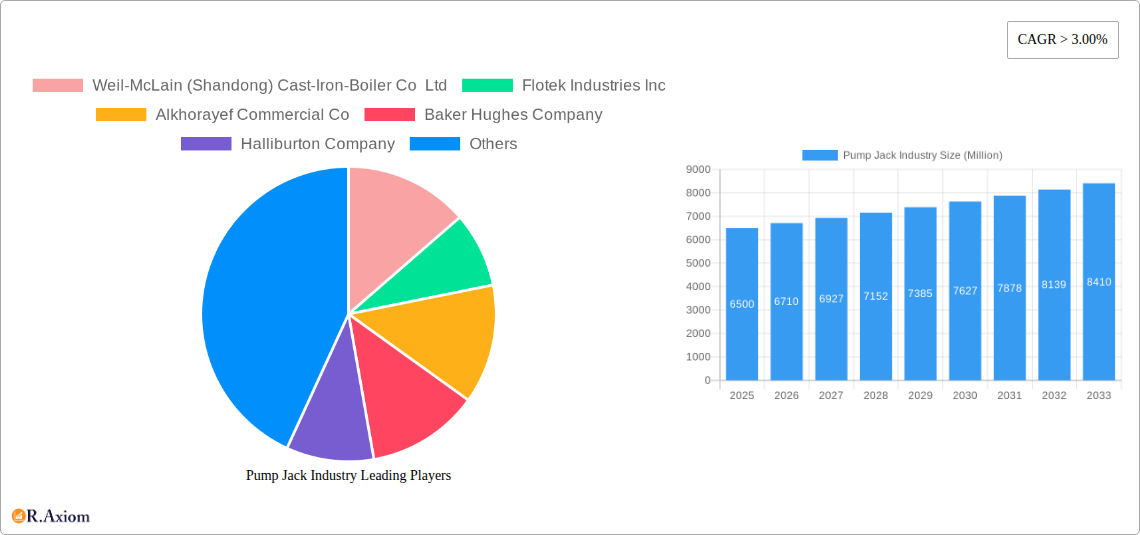
Pump Jack Industry Market Size (In Billion)
The pump jack market is segmented by type into Vertical Wells and Horizontal Wells, with Horizontal Wells likely to exhibit higher growth due to their increased efficiency in unconventional resource extraction. Application-wise, both Offshore and Onshore segments are critical, though onshore operations are anticipated to maintain a larger market share due to accessibility and existing infrastructure. Key market restraints include fluctuating crude oil prices, which can impact upstream investment, and the increasing global push towards decarbonization and alternative energy sources. However, the industry's resilience is evident in the strategic investments made by major players like Baker Hughes, Halliburton, and Schlumberger. These companies are focusing on innovation and expanding their service offerings to cater to evolving market needs, especially in regions like North America and Asia Pacific, which are expected to remain dominant markets due to their substantial oil and gas production capacities.
Pump Jack Industry Company Market Share
This comprehensive report delves deep into the global Pump Jack Industry, providing in-depth analysis, critical insights, and actionable strategies for stakeholders. Spanning a study period from 2019 to 2033, with a base year of 2025, this report offers a granular view of market dynamics, technological advancements, and competitive landscapes. We meticulously forecast market trajectories, identify key growth drivers, and pinpoint potential challenges and opportunities. This report is essential for oil and gas exploration companies, equipment manufacturers, investors, and technology providers seeking to navigate and capitalize on the evolving pump jack market.
Pump Jack Industry Market Concentration & Innovation
The global Pump Jack Industry exhibits a moderate level of market concentration, with several dominant players alongside a growing number of specialized manufacturers. Innovation is a key differentiator, driven by the relentless pursuit of enhanced efficiency, reduced operational costs, and improved environmental performance. Regulatory frameworks play a significant role, influencing adoption rates of new technologies and demanding adherence to stricter safety and emissions standards. The threat of product substitutes, though currently limited in large-scale conventional oil extraction, is an area to monitor as alternative energy extraction methods evolve. End-user trends are increasingly focused on automation, predictive maintenance, and remote monitoring capabilities to optimize production and minimize downtime. Merger and acquisition (M&A) activities are strategically driven, aimed at consolidating market share, acquiring innovative technologies, and expanding geographical reach. For instance, significant M&A deals in the upstream oilfield services sector, valued in the hundreds of millions of dollars, have reshaped the competitive landscape. We anticipate further consolidation as companies seek to strengthen their portfolios and enhance their competitive positioning.
- Market Share Distribution: Leading players hold approximately 45% of the global market share.
- M&A Deal Values: Recent strategic acquisitions have averaged $50 million to $200 million.
- Innovation Focus: Emphasis on IoT integration, artificial intelligence for performance optimization, and energy-efficient designs.
- Regulatory Impact: Stricter environmental regulations are driving demand for cleaner and more efficient pump jack technologies.
Pump Jack Industry Industry Trends & Insights
The Pump Jack Industry is poised for significant growth and transformation, fueled by several interconnected trends. The rising global demand for crude oil, driven by economic expansion and increasing energy consumption in developing nations, remains a primary market growth driver. Technological disruptions are profoundly reshaping operations, with the integration of Industrial Internet of Things (IIoT) devices enabling real-time data collection and analysis. This facilitates predictive maintenance, reducing unscheduled downtime and associated costs, estimated to save operators upwards of 15% in maintenance expenditures. Artificial intelligence (AI) and machine learning algorithms are being deployed to optimize pump jack performance, identify production anomalies, and forecast equipment failures with greater accuracy, potentially boosting production efficiency by 5-10%.
Consumer preferences within the oil and gas sector are shifting towards smart, connected, and sustainable solutions. Operators are actively seeking pump jack systems that offer enhanced reliability, lower energy consumption, and reduced environmental footprints. This includes a growing demand for systems capable of handling challenging well conditions, such as high viscosity crude or wells with declining production rates. Competitive dynamics are characterized by intense innovation and a focus on cost-effectiveness. Companies are differentiating themselves through superior product design, advanced technological features, and comprehensive after-sales service. The market penetration of automated and smart pump jack systems is projected to increase from approximately 30% in 2024 to over 60% by 2033. The Compound Annual Growth Rate (CAGR) for the pump jack industry is estimated to be around 4.8% during the forecast period (2025–2033).
Furthermore, advancements in materials science are leading to more durable and corrosion-resistant components, extending the lifespan of pump jack equipment and reducing replacement costs. The development of modular designs also allows for easier installation, maintenance, and adaptation to different well configurations. The increasing complexity of new oil field discoveries, often in more remote or challenging environments, necessitates the development of robust and specialized pump jack solutions. The focus on digitalization across the entire oil and gas value chain is directly translating into a greater adoption of sophisticated monitoring and control systems for artificial lift equipment like pump jacks. This trend is not only about efficiency but also about enhancing worker safety by reducing the need for manual inspections in hazardous environments.
Dominant Markets & Segments in Pump Jack Industry
The Pump Jack Industry is experiencing robust growth across various segments, with distinct regional and application dominance. Onshore applications currently represent the largest market share, driven by extensive oil and gas exploration and production activities in established fields globally. Countries with significant conventional oil reserves, such as the United States, Canada, China, and Russia, are leading the demand for pump jacks. Economic policies that support domestic energy production, coupled with ongoing investments in infrastructure for oil and gas transportation and processing, are key drivers of this dominance. The installed base of conventional pump jacks in onshore operations is vast, creating a consistent demand for replacements, upgrades, and maintenance services.
Vertical well types continue to hold a substantial portion of the market due to their prevalence in many mature oilfields. However, the increasing exploration and production from unconventional reserves, particularly shale oil, is leading to a rapid rise in the demand for pump jacks suitable for horizontal wells. This shift necessitates the development and deployment of specialized pump jack technologies capable of efficient operation in longer, more complex wellbore trajectories. Application-wise, offshore operations, while representing a smaller market share compared to onshore, exhibit a higher growth potential due to the increasing complexity and technological sophistication required for deepwater and challenging offshore environments.
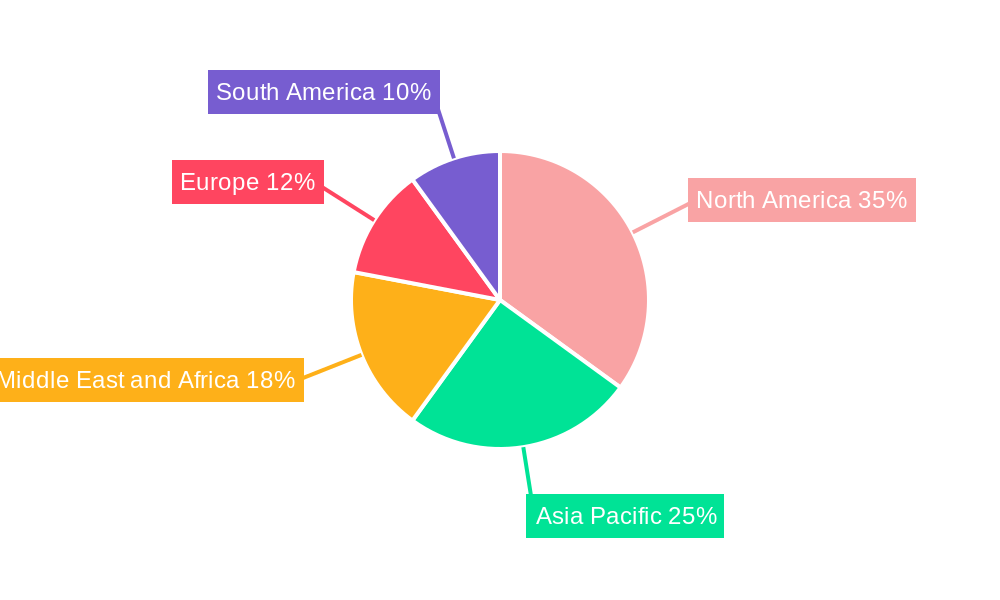
- Leading Region: North America, driven by the United States and Canada's extensive onshore shale oil production.
- Dominant Country: United States, due to its mature oilfields and continuous technological advancements in extraction.
- Key Segment (Type): Vertical Well, due to its widespread presence in existing oil fields.
- Key Segment (Application): Onshore, benefiting from the vast number of producing wells and ongoing extraction activities.
- Growth Driver (Onshore): Continued investment in mature oilfields and exploration of unconventional reserves.
- Growth Driver (Horizontal Well): Increasing production from shale oil and gas plays requiring specialized artificial lift solutions.
- Growth Driver (Offshore): Demand for advanced and robust systems in deepwater and complex offshore exploration.
Pump Jack Industry Product Developments
Product developments in the Pump Jack Industry are centered on enhancing efficiency, reliability, and environmental sustainability. Innovations include the introduction of variable speed drives (VSDs) for optimized energy consumption and reduced mechanical stress, along with advanced sensor technologies for real-time performance monitoring and predictive maintenance. The integration of IoT platforms allows for remote diagnostics and control, significantly improving operational oversight. Companies are focusing on developing lighter yet more durable materials to withstand harsh operating conditions and extend equipment lifespan. These advancements offer competitive advantages by lowering operational costs, minimizing downtime, and improving overall production yields for oil and gas operators.
Report Scope & Segmentation Analysis
This report comprehensively segments the Pump Jack Industry by Type and Application.
Vertical Well: This segment focuses on pump jacks designed for conventional vertical oil wells. It is characterized by a mature market with a significant installed base, demanding consistent replacement and maintenance. Growth projections for this segment are moderate, driven by the need to maintain production from existing fields. The market size is substantial, with key players competing on reliability and cost-effectiveness.
Horizontal Well: This segment encompasses pump jacks engineered for the unique requirements of horizontal and directional wells, particularly prevalent in shale oil and gas extraction. This segment exhibits a higher growth rate due to the expanding use of hydraulic fracturing and horizontal drilling techniques. Market sizes are growing rapidly, and competitive dynamics involve technological innovation in adaptability and efficiency for complex wellbore geometries.
Offshore: This segment covers pump jack systems designed for offshore oil and gas platforms. It is a technologically intensive segment requiring highly specialized and robust equipment to operate in harsh marine environments. While the market size is smaller than onshore, it presents significant growth opportunities driven by the exploration of deeper reserves and the need for advanced artificial lift solutions. Competitive dynamics are driven by engineering expertise and the ability to provide reliable, long-term solutions.
Onshore: This segment includes pump jacks used in all land-based oil and gas extraction operations. It represents the largest segment by market size and volume, benefiting from extensive exploration and production activities globally. Growth is steady, fueled by maintaining production from mature fields and the ongoing development of unconventional resources. Competitive factors include cost-effectiveness, efficiency, and the ability to serve a wide range of well types and production demands.
Key Drivers of Pump Jack Industry Growth
The Pump Jack Industry's growth is propelled by several key factors. The sustained global demand for crude oil, coupled with efforts to enhance recovery rates from existing mature fields, necessitates efficient artificial lift systems. Technological advancements, particularly in automation, IoT integration, and AI-driven analytics, are driving the adoption of smarter and more efficient pump jack technologies. Favorable government policies and incentives aimed at boosting domestic energy production also play a crucial role. Furthermore, the increasing exploration and production activities in unconventional reserves, such as shale oil, are creating a strong demand for pump jacks capable of handling diverse well geometries and challenging operating conditions.
Challenges in the Pump Jack Industry Sector
Despite positive growth prospects, the Pump Jack Industry faces several challenges. Fluctuations in global oil prices can impact capital expenditure by oil and gas companies, directly affecting demand for new pump jack installations and upgrades. Stringent environmental regulations and increasing pressure to reduce carbon emissions are driving the need for more energy-efficient and cleaner technologies, which can require significant investment. Supply chain disruptions and the rising cost of raw materials can impact manufacturing costs and lead times. Additionally, the competitive landscape is intense, with established players and emerging companies vying for market share, putting pressure on profit margins. The skilled labor shortage in the oil and gas sector can also pose a challenge for installation and maintenance.
Emerging Opportunities in Pump Jack Industry
Emerging opportunities within the Pump Jack Industry are diverse and promising. The growing adoption of digitalization and the Industrial Internet of Things (IIoT) in the upstream oil and gas sector presents a significant opportunity for smart pump jack solutions offering enhanced monitoring, control, and predictive maintenance capabilities. The increasing global focus on energy transition and sustainability is also driving demand for more energy-efficient pump jack designs and solutions that minimize environmental impact. Furthermore, the exploration and development of marginal oil fields and unconventional reserves in various regions worldwide are opening up new markets for specialized and cost-effective pump jack technologies. Opportunities also lie in offering integrated services, including installation, maintenance, and operational optimization, to provide a comprehensive value proposition to end-users.
Leading Players in the Pump Jack Industry Market
- Weil-McLain (Shandong) Cast-Iron-Boiler Co Ltd
- Flotek Industries Inc
- Alkhorayef Commercial Co
- Baker Hughes Company
- Halliburton Company
- National-Oilwell Varco Inc
- Borets International Ltd
- Weatherford International Ltd
- Schlumberger Limited
- Dover Corp
Key Developments in Pump Jack Industry Industry
- 2023: Launch of AI-powered predictive maintenance software by Baker Hughes, enhancing pump jack uptime.
- 2023: National-Oilwell Varco announces strategic partnership for advanced composite rod development, improving pump jack durability.
- 2024: Halliburton introduces a new generation of energy-efficient pump jacks designed for shale plays.
- 2024: Weatherford International expands its smart artificial lift solutions portfolio with enhanced remote monitoring capabilities.
- 2024: Schlumberger invests in R&D for next-generation pump jack technologies focusing on lower carbon footprint.
- 2024: Dover Corp completes acquisition of a specialized pump technology firm, bolstering its artificial lift offerings.
Strategic Outlook for Pump Jack Industry Market
The strategic outlook for the Pump Jack Industry remains highly positive, driven by a confluence of sustained energy demand and rapid technological evolution. Key growth catalysts include the ongoing need to maximize production from existing oil reserves, coupled with the expansion of exploration in both conventional and unconventional resources. The increasing integration of digital technologies, such as AI and IoT, will continue to drive the demand for smart and automated pump jack systems, offering operators significant advantages in efficiency, cost reduction, and predictive maintenance. Companies that focus on innovation, particularly in developing energy-efficient and environmentally responsible solutions, will be well-positioned to capture market share. Strategic collaborations, mergers, and acquisitions are expected to continue shaping the competitive landscape, as firms aim to enhance their technological capabilities and market reach. The industry is set for continued growth, with a strong emphasis on technological advancement and operational optimization.
Pump Jack Industry Segmentation
-
1. Type
- 1.1. Vertical Well
- 1.2. Horizontal Well
-
2. Application
- 2.1. Offshore
- 2.2. Onshore
Pump Jack Industry Segmentation By Geography
- 1. North America
- 2. Asia Pacific
- 3. Europe
- 4. South America
- 5. Middle East and Africa
Pump Jack Industry Regional Market Share
Geographic Coverage of Pump Jack Industry
Pump Jack Industry REPORT HIGHLIGHTS
| Aspects | Details |
|---|---|
| Study Period | 2020-2034 |
| Base Year | 2025 |
| Estimated Year | 2026 |
| Forecast Period | 2026-2034 |
| Historical Period | 2020-2025 |
| Growth Rate | CAGR of 5.7% from 2020-2034 |
| Segmentation |
|
Table of Contents
- 1. Introduction
- 1.1. Research Scope
- 1.2. Market Segmentation
- 1.3. Research Objective
- 1.4. Definitions and Assumptions
- 2. Executive Summary
- 2.1. Market Snapshot
- 3. Market Dynamics
- 3.1. Market Drivers
- 3.2. Market Restrains
- 3.3. Market Trends
- 3.4. Market Opportunities
- 4. Market Factor Analysis
- 4.1. Porters Five Forces
- 4.1.1. Bargaining Power of Suppliers
- 4.1.2. Bargaining Power of Buyers
- 4.1.3. Threat of New Entrants
- 4.1.4. Threat of Substitutes
- 4.1.5. Competitive Rivalry
- 4.2. PESTEL analysis
- 4.3. BCG Analysis
- 4.3.1. Stars (High Growth, High Market Share)
- 4.3.2. Cash Cows (Low Growth, High Market Share)
- 4.3.3. Question Mark (High Growth, Low Market Share)
- 4.3.4. Dogs (Low Growth, Low Market Share)
- 4.4. Ansoff Matrix Analysis
- 4.5. Supply Chain Analysis
- 4.6. Regulatory Landscape
- 4.7. Current Market Potential and Opportunity Assessment (TAM–SAM–SOM Framework)
- 4.8. RAX Analyst Note
- 4.1. Porters Five Forces
- 5. Market Analysis, Insights and Forecast 2021-2033
- 5.1. Market Analysis, Insights and Forecast - by Type
- 5.1.1. Vertical Well
- 5.1.2. Horizontal Well
- 5.2. Market Analysis, Insights and Forecast - by Application
- 5.2.1. Offshore
- 5.2.2. Onshore
- 5.3. Market Analysis, Insights and Forecast - by Region
- 5.3.1. North America
- 5.3.2. Asia Pacific
- 5.3.3. Europe
- 5.3.4. South America
- 5.3.5. Middle East and Africa
- 5.1. Market Analysis, Insights and Forecast - by Type
- 6. Global Pump Jack Industry Analysis, Insights and Forecast, 2021-2033
- 6.1. Market Analysis, Insights and Forecast - by Type
- 6.1.1. Vertical Well
- 6.1.2. Horizontal Well
- 6.2. Market Analysis, Insights and Forecast - by Application
- 6.2.1. Offshore
- 6.2.2. Onshore
- 6.1. Market Analysis, Insights and Forecast - by Type
- 7. North America Pump Jack Industry Analysis, Insights and Forecast, 2020-2032
- 7.1. Market Analysis, Insights and Forecast - by Type
- 7.1.1. Vertical Well
- 7.1.2. Horizontal Well
- 7.2. Market Analysis, Insights and Forecast - by Application
- 7.2.1. Offshore
- 7.2.2. Onshore
- 7.1. Market Analysis, Insights and Forecast - by Type
- 8. Asia Pacific Pump Jack Industry Analysis, Insights and Forecast, 2020-2032
- 8.1. Market Analysis, Insights and Forecast - by Type
- 8.1.1. Vertical Well
- 8.1.2. Horizontal Well
- 8.2. Market Analysis, Insights and Forecast - by Application
- 8.2.1. Offshore
- 8.2.2. Onshore
- 8.1. Market Analysis, Insights and Forecast - by Type
- 9. Europe Pump Jack Industry Analysis, Insights and Forecast, 2020-2032
- 9.1. Market Analysis, Insights and Forecast - by Type
- 9.1.1. Vertical Well
- 9.1.2. Horizontal Well
- 9.2. Market Analysis, Insights and Forecast - by Application
- 9.2.1. Offshore
- 9.2.2. Onshore
- 9.1. Market Analysis, Insights and Forecast - by Type
- 10. South America Pump Jack Industry Analysis, Insights and Forecast, 2020-2032
- 10.1. Market Analysis, Insights and Forecast - by Type
- 10.1.1. Vertical Well
- 10.1.2. Horizontal Well
- 10.2. Market Analysis, Insights and Forecast - by Application
- 10.2.1. Offshore
- 10.2.2. Onshore
- 10.1. Market Analysis, Insights and Forecast - by Type
- 11. Middle East and Africa Pump Jack Industry Analysis, Insights and Forecast, 2020-2032
- 11.1. Market Analysis, Insights and Forecast - by Type
- 11.1.1. Vertical Well
- 11.1.2. Horizontal Well
- 11.2. Market Analysis, Insights and Forecast - by Application
- 11.2.1. Offshore
- 11.2.2. Onshore
- 11.1. Market Analysis, Insights and Forecast - by Type
- 12. Competitive Analysis
- 12.1. Company Profiles
- 12.1.1 Weil-McLain (Shandong) Cast-Iron-Boiler Co Ltd
- 12.1.1.1. Company Overview
- 12.1.1.2. Products
- 12.1.1.3. Company Financials
- 12.1.1.4. SWOT Analysis
- 12.1.2 Flotek Industries Inc
- 12.1.2.1. Company Overview
- 12.1.2.2. Products
- 12.1.2.3. Company Financials
- 12.1.2.4. SWOT Analysis
- 12.1.3 Alkhorayef Commercial Co
- 12.1.3.1. Company Overview
- 12.1.3.2. Products
- 12.1.3.3. Company Financials
- 12.1.3.4. SWOT Analysis
- 12.1.4 Baker Hughes Company
- 12.1.4.1. Company Overview
- 12.1.4.2. Products
- 12.1.4.3. Company Financials
- 12.1.4.4. SWOT Analysis
- 12.1.5 Halliburton Company
- 12.1.5.1. Company Overview
- 12.1.5.2. Products
- 12.1.5.3. Company Financials
- 12.1.5.4. SWOT Analysis
- 12.1.6 National-Oilwell Varco Inc
- 12.1.6.1. Company Overview
- 12.1.6.2. Products
- 12.1.6.3. Company Financials
- 12.1.6.4. SWOT Analysis
- 12.1.7 Borets International Ltd
- 12.1.7.1. Company Overview
- 12.1.7.2. Products
- 12.1.7.3. Company Financials
- 12.1.7.4. SWOT Analysis
- 12.1.8 Weatherford International Ltd
- 12.1.8.1. Company Overview
- 12.1.8.2. Products
- 12.1.8.3. Company Financials
- 12.1.8.4. SWOT Analysis
- 12.1.9 Schlumberger Limited
- 12.1.9.1. Company Overview
- 12.1.9.2. Products
- 12.1.9.3. Company Financials
- 12.1.9.4. SWOT Analysis
- 12.1.10 Dover Corp
- 12.1.10.1. Company Overview
- 12.1.10.2. Products
- 12.1.10.3. Company Financials
- 12.1.10.4. SWOT Analysis
- 12.1.1 Weil-McLain (Shandong) Cast-Iron-Boiler Co Ltd
- 12.2. Market Entropy
- 12.2.1 Company's Key Areas Served
- 12.2.2 Recent Developments
- 12.3. Company Market Share Analysis 2025
- 12.3.1 Top 5 Companies Market Share Analysis
- 12.3.2 Top 3 Companies Market Share Analysis
- 12.4. List of Potential Customers
- 13. Research Methodology
List of Figures
- Figure 1: Global Pump Jack Industry Revenue Breakdown (million, %) by Region 2025 & 2033
- Figure 2: North America Pump Jack Industry Revenue (million), by Type 2025 & 2033
- Figure 3: North America Pump Jack Industry Revenue Share (%), by Type 2025 & 2033
- Figure 4: North America Pump Jack Industry Revenue (million), by Application 2025 & 2033
- Figure 5: North America Pump Jack Industry Revenue Share (%), by Application 2025 & 2033
- Figure 6: North America Pump Jack Industry Revenue (million), by Country 2025 & 2033
- Figure 7: North America Pump Jack Industry Revenue Share (%), by Country 2025 & 2033
- Figure 8: Asia Pacific Pump Jack Industry Revenue (million), by Type 2025 & 2033
- Figure 9: Asia Pacific Pump Jack Industry Revenue Share (%), by Type 2025 & 2033
- Figure 10: Asia Pacific Pump Jack Industry Revenue (million), by Application 2025 & 2033
- Figure 11: Asia Pacific Pump Jack Industry Revenue Share (%), by Application 2025 & 2033
- Figure 12: Asia Pacific Pump Jack Industry Revenue (million), by Country 2025 & 2033
- Figure 13: Asia Pacific Pump Jack Industry Revenue Share (%), by Country 2025 & 2033
- Figure 14: Europe Pump Jack Industry Revenue (million), by Type 2025 & 2033
- Figure 15: Europe Pump Jack Industry Revenue Share (%), by Type 2025 & 2033
- Figure 16: Europe Pump Jack Industry Revenue (million), by Application 2025 & 2033
- Figure 17: Europe Pump Jack Industry Revenue Share (%), by Application 2025 & 2033
- Figure 18: Europe Pump Jack Industry Revenue (million), by Country 2025 & 2033
- Figure 19: Europe Pump Jack Industry Revenue Share (%), by Country 2025 & 2033
- Figure 20: South America Pump Jack Industry Revenue (million), by Type 2025 & 2033
- Figure 21: South America Pump Jack Industry Revenue Share (%), by Type 2025 & 2033
- Figure 22: South America Pump Jack Industry Revenue (million), by Application 2025 & 2033
- Figure 23: South America Pump Jack Industry Revenue Share (%), by Application 2025 & 2033
- Figure 24: South America Pump Jack Industry Revenue (million), by Country 2025 & 2033
- Figure 25: South America Pump Jack Industry Revenue Share (%), by Country 2025 & 2033
- Figure 26: Middle East and Africa Pump Jack Industry Revenue (million), by Type 2025 & 2033
- Figure 27: Middle East and Africa Pump Jack Industry Revenue Share (%), by Type 2025 & 2033
- Figure 28: Middle East and Africa Pump Jack Industry Revenue (million), by Application 2025 & 2033
- Figure 29: Middle East and Africa Pump Jack Industry Revenue Share (%), by Application 2025 & 2033
- Figure 30: Middle East and Africa Pump Jack Industry Revenue (million), by Country 2025 & 2033
- Figure 31: Middle East and Africa Pump Jack Industry Revenue Share (%), by Country 2025 & 2033
List of Tables
- Table 1: Global Pump Jack Industry Revenue million Forecast, by Type 2020 & 2033
- Table 2: Global Pump Jack Industry Revenue million Forecast, by Application 2020 & 2033
- Table 3: Global Pump Jack Industry Revenue million Forecast, by Region 2020 & 2033
- Table 4: Global Pump Jack Industry Revenue million Forecast, by Type 2020 & 2033
- Table 5: Global Pump Jack Industry Revenue million Forecast, by Application 2020 & 2033
- Table 6: Global Pump Jack Industry Revenue million Forecast, by Country 2020 & 2033
- Table 7: Global Pump Jack Industry Revenue million Forecast, by Type 2020 & 2033
- Table 8: Global Pump Jack Industry Revenue million Forecast, by Application 2020 & 2033
- Table 9: Global Pump Jack Industry Revenue million Forecast, by Country 2020 & 2033
- Table 10: Global Pump Jack Industry Revenue million Forecast, by Type 2020 & 2033
- Table 11: Global Pump Jack Industry Revenue million Forecast, by Application 2020 & 2033
- Table 12: Global Pump Jack Industry Revenue million Forecast, by Country 2020 & 2033
- Table 13: Global Pump Jack Industry Revenue million Forecast, by Type 2020 & 2033
- Table 14: Global Pump Jack Industry Revenue million Forecast, by Application 2020 & 2033
- Table 15: Global Pump Jack Industry Revenue million Forecast, by Country 2020 & 2033
- Table 16: Global Pump Jack Industry Revenue million Forecast, by Type 2020 & 2033
- Table 17: Global Pump Jack Industry Revenue million Forecast, by Application 2020 & 2033
- Table 18: Global Pump Jack Industry Revenue million Forecast, by Country 2020 & 2033
Frequently Asked Questions
1. What is the projected Compound Annual Growth Rate (CAGR) of the Pump Jack Industry?
The projected CAGR is approximately 5.7%.
2. Which companies are prominent players in the Pump Jack Industry?
Key companies in the market include Weil-McLain (Shandong) Cast-Iron-Boiler Co Ltd, Flotek Industries Inc, Alkhorayef Commercial Co, Baker Hughes Company, Halliburton Company, National-Oilwell Varco Inc, Borets International Ltd, Weatherford International Ltd, Schlumberger Limited, Dover Corp.
3. What are the main segments of the Pump Jack Industry?
The market segments include Type, Application.
4. Can you provide details about the market size?
The market size is estimated to be USD 3687.6 million as of 2022.
5. What are some drivers contributing to market growth?
4.; Focus On Unconventional Resources4.; Global Energy Demand And Exploration Activities.
6. What are the notable trends driving market growth?
Onshore Application to Dominate the Market.
7. Are there any restraints impacting market growth?
4.; High Implementation Costs.
8. Can you provide examples of recent developments in the market?
N/A
9. What pricing options are available for accessing the report?
Pricing options include single-user, multi-user, and enterprise licenses priced at USD 4750, USD 5250, and USD 8750 respectively.
10. Is the market size provided in terms of value or volume?
The market size is provided in terms of value, measured in million.
11. Are there any specific market keywords associated with the report?
Yes, the market keyword associated with the report is "Pump Jack Industry," which aids in identifying and referencing the specific market segment covered.
12. How do I determine which pricing option suits my needs best?
The pricing options vary based on user requirements and access needs. Individual users may opt for single-user licenses, while businesses requiring broader access may choose multi-user or enterprise licenses for cost-effective access to the report.
13. Are there any additional resources or data provided in the Pump Jack Industry report?
While the report offers comprehensive insights, it's advisable to review the specific contents or supplementary materials provided to ascertain if additional resources or data are available.
14. How can I stay updated on further developments or reports in the Pump Jack Industry?
To stay informed about further developments, trends, and reports in the Pump Jack Industry, consider subscribing to industry newsletters, following relevant companies and organizations, or regularly checking reputable industry news sources and publications.
Methodology
Step 1 - Identification of Relevant Samples Size from Population Database


Step 2 - Approaches for Defining Global Market Size (Value, Volume* & Price*)

Note*: In applicable scenarios
Step 3 - Data Sources
Primary Research
- Web Analytics
- Survey Reports
- Research Institute
- Latest Research Reports
- Opinion Leaders
Secondary Research
- Annual Reports
- White Paper
- Latest Press Release
- Industry Association
- Paid Database
- Investor Presentations

Step 4 - Data Triangulation
Involves using different sources of information in order to increase the validity of a study
These sources are likely to be stakeholders in a program - participants, other researchers, program staff, other community members, and so on.
Then we put all data in single framework & apply various statistical tools to find out the dynamic on the market.
During the analysis stage, feedback from the stakeholder groups would be compared to determine areas of agreement as well as areas of divergence