
Key Insights
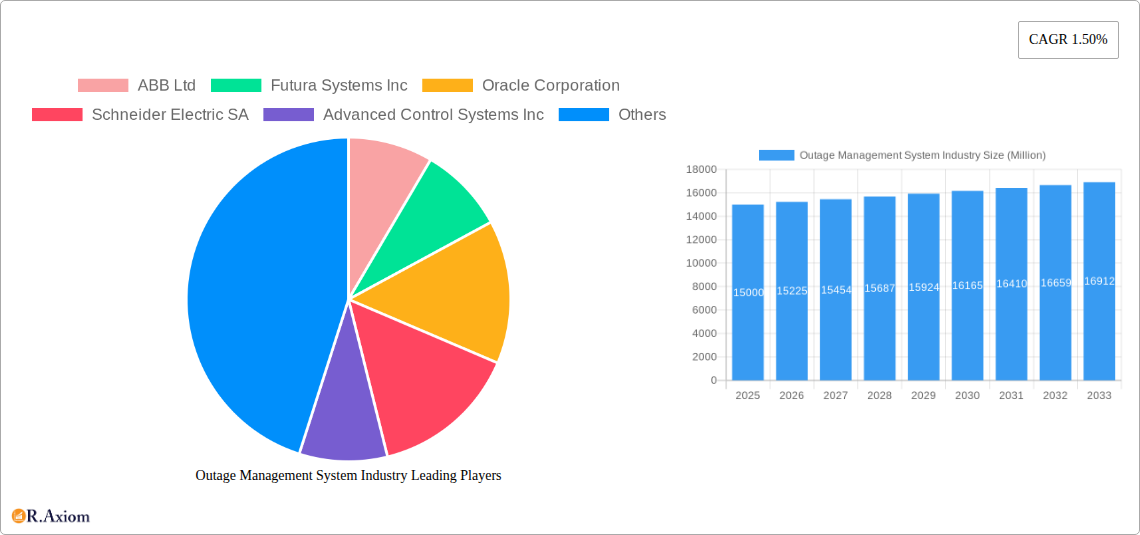
The Outage Management System (OMS) market is experiencing steady growth, driven by increasing demand for reliable power grids and the integration of smart grid technologies. The market's compound annual growth rate (CAGR) of 1.50% indicates a consistent expansion, albeit moderate, suggesting a mature but evolving market. Key drivers include the rising frequency and severity of power outages due to aging infrastructure and extreme weather events. Utilities, both public and private, are investing heavily in OMS solutions to improve grid resilience, reduce outage durations, and enhance customer satisfaction. The integration of advanced analytics, artificial intelligence (AI), and machine learning (ML) into OMS platforms is a significant trend, enabling predictive maintenance, faster fault detection, and optimized resource allocation. The market is segmented by end-user (public and private utilities) and system type (standalone and integrated). Integrated OMS solutions, offering comprehensive capabilities across the entire grid, are gaining traction due to their enhanced efficiency and streamlined operations. While the market faces restraints like high initial investment costs and the complexity of integrating new systems into existing infrastructure, the long-term benefits of improved grid reliability and operational efficiency outweigh these challenges. Leading players such as ABB, Schneider Electric, and Oracle are actively shaping the market through innovation and strategic partnerships. The North American market currently holds a significant share, driven by robust infrastructure investments and stringent regulatory standards. However, the Asia-Pacific region is projected to experience significant growth in the coming years, fueled by rapid urbanization and increasing energy demands.
The forecast period of 2025-2033 presents considerable opportunities for OMS providers. Continued investment in smart grid modernization initiatives globally will propel market growth. The focus on improving grid resilience in the face of climate change impacts will further stimulate demand. The market will likely see continued consolidation, with larger players acquiring smaller companies to expand their offerings and geographical reach. The expansion into emerging markets, alongside the development of more sophisticated and integrated solutions, will be key to future growth. This necessitates a strategic approach focusing on technological advancements, robust customer support, and a clear understanding of regional regulatory landscapes.
Outage Management System (OMS) Industry Market Report: 2019-2033
This comprehensive report provides an in-depth analysis of the Outage Management System (OMS) industry, offering valuable insights into market dynamics, growth drivers, and future trends. Covering the period from 2019 to 2033, with a focus on 2025, this report is essential for industry stakeholders, investors, and strategic decision-makers seeking a clear understanding of this evolving landscape. The report analyzes key players, including ABB Ltd, Futura Systems Inc, Oracle Corporation, Schneider Electric SA, Advanced Control Systems Inc, CGI Inc, General Electric Company, and Siemens AG, across various segments and geographical regions.
Outage Management System Industry Market Concentration & Innovation
The OMS market exhibits a moderately concentrated structure, with a few major players holding significant market share. ABB Ltd, Schneider Electric SA, and Siemens AG are among the leading companies, collectively accounting for an estimated xx% of the global market in 2025. However, the market is also witnessing increased competition from smaller, specialized vendors offering niche solutions. Innovation is a key driver, fueled by the growing adoption of advanced technologies such as AI, machine learning, and IoT. Regulatory frameworks, particularly those focused on grid modernization and reliability, significantly influence market growth. The increasing frequency and severity of power outages drive demand for robust OMS solutions. Product substitution is limited, with the core functionality of OMS remaining largely consistent. However, competition is centered on advanced features, integration capabilities, and cost-effectiveness. Mergers and acquisitions (M&A) activity has been moderate, with deal values totaling approximately $xx Million in the historical period (2019-2024), reflecting strategic efforts by established players to expand their market reach and technological capabilities.
- Market Share (2025): ABB Ltd (xx%), Schneider Electric SA (xx%), Siemens AG (xx%), Others (xx%)
- M&A Deal Value (2019-2024): $xx Million
- Innovation Drivers: AI, Machine Learning, IoT integration, Enhanced Data Analytics
Outage Management System Industry Industry Trends & Insights
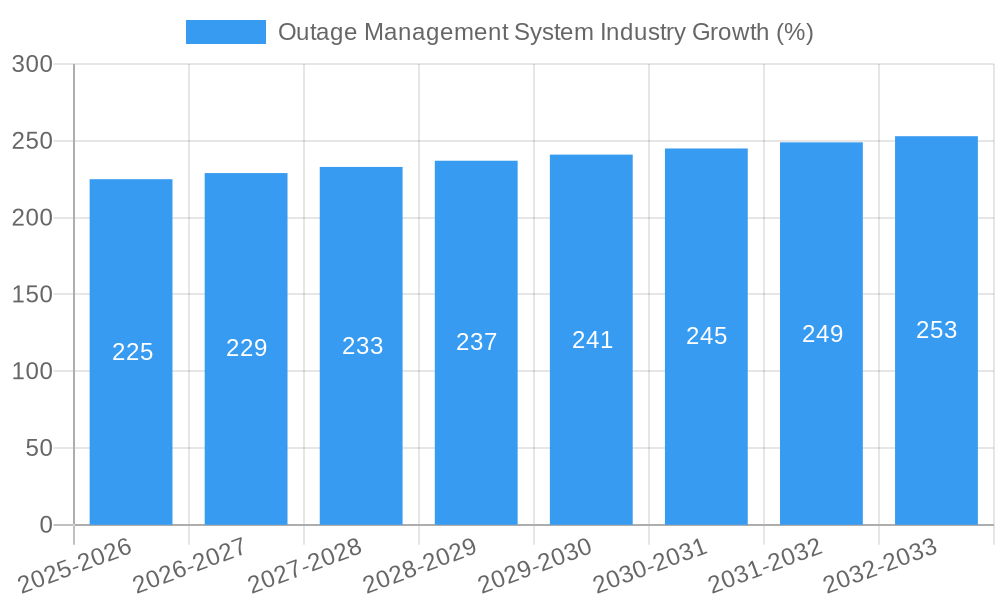
The OMS market is experiencing robust growth, driven by the increasing need for reliable and efficient power grids. The Compound Annual Growth Rate (CAGR) is projected to be xx% during the forecast period (2025-2033). This growth is fueled by several factors, including increasing urbanization, rising energy consumption, and the growing adoption of renewable energy sources. Technological disruptions, such as the widespread adoption of smart grids and advanced metering infrastructure (AMI), are transforming the OMS landscape, creating opportunities for innovative solutions. Consumer preferences are shifting towards more sophisticated and integrated systems that offer enhanced situational awareness, predictive capabilities, and improved response times. The competitive dynamics are characterized by a blend of established players and emerging technology providers vying for market share. Market penetration is increasing rapidly in developing economies, driven by the need for improved grid infrastructure.
Dominant Markets & Segments in Outage Management System Industry
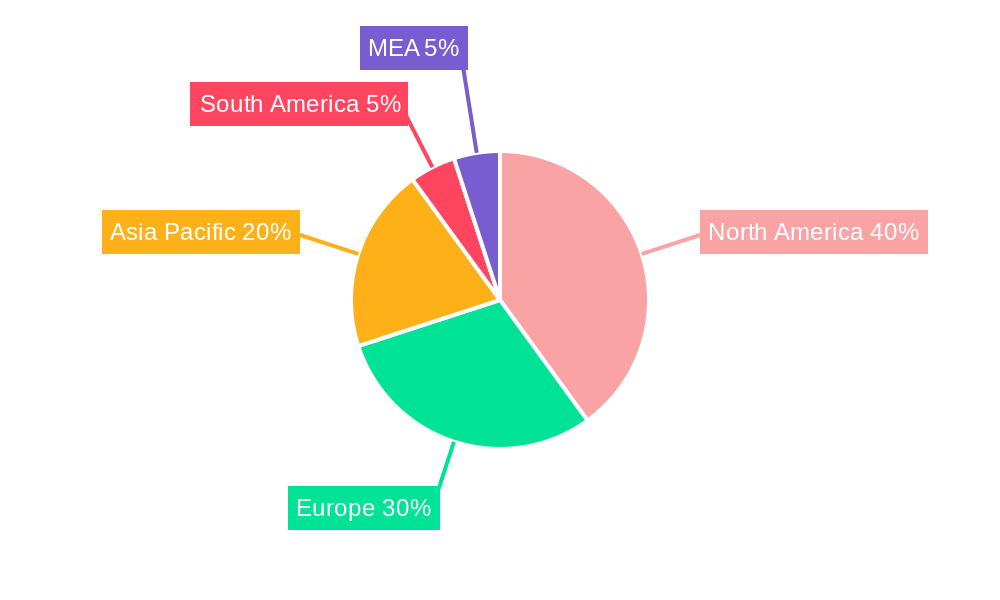
The North American region holds a dominant position in the OMS market, followed by Europe and Asia-Pacific. Within the end-user segments, public utilities account for a larger share than private utilities due to the critical role of reliable power supply for public services. The integrated OMS segment is showing faster growth compared to standalone systems due to the advantages of holistic grid management and improved interoperability.
- Key Drivers for North American Dominance:
- Advanced grid infrastructure development.
- Stringent regulatory frameworks emphasizing grid reliability.
- High adoption of smart grid technologies.
- Key Drivers for Public Utility Segment Dominance:
- Critical role of reliable power supply for public services.
- Higher investment capacity compared to private utilities.
- Key Drivers for Integrated OMS Segment Dominance:
- Enhanced grid visibility and control.
- Improved operational efficiency and cost savings.
- Synergistic integration with other smart grid technologies.
Outage Management System Industry Product Developments
Recent product innovations in the OMS sector focus on enhancing data analytics capabilities, improving predictive modeling accuracy, and integrating advanced technologies such as AI and machine learning. This allows for proactive outage prevention, faster restoration times, and optimized resource allocation. The integration of these advanced technologies enhances the overall efficiency and effectiveness of OMS solutions, providing utilities with a significant competitive advantage in managing their grid operations. New applications are emerging in areas such as microgrid management and distributed generation integration, addressing the evolving needs of a more decentralized and complex power system.
Report Scope & Segmentation Analysis
This report segments the OMS market based on end-user (public utility, private utility) and type (standalone, integrated). The public utility segment is projected to experience significant growth due to its critical reliance on reliable power infrastructure. The private utility segment is also expected to grow but at a slower pace. The integrated OMS segment is anticipated to witness higher growth due to its enhanced capabilities and benefits. Competitive dynamics differ across segments, with specialized vendors catering to specific needs within each segment.
- Public Utility Segment: xx Million, CAGR xx%
- Private Utility Segment: xx Million, CAGR xx%
- Standalone OMS Segment: xx Million, CAGR xx%
- Integrated OMS Segment: xx Million, CAGR xx%
Key Drivers of Outage Management System Industry Growth
Several factors contribute to the growth of the OMS market. Technological advancements, particularly in AI, machine learning, and IoT, enable more sophisticated outage detection, prediction, and restoration. The increasing focus on grid modernization and reliability, driven by regulatory mandates and consumer demand, fuels investments in advanced OMS solutions. Economic factors, such as rising energy consumption and urbanization, create a greater need for efficient grid management.
Challenges in the Outage Management System Industry Sector
Despite the significant growth potential, the OMS industry faces challenges. High initial investment costs can deter smaller utilities from adopting advanced OMS solutions. The complexity of integrating OMS with existing grid infrastructure presents technical hurdles. Intense competition among established players and new entrants creates pressure on pricing and margins. Furthermore, cybersecurity risks associated with interconnected systems pose a significant threat. These factors collectively impact market penetration and overall growth.
Emerging Opportunities in Outage Management System Industry
Significant opportunities exist for growth in emerging markets with developing grid infrastructure. The increasing integration of renewable energy sources presents opportunities for OMS solutions tailored to manage the intermittent nature of renewable energy. The development of more user-friendly and intuitive OMS interfaces can enhance market adoption. Advancements in predictive analytics and AI can further improve outage prediction accuracy and reduce downtime.
Leading Players in the Outage Management System Industry Market
- ABB Ltd
- Futura Systems Inc
- Oracle Corporation
- Schneider Electric SA
- Advanced Control Systems Inc
- CGI Inc
- General Electric Company
- Siemens AG
Key Developments in Outage Management System Industry Industry
- 2022 Q4: Schneider Electric launched its enhanced OMS platform with AI-powered predictive analytics.
- 2023 Q1: Siemens AG announced a strategic partnership with a leading telecommunications company to integrate advanced communication technologies into its OMS solutions.
Strategic Outlook for Outage Management System Industry Market
The OMS market is poised for continued growth, driven by technological advancements, regulatory pressures, and the increasing need for reliable power grids. Opportunities exist in the development of advanced analytics capabilities, improved cybersecurity measures, and the integration of OMS with other smart grid technologies. The market will likely see further consolidation through M&A activity as companies seek to expand their offerings and gain a competitive edge. The focus on proactive outage management and improved grid resilience will continue to shape the future of the OMS industry.
Outage Management System Industry Segmentation
-
1. Type
- 1.1. Standalone
- 1.2. Integrated
-
2. End-User
- 2.1. Public Utility
- 2.2. Private Utility
Outage Management System Industry Segmentation By Geography
- 1. North America
- 2. South America
- 3. Europe
- 4. Asia Pacific
- 5. Middle East and Africa
Outage Management System Industry REPORT HIGHLIGHTS
| Aspects | Details |
|---|---|
| Study Period | 2019-2033 |
| Base Year | 2024 |
| Estimated Year | 2025 |
| Forecast Period | 2025-2033 |
| Historical Period | 2019-2024 |
| Growth Rate | CAGR of 1.50% from 2019-2033 |
| Segmentation |
|
Table of Contents
- 1. Introduction
- 1.1. Research Scope
- 1.2. Market Segmentation
- 1.3. Research Methodology
- 1.4. Definitions and Assumptions
- 2. Executive Summary
- 2.1. Introduction
- 3. Market Dynamics
- 3.1. Introduction
- 3.2. Market Drivers
- 3.2.1 The integration of OMS with Supervisory Control and Data Acquisition (SCADA) systems has enhanced operational efficiency. This integration facilitates comprehensive automation of outage management processes
- 3.2.2 leading to faster restoration times and improved resource allocation
- 3.3. Market Restrains
- 3.3.1 Implementing OMS solutions involves navigating complex infrastructure requirements and managing large volumes of data. These challenges can impede the seamless deployment and operation of OMS
- 3.3.2 particularly in regions with limited technological infrastructure
- 3.4. Market Trends
- 3.4.1 There is a growing preference for integrated OMS solutions that combine outage management with other utility operations
- 3.4.2 such as asset management and customer information systems. This trend aims to streamline operations and provide a more holistic approach to utility management
- 4. Market Factor Analysis
- 4.1. Porters Five Forces
- 4.2. Supply/Value Chain
- 4.3. PESTEL analysis
- 4.4. Market Entropy
- 4.5. Patent/Trademark Analysis
- 5. Global Outage Management System Industry Analysis, Insights and Forecast, 2019-2031
- 5.1. Market Analysis, Insights and Forecast - by Type
- 5.1.1. Standalone
- 5.1.2. Integrated
- 5.2. Market Analysis, Insights and Forecast - by End-User
- 5.2.1. Public Utility
- 5.2.2. Private Utility
- 5.3. Market Analysis, Insights and Forecast - by Region
- 5.3.1. North America
- 5.3.2. South America
- 5.3.3. Europe
- 5.3.4. Asia Pacific
- 5.3.5. Middle East and Africa
- 5.1. Market Analysis, Insights and Forecast - by Type
- 6. North America Outage Management System Industry Analysis, Insights and Forecast, 2019-2031
- 6.1. Market Analysis, Insights and Forecast - by Type
- 6.1.1. Standalone
- 6.1.2. Integrated
- 6.2. Market Analysis, Insights and Forecast - by End-User
- 6.2.1. Public Utility
- 6.2.2. Private Utility
- 6.1. Market Analysis, Insights and Forecast - by Type
- 7. South America Outage Management System Industry Analysis, Insights and Forecast, 2019-2031
- 7.1. Market Analysis, Insights and Forecast - by Type
- 7.1.1. Standalone
- 7.1.2. Integrated
- 7.2. Market Analysis, Insights and Forecast - by End-User
- 7.2.1. Public Utility
- 7.2.2. Private Utility
- 7.1. Market Analysis, Insights and Forecast - by Type
- 8. Europe Outage Management System Industry Analysis, Insights and Forecast, 2019-2031
- 8.1. Market Analysis, Insights and Forecast - by Type
- 8.1.1. Standalone
- 8.1.2. Integrated
- 8.2. Market Analysis, Insights and Forecast - by End-User
- 8.2.1. Public Utility
- 8.2.2. Private Utility
- 8.1. Market Analysis, Insights and Forecast - by Type
- 9. Asia Pacific Outage Management System Industry Analysis, Insights and Forecast, 2019-2031
- 9.1. Market Analysis, Insights and Forecast - by Type
- 9.1.1. Standalone
- 9.1.2. Integrated
- 9.2. Market Analysis, Insights and Forecast - by End-User
- 9.2.1. Public Utility
- 9.2.2. Private Utility
- 9.1. Market Analysis, Insights and Forecast - by Type
- 10. Middle East and Africa Outage Management System Industry Analysis, Insights and Forecast, 2019-2031
- 10.1. Market Analysis, Insights and Forecast - by Type
- 10.1.1. Standalone
- 10.1.2. Integrated
- 10.2. Market Analysis, Insights and Forecast - by End-User
- 10.2.1. Public Utility
- 10.2.2. Private Utility
- 10.1. Market Analysis, Insights and Forecast - by Type
- 11. North America Outage Management System Industry Analysis, Insights and Forecast, 2019-2031
- 11.1. Market Analysis, Insights and Forecast - By Country/Sub-region
- 11.1.1 United States
- 11.1.2 Canada
- 11.1.3 Mexico
- 12. Europe Outage Management System Industry Analysis, Insights and Forecast, 2019-2031
- 12.1. Market Analysis, Insights and Forecast - By Country/Sub-region
- 12.1.1 Germany
- 12.1.2 United Kingdom
- 12.1.3 France
- 12.1.4 Spain
- 12.1.5 Italy
- 12.1.6 Spain
- 12.1.7 Belgium
- 12.1.8 Netherland
- 12.1.9 Nordics
- 12.1.10 Rest of Europe
- 13. Asia Pacific Outage Management System Industry Analysis, Insights and Forecast, 2019-2031
- 13.1. Market Analysis, Insights and Forecast - By Country/Sub-region
- 13.1.1 China
- 13.1.2 Japan
- 13.1.3 India
- 13.1.4 South Korea
- 13.1.5 Southeast Asia
- 13.1.6 Australia
- 13.1.7 Indonesia
- 13.1.8 Phillipes
- 13.1.9 Singapore
- 13.1.10 Thailandc
- 13.1.11 Rest of Asia Pacific
- 14. South America Outage Management System Industry Analysis, Insights and Forecast, 2019-2031
- 14.1. Market Analysis, Insights and Forecast - By Country/Sub-region
- 14.1.1 Brazil
- 14.1.2 Argentina
- 14.1.3 Peru
- 14.1.4 Chile
- 14.1.5 Colombia
- 14.1.6 Ecuador
- 14.1.7 Venezuela
- 14.1.8 Rest of South America
- 15. North America Outage Management System Industry Analysis, Insights and Forecast, 2019-2031
- 15.1. Market Analysis, Insights and Forecast - By Country/Sub-region
- 15.1.1 United States
- 15.1.2 Canada
- 15.1.3 Mexico
- 16. MEA Outage Management System Industry Analysis, Insights and Forecast, 2019-2031
- 16.1. Market Analysis, Insights and Forecast - By Country/Sub-region
- 16.1.1 United Arab Emirates
- 16.1.2 Saudi Arabia
- 16.1.3 South Africa
- 16.1.4 Rest of Middle East and Africa
- 17. Competitive Analysis
- 17.1. Global Market Share Analysis 2024
- 17.2. Company Profiles
- 17.2.1 ABB Ltd
- 17.2.1.1. Overview
- 17.2.1.2. Products
- 17.2.1.3. SWOT Analysis
- 17.2.1.4. Recent Developments
- 17.2.1.5. Financials (Based on Availability)
- 17.2.2 Futura Systems Inc
- 17.2.2.1. Overview
- 17.2.2.2. Products
- 17.2.2.3. SWOT Analysis
- 17.2.2.4. Recent Developments
- 17.2.2.5. Financials (Based on Availability)
- 17.2.3 Oracle Corporation
- 17.2.3.1. Overview
- 17.2.3.2. Products
- 17.2.3.3. SWOT Analysis
- 17.2.3.4. Recent Developments
- 17.2.3.5. Financials (Based on Availability)
- 17.2.4 Schneider Electric SA
- 17.2.4.1. Overview
- 17.2.4.2. Products
- 17.2.4.3. SWOT Analysis
- 17.2.4.4. Recent Developments
- 17.2.4.5. Financials (Based on Availability)
- 17.2.5 Advanced Control Systems Inc
- 17.2.5.1. Overview
- 17.2.5.2. Products
- 17.2.5.3. SWOT Analysis
- 17.2.5.4. Recent Developments
- 17.2.5.5. Financials (Based on Availability)
- 17.2.6 CGI Inc
- 17.2.6.1. Overview
- 17.2.6.2. Products
- 17.2.6.3. SWOT Analysis
- 17.2.6.4. Recent Developments
- 17.2.6.5. Financials (Based on Availability)
- 17.2.7 General Electric Company
- 17.2.7.1. Overview
- 17.2.7.2. Products
- 17.2.7.3. SWOT Analysis
- 17.2.7.4. Recent Developments
- 17.2.7.5. Financials (Based on Availability)
- 17.2.8 Siemens AG
- 17.2.8.1. Overview
- 17.2.8.2. Products
- 17.2.8.3. SWOT Analysis
- 17.2.8.4. Recent Developments
- 17.2.8.5. Financials (Based on Availability)
- 17.2.1 ABB Ltd
List of Figures
- Figure 1: Global Outage Management System Industry Revenue Breakdown (Million, %) by Region 2024 & 2032
- Figure 2: North America Outage Management System Industry Revenue (Million), by Country 2024 & 2032
- Figure 3: North America Outage Management System Industry Revenue Share (%), by Country 2024 & 2032
- Figure 4: Europe Outage Management System Industry Revenue (Million), by Country 2024 & 2032
- Figure 5: Europe Outage Management System Industry Revenue Share (%), by Country 2024 & 2032
- Figure 6: Asia Pacific Outage Management System Industry Revenue (Million), by Country 2024 & 2032
- Figure 7: Asia Pacific Outage Management System Industry Revenue Share (%), by Country 2024 & 2032
- Figure 8: South America Outage Management System Industry Revenue (Million), by Country 2024 & 2032
- Figure 9: South America Outage Management System Industry Revenue Share (%), by Country 2024 & 2032
- Figure 10: North America Outage Management System Industry Revenue (Million), by Country 2024 & 2032
- Figure 11: North America Outage Management System Industry Revenue Share (%), by Country 2024 & 2032
- Figure 12: MEA Outage Management System Industry Revenue (Million), by Country 2024 & 2032
- Figure 13: MEA Outage Management System Industry Revenue Share (%), by Country 2024 & 2032
- Figure 14: North America Outage Management System Industry Revenue (Million), by Type 2024 & 2032
- Figure 15: North America Outage Management System Industry Revenue Share (%), by Type 2024 & 2032
- Figure 16: North America Outage Management System Industry Revenue (Million), by End-User 2024 & 2032
- Figure 17: North America Outage Management System Industry Revenue Share (%), by End-User 2024 & 2032
- Figure 18: North America Outage Management System Industry Revenue (Million), by Country 2024 & 2032
- Figure 19: North America Outage Management System Industry Revenue Share (%), by Country 2024 & 2032
- Figure 20: South America Outage Management System Industry Revenue (Million), by Type 2024 & 2032
- Figure 21: South America Outage Management System Industry Revenue Share (%), by Type 2024 & 2032
- Figure 22: South America Outage Management System Industry Revenue (Million), by End-User 2024 & 2032
- Figure 23: South America Outage Management System Industry Revenue Share (%), by End-User 2024 & 2032
- Figure 24: South America Outage Management System Industry Revenue (Million), by Country 2024 & 2032
- Figure 25: South America Outage Management System Industry Revenue Share (%), by Country 2024 & 2032
- Figure 26: Europe Outage Management System Industry Revenue (Million), by Type 2024 & 2032
- Figure 27: Europe Outage Management System Industry Revenue Share (%), by Type 2024 & 2032
- Figure 28: Europe Outage Management System Industry Revenue (Million), by End-User 2024 & 2032
- Figure 29: Europe Outage Management System Industry Revenue Share (%), by End-User 2024 & 2032
- Figure 30: Europe Outage Management System Industry Revenue (Million), by Country 2024 & 2032
- Figure 31: Europe Outage Management System Industry Revenue Share (%), by Country 2024 & 2032
- Figure 32: Asia Pacific Outage Management System Industry Revenue (Million), by Type 2024 & 2032
- Figure 33: Asia Pacific Outage Management System Industry Revenue Share (%), by Type 2024 & 2032
- Figure 34: Asia Pacific Outage Management System Industry Revenue (Million), by End-User 2024 & 2032
- Figure 35: Asia Pacific Outage Management System Industry Revenue Share (%), by End-User 2024 & 2032
- Figure 36: Asia Pacific Outage Management System Industry Revenue (Million), by Country 2024 & 2032
- Figure 37: Asia Pacific Outage Management System Industry Revenue Share (%), by Country 2024 & 2032
- Figure 38: Middle East and Africa Outage Management System Industry Revenue (Million), by Type 2024 & 2032
- Figure 39: Middle East and Africa Outage Management System Industry Revenue Share (%), by Type 2024 & 2032
- Figure 40: Middle East and Africa Outage Management System Industry Revenue (Million), by End-User 2024 & 2032
- Figure 41: Middle East and Africa Outage Management System Industry Revenue Share (%), by End-User 2024 & 2032
- Figure 42: Middle East and Africa Outage Management System Industry Revenue (Million), by Country 2024 & 2032
- Figure 43: Middle East and Africa Outage Management System Industry Revenue Share (%), by Country 2024 & 2032
List of Tables
- Table 1: Global Outage Management System Industry Revenue Million Forecast, by Region 2019 & 2032
- Table 2: Global Outage Management System Industry Revenue Million Forecast, by Type 2019 & 2032
- Table 3: Global Outage Management System Industry Revenue Million Forecast, by End-User 2019 & 2032
- Table 4: Global Outage Management System Industry Revenue Million Forecast, by Region 2019 & 2032
- Table 5: Global Outage Management System Industry Revenue Million Forecast, by Country 2019 & 2032
- Table 6: United States Outage Management System Industry Revenue (Million) Forecast, by Application 2019 & 2032
- Table 7: Canada Outage Management System Industry Revenue (Million) Forecast, by Application 2019 & 2032
- Table 8: Mexico Outage Management System Industry Revenue (Million) Forecast, by Application 2019 & 2032
- Table 9: Global Outage Management System Industry Revenue Million Forecast, by Country 2019 & 2032
- Table 10: Germany Outage Management System Industry Revenue (Million) Forecast, by Application 2019 & 2032
- Table 11: United Kingdom Outage Management System Industry Revenue (Million) Forecast, by Application 2019 & 2032
- Table 12: France Outage Management System Industry Revenue (Million) Forecast, by Application 2019 & 2032
- Table 13: Spain Outage Management System Industry Revenue (Million) Forecast, by Application 2019 & 2032
- Table 14: Italy Outage Management System Industry Revenue (Million) Forecast, by Application 2019 & 2032
- Table 15: Spain Outage Management System Industry Revenue (Million) Forecast, by Application 2019 & 2032
- Table 16: Belgium Outage Management System Industry Revenue (Million) Forecast, by Application 2019 & 2032
- Table 17: Netherland Outage Management System Industry Revenue (Million) Forecast, by Application 2019 & 2032
- Table 18: Nordics Outage Management System Industry Revenue (Million) Forecast, by Application 2019 & 2032
- Table 19: Rest of Europe Outage Management System Industry Revenue (Million) Forecast, by Application 2019 & 2032
- Table 20: Global Outage Management System Industry Revenue Million Forecast, by Country 2019 & 2032
- Table 21: China Outage Management System Industry Revenue (Million) Forecast, by Application 2019 & 2032
- Table 22: Japan Outage Management System Industry Revenue (Million) Forecast, by Application 2019 & 2032
- Table 23: India Outage Management System Industry Revenue (Million) Forecast, by Application 2019 & 2032
- Table 24: South Korea Outage Management System Industry Revenue (Million) Forecast, by Application 2019 & 2032
- Table 25: Southeast Asia Outage Management System Industry Revenue (Million) Forecast, by Application 2019 & 2032
- Table 26: Australia Outage Management System Industry Revenue (Million) Forecast, by Application 2019 & 2032
- Table 27: Indonesia Outage Management System Industry Revenue (Million) Forecast, by Application 2019 & 2032
- Table 28: Phillipes Outage Management System Industry Revenue (Million) Forecast, by Application 2019 & 2032
- Table 29: Singapore Outage Management System Industry Revenue (Million) Forecast, by Application 2019 & 2032
- Table 30: Thailandc Outage Management System Industry Revenue (Million) Forecast, by Application 2019 & 2032
- Table 31: Rest of Asia Pacific Outage Management System Industry Revenue (Million) Forecast, by Application 2019 & 2032
- Table 32: Global Outage Management System Industry Revenue Million Forecast, by Country 2019 & 2032
- Table 33: Brazil Outage Management System Industry Revenue (Million) Forecast, by Application 2019 & 2032
- Table 34: Argentina Outage Management System Industry Revenue (Million) Forecast, by Application 2019 & 2032
- Table 35: Peru Outage Management System Industry Revenue (Million) Forecast, by Application 2019 & 2032
- Table 36: Chile Outage Management System Industry Revenue (Million) Forecast, by Application 2019 & 2032
- Table 37: Colombia Outage Management System Industry Revenue (Million) Forecast, by Application 2019 & 2032
- Table 38: Ecuador Outage Management System Industry Revenue (Million) Forecast, by Application 2019 & 2032
- Table 39: Venezuela Outage Management System Industry Revenue (Million) Forecast, by Application 2019 & 2032
- Table 40: Rest of South America Outage Management System Industry Revenue (Million) Forecast, by Application 2019 & 2032
- Table 41: Global Outage Management System Industry Revenue Million Forecast, by Country 2019 & 2032
- Table 42: United States Outage Management System Industry Revenue (Million) Forecast, by Application 2019 & 2032
- Table 43: Canada Outage Management System Industry Revenue (Million) Forecast, by Application 2019 & 2032
- Table 44: Mexico Outage Management System Industry Revenue (Million) Forecast, by Application 2019 & 2032
- Table 45: Global Outage Management System Industry Revenue Million Forecast, by Country 2019 & 2032
- Table 46: United Arab Emirates Outage Management System Industry Revenue (Million) Forecast, by Application 2019 & 2032
- Table 47: Saudi Arabia Outage Management System Industry Revenue (Million) Forecast, by Application 2019 & 2032
- Table 48: South Africa Outage Management System Industry Revenue (Million) Forecast, by Application 2019 & 2032
- Table 49: Rest of Middle East and Africa Outage Management System Industry Revenue (Million) Forecast, by Application 2019 & 2032
- Table 50: Global Outage Management System Industry Revenue Million Forecast, by Type 2019 & 2032
- Table 51: Global Outage Management System Industry Revenue Million Forecast, by End-User 2019 & 2032
- Table 52: Global Outage Management System Industry Revenue Million Forecast, by Country 2019 & 2032
- Table 53: Global Outage Management System Industry Revenue Million Forecast, by Type 2019 & 2032
- Table 54: Global Outage Management System Industry Revenue Million Forecast, by End-User 2019 & 2032
- Table 55: Global Outage Management System Industry Revenue Million Forecast, by Country 2019 & 2032
- Table 56: Global Outage Management System Industry Revenue Million Forecast, by Type 2019 & 2032
- Table 57: Global Outage Management System Industry Revenue Million Forecast, by End-User 2019 & 2032
- Table 58: Global Outage Management System Industry Revenue Million Forecast, by Country 2019 & 2032
- Table 59: Global Outage Management System Industry Revenue Million Forecast, by Type 2019 & 2032
- Table 60: Global Outage Management System Industry Revenue Million Forecast, by End-User 2019 & 2032
- Table 61: Global Outage Management System Industry Revenue Million Forecast, by Country 2019 & 2032
- Table 62: Global Outage Management System Industry Revenue Million Forecast, by Type 2019 & 2032
- Table 63: Global Outage Management System Industry Revenue Million Forecast, by End-User 2019 & 2032
- Table 64: Global Outage Management System Industry Revenue Million Forecast, by Country 2019 & 2032
Frequently Asked Questions
1. What is the projected Compound Annual Growth Rate (CAGR) of the Outage Management System Industry?
The projected CAGR is approximately 1.50%.
2. Which companies are prominent players in the Outage Management System Industry?
Key companies in the market include ABB Ltd, Futura Systems Inc, Oracle Corporation, Schneider Electric SA, Advanced Control Systems Inc, CGI Inc, General Electric Company, Siemens AG.
3. What are the main segments of the Outage Management System Industry?
The market segments include Type, End-User.
4. Can you provide details about the market size?
The market size is estimated to be USD XX Million as of 2022.
5. What are some drivers contributing to market growth?
The integration of OMS with Supervisory Control and Data Acquisition (SCADA) systems has enhanced operational efficiency. This integration facilitates comprehensive automation of outage management processes. leading to faster restoration times and improved resource allocation.
6. What are the notable trends driving market growth?
There is a growing preference for integrated OMS solutions that combine outage management with other utility operations. such as asset management and customer information systems. This trend aims to streamline operations and provide a more holistic approach to utility management.
7. Are there any restraints impacting market growth?
Implementing OMS solutions involves navigating complex infrastructure requirements and managing large volumes of data. These challenges can impede the seamless deployment and operation of OMS. particularly in regions with limited technological infrastructure.
8. Can you provide examples of recent developments in the market?
Schneider Electric SE and Siemens AG have also been active in the OMS sector, pursuing similar strategies to enhance their offerings and market reach. Their efforts include integrating advanced technologies into their OMS solutions and forming strategic alliances to better serve the utility industry.
9. What pricing options are available for accessing the report?
Pricing options include single-user, multi-user, and enterprise licenses priced at USD 4750, USD 5250, and USD 8750 respectively.
10. Is the market size provided in terms of value or volume?
The market size is provided in terms of value, measured in Million.
11. Are there any specific market keywords associated with the report?
Yes, the market keyword associated with the report is "Outage Management System Industry," which aids in identifying and referencing the specific market segment covered.
12. How do I determine which pricing option suits my needs best?
The pricing options vary based on user requirements and access needs. Individual users may opt for single-user licenses, while businesses requiring broader access may choose multi-user or enterprise licenses for cost-effective access to the report.
13. Are there any additional resources or data provided in the Outage Management System Industry report?
While the report offers comprehensive insights, it's advisable to review the specific contents or supplementary materials provided to ascertain if additional resources or data are available.
14. How can I stay updated on further developments or reports in the Outage Management System Industry?
To stay informed about further developments, trends, and reports in the Outage Management System Industry, consider subscribing to industry newsletters, following relevant companies and organizations, or regularly checking reputable industry news sources and publications.
Methodology
Step 1 - Identification of Relevant Samples Size from Population Database


Step 2 - Approaches for Defining Global Market Size (Value, Volume* & Price*)

Note*: In applicable scenarios
Step 3 - Data Sources
Primary Research
- Web Analytics
- Survey Reports
- Research Institute
- Latest Research Reports
- Opinion Leaders
Secondary Research
- Annual Reports
- White Paper
- Latest Press Release
- Industry Association
- Paid Database
- Investor Presentations

Step 4 - Data Triangulation
Involves using different sources of information in order to increase the validity of a study
These sources are likely to be stakeholders in a program - participants, other researchers, program staff, other community members, and so on.
Then we put all data in single framework & apply various statistical tools to find out the dynamic on the market.
During the analysis stage, feedback from the stakeholder groups would be compared to determine areas of agreement as well as areas of divergence


