
Key Insights
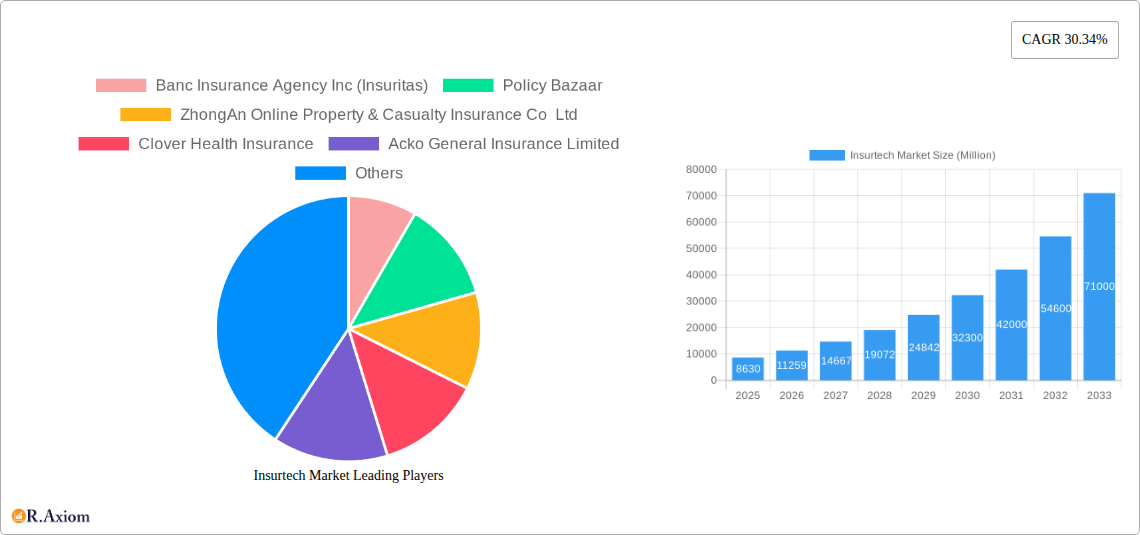
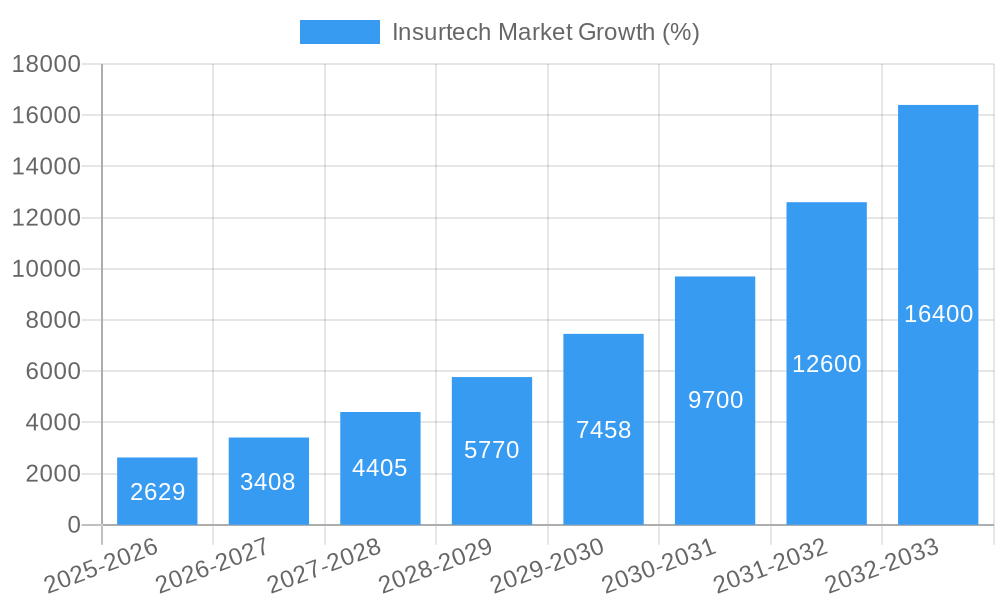
The Insurtech market, valued at $8.63 billion in 2025, is experiencing explosive growth, projected to expand at a Compound Annual Growth Rate (CAGR) of 30.34% from 2025 to 2033. This rapid expansion is fueled by several key drivers. Increasing consumer demand for digital-first experiences, coupled with the inherent efficiencies and cost-effectiveness of technology-driven insurance solutions, are reshaping the industry landscape. Furthermore, the integration of advanced analytics, artificial intelligence (AI), and machine learning (ML) enables more accurate risk assessment, personalized pricing, and fraud detection, leading to improved operational efficiency and enhanced customer satisfaction. The proliferation of mobile devices and the rise of Insurtech startups offering innovative products and services further accelerate market growth. While data privacy concerns and regulatory hurdles pose some challenges, the overall trajectory indicates sustained, robust growth.
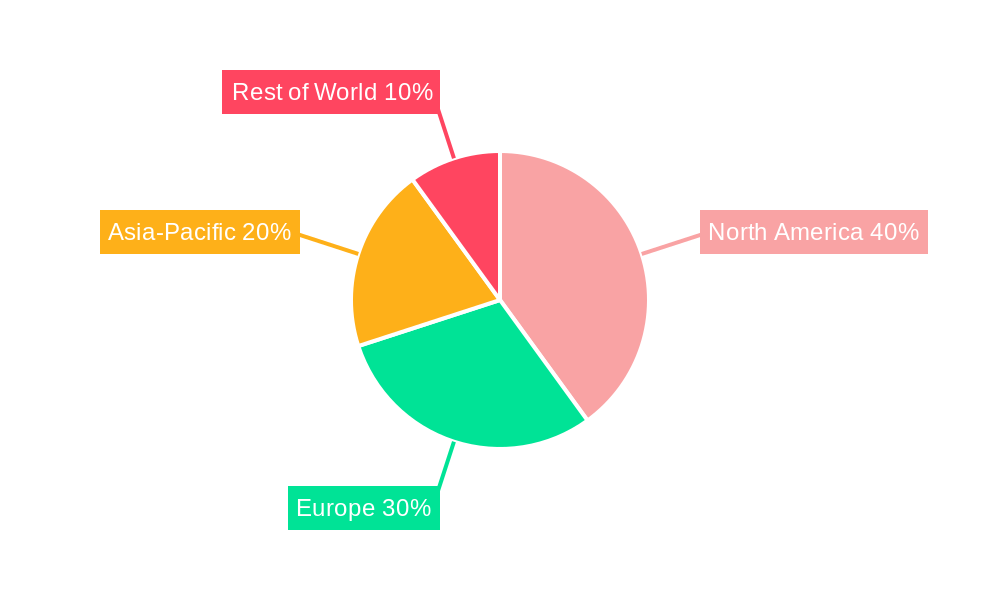
The market segmentation is dynamic, with various players catering to specific niches. Companies like Lemonade and Oscar Health focus on user-friendly digital platforms and personalized customer experiences. Others, such as Banc Insurance Agency and Policy Bazaar, leverage technology to streamline processes and expand distribution channels. The emergence of embedded insurance, integrating insurance products within other platforms and services, presents a significant growth opportunity. Regional variations exist, with North America and Europe currently leading the market, but significant growth potential lies in emerging markets with increasing internet penetration and expanding middle classes. The competitive landscape is characterized by a mix of established insurers embracing digital transformation and agile Insurtech startups disrupting traditional models, leading to a period of significant innovation and consolidation. This robust growth is expected to continue throughout the forecast period, driven by the ongoing convergence of technology and insurance.
Insurtech Market: A Comprehensive Report (2019-2033)
This in-depth report provides a comprehensive analysis of the Insurtech market, covering its evolution from 2019 to 2033, with a focus on key players, market segments, and future growth prospects. The report leverages extensive data analysis, market trends, and expert insights to offer actionable intelligence for industry stakeholders. The study period spans 2019–2033, with 2025 serving as the base and estimated year, and the forecast period extending from 2025–2033. The historical period covered is 2019–2024.
Insurtech Market Concentration & Innovation
This section analyzes the Insurtech market's competitive landscape, focusing on market concentration, innovation drivers, regulatory changes, substitute products, end-user trends, and merger & acquisition (M&A) activity. The market exhibits a moderately concentrated structure with several major players controlling significant shares. However, the presence of numerous startups and innovative companies signifies considerable dynamism.
- Market Share: The top five players account for approximately xx% of the global market share in 2025, with Banc Insurance Agency Inc (Insuritas) holding an estimated xx% market share. The remaining market share is distributed amongst numerous smaller players and emerging companies.
- Innovation Drivers: Technological advancements such as AI, machine learning, and big data analytics are driving innovation, leading to personalized insurance products and efficient claims processing. Open APIs and cloud-based solutions further enhance agility and scalability.
- Regulatory Frameworks: Varying regulatory landscapes across different countries significantly impact market growth. Stringent regulations in some regions may hinder market expansion, while supportive regulations in others foster innovation.
- Product Substitutes: Traditional insurance models represent the main substitute; however, the Insurtech market differentiates through enhanced customer experience, lower costs, and data-driven personalization.
- End-User Trends: Growing consumer demand for digital-first solutions, personalized products, and seamless claims experiences fuels Insurtech adoption. Increased reliance on mobile devices and online platforms also contributes to this trend.
- M&A Activities: The Insurtech sector has witnessed significant M&A activity, with deal values exceeding xx Million in 2024. These acquisitions consolidate market share, enhance technological capabilities, and expand product portfolios. For instance, the partnership between CNB Bank & Trust (CIBC) and Insuritas in March 2024 showcases strategic M&A activity.
Insurtech Market Industry Trends & Insights
This section delves into the key trends shaping the Insurtech market. The market is experiencing robust growth driven by increasing digitalization, shifting consumer preferences, and technological advancements. The market is projected to grow at a CAGR of xx% during the forecast period (2025-2033), reaching a market size of xx Million by 2033. Market penetration is projected to increase from xx% in 2025 to xx% in 2033.
Technological disruptions, particularly in areas like AI and blockchain, are revolutionizing underwriting, claims processing, and fraud detection. Consumers increasingly prefer convenient, personalized, and transparent insurance solutions, creating significant opportunities for Insurtech companies that can deliver on these expectations. Competitive dynamics remain intense, with established players and agile startups vying for market share. This competition fosters innovation and accelerates the adoption of advanced technologies. The rise of embedded insurance, where insurance is integrated into other products and services, presents a considerable growth opportunity.
Dominant Markets & Segments in Insurtech Market
North America currently dominates the Insurtech market, driven by high technological adoption, established financial infrastructure, and supportive regulatory frameworks.
- Key Drivers in North America:
- High levels of smartphone penetration and internet access.
- Strong venture capital funding and a robust startup ecosystem.
- Relatively mature and competitive insurance market encouraging innovation.
- Progressive regulatory environment supportive of Insurtech developments.
The dominance of North America is expected to persist throughout the forecast period, although Asia-Pacific is projected to witness significant growth due to rising smartphone penetration, growing middle class, and increasing awareness of insurance products. Further detailed analysis of regional and segmental performances is included in the full report.
Insurtech Market Product Developments
Recent product innovations within the Insurtech space focus heavily on leveraging AI and machine learning for risk assessment, claims automation, and personalized pricing. The integration of IoT devices allows for real-time risk monitoring, leading to more accurate risk assessment and personalized premiums. These advancements provide significant competitive advantages by improving efficiency, reducing costs, and enhancing customer experiences. The market is witnessing a shift towards modular and API-driven platforms, enabling greater flexibility and integration within existing ecosystems.
Report Scope & Segmentation Analysis
This report segments the Insurtech market based on various factors, including product type (e.g., Life, Health, Property & Casualty), technology used (e.g., AI, Blockchain), deployment mode (e.g., Cloud, On-premise), and geography. Each segment is analyzed in detail, providing market size, growth projections, and competitive dynamics. For example, the P&C segment is experiencing rapid growth due to its suitability for automation and data analytics. Similarly, AI adoption is accelerating across segments owing to its ability to personalize offerings and improve efficiency. Specific growth projections for each segment are included within the full report.
Key Drivers of Insurtech Market Growth
Several key factors drive the growth of the Insurtech market. Technological advancements, such as AI and machine learning, are transforming insurance operations, leading to increased efficiency and improved customer experiences. Favourable regulatory environments in many countries encourage innovation and market expansion. Moreover, the growing demand for digital solutions and personalized insurance products fuels market growth. The increasing penetration of smartphones and internet access further supports the adoption of Insurtech solutions globally.
Challenges in the Insurtech Market Sector
The Insurtech market faces several challenges. Stringent regulatory requirements and data privacy concerns can hinder innovation and market expansion. Cybersecurity threats and the need for robust data security measures pose significant challenges. Furthermore, competition from established insurers and the need to acquire and retain customers in a rapidly evolving market present ongoing hurdles. These factors contribute to a challenging, yet dynamic, market landscape.
Emerging Opportunities in Insurtech Market
Emerging trends and opportunities abound within the Insurtech sector. The rise of embedded insurance, integrating insurance into various platforms and services, presents a significant opportunity for market expansion. The increasing adoption of blockchain technology holds the potential to enhance security, transparency, and efficiency. Further expansion into emerging markets with high growth potential, such as Asia-Pacific and Africa, provides significant opportunities. Lastly, the convergence of Insurtech with other technologies such as fintech and healthcare tech creates new avenues for growth and innovation.
Leading Players in the Insurtech Market Market
- Banc Insurance Agency Inc (Insuritas)
- Policy Bazaar
- ZhongAn Online Property & Casualty Insurance Co Ltd
- Clover Health Insurance
- Acko General Insurance Limited
- Moonshot-Internet
- Sureify
- Lemonade
- Oscar Health
- Anorak
- BDEO
- Earnix
- Planck
- ThingCo
- Tractable
- Bima
- Metromile
- Collective Health
Note: This list is not exhaustive.
Key Developments in Insurtech Market Industry
March 2024: CNB Bank & Trust (CIBC) and Insuritas partnered to launch an embedded full-service insurance agency. This collaboration demonstrates the growing trend of embedding insurance within existing ecosystems to enhance customer reach and provide comprehensive solutions.
June 2023: Clover Health Investments Corp. reached a partnership agreement in principle to settle seven derivative lawsuits. While not directly impacting product development, this legal settlement removes uncertainty and contributes to a more stable operating environment for the company.
Strategic Outlook for Insurtech Market Market
The Insurtech market holds significant future potential. Continued technological advancements, coupled with evolving consumer preferences and supportive regulatory environments, will drive further market growth. The increasing adoption of embedded insurance, the exploration of innovative technologies like blockchain, and expansion into untapped markets will shape the future landscape. Strategic partnerships and mergers & acquisitions will remain vital for market consolidation and growth. The focus on personalized customer experiences, data-driven decision-making, and enhanced operational efficiency will continue to be crucial for success in the years to come.
Insurtech Market Segmentation
-
1. Insurance Line
- 1.1. Health
- 1.2. Life
- 1.3. Automotive
- 1.4. Home And Property
- 1.5. Travel Insurance
- 1.6. Other Insurance Lines
Insurtech Market Segmentation By Geography
-
1. North America
- 1.1. United States
- 1.2. Canada
- 1.3. Rest of North America
-
2. Europe
- 2.1. Germany
- 2.2. France
- 2.3. Spain
- 2.4. United Kingdom
- 2.5. Rest of Europe
-
3. South America
- 3.1. Brazil
- 3.2. Argentina
- 3.3. Rest of South America
-
4. Asia Pacific
- 4.1. India
- 4.2. China
- 4.3. Australia
- 4.4. Singapore
- 4.5. Hong Kong
- 4.6. Japan
- 4.7. Rest of Asia Pacific
- 5. Middle East
-
6. United Arab Emirates
- 6.1. Saudi Arabia
- 6.2. South Africa
- 6.3. Rest of Middle East
Insurtech Market REPORT HIGHLIGHTS
| Aspects | Details |
|---|---|
| Study Period | 2019-2033 |
| Base Year | 2024 |
| Estimated Year | 2025 |
| Forecast Period | 2025-2033 |
| Historical Period | 2019-2024 |
| Growth Rate | CAGR of 30.34% from 2019-2033 |
| Segmentation |
|
Table of Contents
- 1. Introduction
- 1.1. Research Scope
- 1.2. Market Segmentation
- 1.3. Research Methodology
- 1.4. Definitions and Assumptions
- 2. Executive Summary
- 2.1. Introduction
- 3. Market Dynamics
- 3.1. Introduction
- 3.2. Market Drivers
- 3.2.1. Rise in Investments in Digital Technologies to Reduce Operational Costs and Improve Efficiency & Customer Experience; Growth in the Use of Blockchain-Based Technology Among Health and Life Insurance Companies is Also Expected to Drive the Growth
- 3.3. Market Restrains
- 3.3.1. Rise in Investments in Digital Technologies to Reduce Operational Costs and Improve Efficiency & Customer Experience; Growth in the Use of Blockchain-Based Technology Among Health and Life Insurance Companies is Also Expected to Drive the Growth
- 3.4. Market Trends
- 3.4.1. Automotive Segment is Driving the Insurtech Market
- 4. Market Factor Analysis
- 4.1. Porters Five Forces
- 4.2. Supply/Value Chain
- 4.3. PESTEL analysis
- 4.4. Market Entropy
- 4.5. Patent/Trademark Analysis
- 5. Global Insurtech Market Analysis, Insights and Forecast, 2019-2031
- 5.1. Market Analysis, Insights and Forecast - by Insurance Line
- 5.1.1. Health
- 5.1.2. Life
- 5.1.3. Automotive
- 5.1.4. Home And Property
- 5.1.5. Travel Insurance
- 5.1.6. Other Insurance Lines
- 5.2. Market Analysis, Insights and Forecast - by Region
- 5.2.1. North America
- 5.2.2. Europe
- 5.2.3. South America
- 5.2.4. Asia Pacific
- 5.2.5. Middle East
- 5.2.6. United Arab Emirates
- 5.1. Market Analysis, Insights and Forecast - by Insurance Line
- 6. North America Insurtech Market Analysis, Insights and Forecast, 2019-2031
- 6.1. Market Analysis, Insights and Forecast - by Insurance Line
- 6.1.1. Health
- 6.1.2. Life
- 6.1.3. Automotive
- 6.1.4. Home And Property
- 6.1.5. Travel Insurance
- 6.1.6. Other Insurance Lines
- 6.1. Market Analysis, Insights and Forecast - by Insurance Line
- 7. Europe Insurtech Market Analysis, Insights and Forecast, 2019-2031
- 7.1. Market Analysis, Insights and Forecast - by Insurance Line
- 7.1.1. Health
- 7.1.2. Life
- 7.1.3. Automotive
- 7.1.4. Home And Property
- 7.1.5. Travel Insurance
- 7.1.6. Other Insurance Lines
- 7.1. Market Analysis, Insights and Forecast - by Insurance Line
- 8. South America Insurtech Market Analysis, Insights and Forecast, 2019-2031
- 8.1. Market Analysis, Insights and Forecast - by Insurance Line
- 8.1.1. Health
- 8.1.2. Life
- 8.1.3. Automotive
- 8.1.4. Home And Property
- 8.1.5. Travel Insurance
- 8.1.6. Other Insurance Lines
- 8.1. Market Analysis, Insights and Forecast - by Insurance Line
- 9. Asia Pacific Insurtech Market Analysis, Insights and Forecast, 2019-2031
- 9.1. Market Analysis, Insights and Forecast - by Insurance Line
- 9.1.1. Health
- 9.1.2. Life
- 9.1.3. Automotive
- 9.1.4. Home And Property
- 9.1.5. Travel Insurance
- 9.1.6. Other Insurance Lines
- 9.1. Market Analysis, Insights and Forecast - by Insurance Line
- 10. Middle East Insurtech Market Analysis, Insights and Forecast, 2019-2031
- 10.1. Market Analysis, Insights and Forecast - by Insurance Line
- 10.1.1. Health
- 10.1.2. Life
- 10.1.3. Automotive
- 10.1.4. Home And Property
- 10.1.5. Travel Insurance
- 10.1.6. Other Insurance Lines
- 10.1. Market Analysis, Insights and Forecast - by Insurance Line
- 11. United Arab Emirates Insurtech Market Analysis, Insights and Forecast, 2019-2031
- 11.1. Market Analysis, Insights and Forecast - by Insurance Line
- 11.1.1. Health
- 11.1.2. Life
- 11.1.3. Automotive
- 11.1.4. Home And Property
- 11.1.5. Travel Insurance
- 11.1.6. Other Insurance Lines
- 11.1. Market Analysis, Insights and Forecast - by Insurance Line
- 12. Competitive Analysis
- 12.1. Global Market Share Analysis 2024
- 12.2. Company Profiles
- 12.2.1 Banc Insurance Agency Inc (Insuritas)
- 12.2.1.1. Overview
- 12.2.1.2. Products
- 12.2.1.3. SWOT Analysis
- 12.2.1.4. Recent Developments
- 12.2.1.5. Financials (Based on Availability)
- 12.2.2 Policy Bazaar
- 12.2.2.1. Overview
- 12.2.2.2. Products
- 12.2.2.3. SWOT Analysis
- 12.2.2.4. Recent Developments
- 12.2.2.5. Financials (Based on Availability)
- 12.2.3 ZhongAn Online Property & Casualty Insurance Co Ltd
- 12.2.3.1. Overview
- 12.2.3.2. Products
- 12.2.3.3. SWOT Analysis
- 12.2.3.4. Recent Developments
- 12.2.3.5. Financials (Based on Availability)
- 12.2.4 Clover Health Insurance
- 12.2.4.1. Overview
- 12.2.4.2. Products
- 12.2.4.3. SWOT Analysis
- 12.2.4.4. Recent Developments
- 12.2.4.5. Financials (Based on Availability)
- 12.2.5 Acko General Insurance Limited
- 12.2.5.1. Overview
- 12.2.5.2. Products
- 12.2.5.3. SWOT Analysis
- 12.2.5.4. Recent Developments
- 12.2.5.5. Financials (Based on Availability)
- 12.2.6 Moonshot-Internet
- 12.2.6.1. Overview
- 12.2.6.2. Products
- 12.2.6.3. SWOT Analysis
- 12.2.6.4. Recent Developments
- 12.2.6.5. Financials (Based on Availability)
- 12.2.7 Sureify
- 12.2.7.1. Overview
- 12.2.7.2. Products
- 12.2.7.3. SWOT Analysis
- 12.2.7.4. Recent Developments
- 12.2.7.5. Financials (Based on Availability)
- 12.2.8 Lemonade
- 12.2.8.1. Overview
- 12.2.8.2. Products
- 12.2.8.3. SWOT Analysis
- 12.2.8.4. Recent Developments
- 12.2.8.5. Financials (Based on Availability)
- 12.2.9 Oscar Health
- 12.2.9.1. Overview
- 12.2.9.2. Products
- 12.2.9.3. SWOT Analysis
- 12.2.9.4. Recent Developments
- 12.2.9.5. Financials (Based on Availability)
- 12.2.10 Anorak
- 12.2.10.1. Overview
- 12.2.10.2. Products
- 12.2.10.3. SWOT Analysis
- 12.2.10.4. Recent Developments
- 12.2.10.5. Financials (Based on Availability)
- 12.2.11 BDEO
- 12.2.11.1. Overview
- 12.2.11.2. Products
- 12.2.11.3. SWOT Analysis
- 12.2.11.4. Recent Developments
- 12.2.11.5. Financials (Based on Availability)
- 12.2.12 Earnix
- 12.2.12.1. Overview
- 12.2.12.2. Products
- 12.2.12.3. SWOT Analysis
- 12.2.12.4. Recent Developments
- 12.2.12.5. Financials (Based on Availability)
- 12.2.13 Planck
- 12.2.13.1. Overview
- 12.2.13.2. Products
- 12.2.13.3. SWOT Analysis
- 12.2.13.4. Recent Developments
- 12.2.13.5. Financials (Based on Availability)
- 12.2.14 ThingCo
- 12.2.14.1. Overview
- 12.2.14.2. Products
- 12.2.14.3. SWOT Analysis
- 12.2.14.4. Recent Developments
- 12.2.14.5. Financials (Based on Availability)
- 12.2.15 Tractable
- 12.2.15.1. Overview
- 12.2.15.2. Products
- 12.2.15.3. SWOT Analysis
- 12.2.15.4. Recent Developments
- 12.2.15.5. Financials (Based on Availability)
- 12.2.16 Bima
- 12.2.16.1. Overview
- 12.2.16.2. Products
- 12.2.16.3. SWOT Analysis
- 12.2.16.4. Recent Developments
- 12.2.16.5. Financials (Based on Availability)
- 12.2.17 Metromile
- 12.2.17.1. Overview
- 12.2.17.2. Products
- 12.2.17.3. SWOT Analysis
- 12.2.17.4. Recent Developments
- 12.2.17.5. Financials (Based on Availability)
- 12.2.18 Collective Health**List Not Exhaustive
- 12.2.18.1. Overview
- 12.2.18.2. Products
- 12.2.18.3. SWOT Analysis
- 12.2.18.4. Recent Developments
- 12.2.18.5. Financials (Based on Availability)
- 12.2.1 Banc Insurance Agency Inc (Insuritas)
List of Figures
- Figure 1: Global Insurtech Market Revenue Breakdown (Million, %) by Region 2024 & 2032
- Figure 2: Global Insurtech Market Volume Breakdown (Billion, %) by Region 2024 & 2032
- Figure 3: North America Insurtech Market Revenue (Million), by Insurance Line 2024 & 2032
- Figure 4: North America Insurtech Market Volume (Billion), by Insurance Line 2024 & 2032
- Figure 5: North America Insurtech Market Revenue Share (%), by Insurance Line 2024 & 2032
- Figure 6: North America Insurtech Market Volume Share (%), by Insurance Line 2024 & 2032
- Figure 7: North America Insurtech Market Revenue (Million), by Country 2024 & 2032
- Figure 8: North America Insurtech Market Volume (Billion), by Country 2024 & 2032
- Figure 9: North America Insurtech Market Revenue Share (%), by Country 2024 & 2032
- Figure 10: North America Insurtech Market Volume Share (%), by Country 2024 & 2032
- Figure 11: Europe Insurtech Market Revenue (Million), by Insurance Line 2024 & 2032
- Figure 12: Europe Insurtech Market Volume (Billion), by Insurance Line 2024 & 2032
- Figure 13: Europe Insurtech Market Revenue Share (%), by Insurance Line 2024 & 2032
- Figure 14: Europe Insurtech Market Volume Share (%), by Insurance Line 2024 & 2032
- Figure 15: Europe Insurtech Market Revenue (Million), by Country 2024 & 2032
- Figure 16: Europe Insurtech Market Volume (Billion), by Country 2024 & 2032
- Figure 17: Europe Insurtech Market Revenue Share (%), by Country 2024 & 2032
- Figure 18: Europe Insurtech Market Volume Share (%), by Country 2024 & 2032
- Figure 19: South America Insurtech Market Revenue (Million), by Insurance Line 2024 & 2032
- Figure 20: South America Insurtech Market Volume (Billion), by Insurance Line 2024 & 2032
- Figure 21: South America Insurtech Market Revenue Share (%), by Insurance Line 2024 & 2032
- Figure 22: South America Insurtech Market Volume Share (%), by Insurance Line 2024 & 2032
- Figure 23: South America Insurtech Market Revenue (Million), by Country 2024 & 2032
- Figure 24: South America Insurtech Market Volume (Billion), by Country 2024 & 2032
- Figure 25: South America Insurtech Market Revenue Share (%), by Country 2024 & 2032
- Figure 26: South America Insurtech Market Volume Share (%), by Country 2024 & 2032
- Figure 27: Asia Pacific Insurtech Market Revenue (Million), by Insurance Line 2024 & 2032
- Figure 28: Asia Pacific Insurtech Market Volume (Billion), by Insurance Line 2024 & 2032
- Figure 29: Asia Pacific Insurtech Market Revenue Share (%), by Insurance Line 2024 & 2032
- Figure 30: Asia Pacific Insurtech Market Volume Share (%), by Insurance Line 2024 & 2032
- Figure 31: Asia Pacific Insurtech Market Revenue (Million), by Country 2024 & 2032
- Figure 32: Asia Pacific Insurtech Market Volume (Billion), by Country 2024 & 2032
- Figure 33: Asia Pacific Insurtech Market Revenue Share (%), by Country 2024 & 2032
- Figure 34: Asia Pacific Insurtech Market Volume Share (%), by Country 2024 & 2032
- Figure 35: Middle East Insurtech Market Revenue (Million), by Insurance Line 2024 & 2032
- Figure 36: Middle East Insurtech Market Volume (Billion), by Insurance Line 2024 & 2032
- Figure 37: Middle East Insurtech Market Revenue Share (%), by Insurance Line 2024 & 2032
- Figure 38: Middle East Insurtech Market Volume Share (%), by Insurance Line 2024 & 2032
- Figure 39: Middle East Insurtech Market Revenue (Million), by Country 2024 & 2032
- Figure 40: Middle East Insurtech Market Volume (Billion), by Country 2024 & 2032
- Figure 41: Middle East Insurtech Market Revenue Share (%), by Country 2024 & 2032
- Figure 42: Middle East Insurtech Market Volume Share (%), by Country 2024 & 2032
- Figure 43: United Arab Emirates Insurtech Market Revenue (Million), by Insurance Line 2024 & 2032
- Figure 44: United Arab Emirates Insurtech Market Volume (Billion), by Insurance Line 2024 & 2032
- Figure 45: United Arab Emirates Insurtech Market Revenue Share (%), by Insurance Line 2024 & 2032
- Figure 46: United Arab Emirates Insurtech Market Volume Share (%), by Insurance Line 2024 & 2032
- Figure 47: United Arab Emirates Insurtech Market Revenue (Million), by Country 2024 & 2032
- Figure 48: United Arab Emirates Insurtech Market Volume (Billion), by Country 2024 & 2032
- Figure 49: United Arab Emirates Insurtech Market Revenue Share (%), by Country 2024 & 2032
- Figure 50: United Arab Emirates Insurtech Market Volume Share (%), by Country 2024 & 2032
List of Tables
- Table 1: Global Insurtech Market Revenue Million Forecast, by Region 2019 & 2032
- Table 2: Global Insurtech Market Volume Billion Forecast, by Region 2019 & 2032
- Table 3: Global Insurtech Market Revenue Million Forecast, by Insurance Line 2019 & 2032
- Table 4: Global Insurtech Market Volume Billion Forecast, by Insurance Line 2019 & 2032
- Table 5: Global Insurtech Market Revenue Million Forecast, by Region 2019 & 2032
- Table 6: Global Insurtech Market Volume Billion Forecast, by Region 2019 & 2032
- Table 7: Global Insurtech Market Revenue Million Forecast, by Insurance Line 2019 & 2032
- Table 8: Global Insurtech Market Volume Billion Forecast, by Insurance Line 2019 & 2032
- Table 9: Global Insurtech Market Revenue Million Forecast, by Country 2019 & 2032
- Table 10: Global Insurtech Market Volume Billion Forecast, by Country 2019 & 2032
- Table 11: United States Insurtech Market Revenue (Million) Forecast, by Application 2019 & 2032
- Table 12: United States Insurtech Market Volume (Billion) Forecast, by Application 2019 & 2032
- Table 13: Canada Insurtech Market Revenue (Million) Forecast, by Application 2019 & 2032
- Table 14: Canada Insurtech Market Volume (Billion) Forecast, by Application 2019 & 2032
- Table 15: Rest of North America Insurtech Market Revenue (Million) Forecast, by Application 2019 & 2032
- Table 16: Rest of North America Insurtech Market Volume (Billion) Forecast, by Application 2019 & 2032
- Table 17: Global Insurtech Market Revenue Million Forecast, by Insurance Line 2019 & 2032
- Table 18: Global Insurtech Market Volume Billion Forecast, by Insurance Line 2019 & 2032
- Table 19: Global Insurtech Market Revenue Million Forecast, by Country 2019 & 2032
- Table 20: Global Insurtech Market Volume Billion Forecast, by Country 2019 & 2032
- Table 21: Germany Insurtech Market Revenue (Million) Forecast, by Application 2019 & 2032
- Table 22: Germany Insurtech Market Volume (Billion) Forecast, by Application 2019 & 2032
- Table 23: France Insurtech Market Revenue (Million) Forecast, by Application 2019 & 2032
- Table 24: France Insurtech Market Volume (Billion) Forecast, by Application 2019 & 2032
- Table 25: Spain Insurtech Market Revenue (Million) Forecast, by Application 2019 & 2032
- Table 26: Spain Insurtech Market Volume (Billion) Forecast, by Application 2019 & 2032
- Table 27: United Kingdom Insurtech Market Revenue (Million) Forecast, by Application 2019 & 2032
- Table 28: United Kingdom Insurtech Market Volume (Billion) Forecast, by Application 2019 & 2032
- Table 29: Rest of Europe Insurtech Market Revenue (Million) Forecast, by Application 2019 & 2032
- Table 30: Rest of Europe Insurtech Market Volume (Billion) Forecast, by Application 2019 & 2032
- Table 31: Global Insurtech Market Revenue Million Forecast, by Insurance Line 2019 & 2032
- Table 32: Global Insurtech Market Volume Billion Forecast, by Insurance Line 2019 & 2032
- Table 33: Global Insurtech Market Revenue Million Forecast, by Country 2019 & 2032
- Table 34: Global Insurtech Market Volume Billion Forecast, by Country 2019 & 2032
- Table 35: Brazil Insurtech Market Revenue (Million) Forecast, by Application 2019 & 2032
- Table 36: Brazil Insurtech Market Volume (Billion) Forecast, by Application 2019 & 2032
- Table 37: Argentina Insurtech Market Revenue (Million) Forecast, by Application 2019 & 2032
- Table 38: Argentina Insurtech Market Volume (Billion) Forecast, by Application 2019 & 2032
- Table 39: Rest of South America Insurtech Market Revenue (Million) Forecast, by Application 2019 & 2032
- Table 40: Rest of South America Insurtech Market Volume (Billion) Forecast, by Application 2019 & 2032
- Table 41: Global Insurtech Market Revenue Million Forecast, by Insurance Line 2019 & 2032
- Table 42: Global Insurtech Market Volume Billion Forecast, by Insurance Line 2019 & 2032
- Table 43: Global Insurtech Market Revenue Million Forecast, by Country 2019 & 2032
- Table 44: Global Insurtech Market Volume Billion Forecast, by Country 2019 & 2032
- Table 45: India Insurtech Market Revenue (Million) Forecast, by Application 2019 & 2032
- Table 46: India Insurtech Market Volume (Billion) Forecast, by Application 2019 & 2032
- Table 47: China Insurtech Market Revenue (Million) Forecast, by Application 2019 & 2032
- Table 48: China Insurtech Market Volume (Billion) Forecast, by Application 2019 & 2032
- Table 49: Australia Insurtech Market Revenue (Million) Forecast, by Application 2019 & 2032
- Table 50: Australia Insurtech Market Volume (Billion) Forecast, by Application 2019 & 2032
- Table 51: Singapore Insurtech Market Revenue (Million) Forecast, by Application 2019 & 2032
- Table 52: Singapore Insurtech Market Volume (Billion) Forecast, by Application 2019 & 2032
- Table 53: Hong Kong Insurtech Market Revenue (Million) Forecast, by Application 2019 & 2032
- Table 54: Hong Kong Insurtech Market Volume (Billion) Forecast, by Application 2019 & 2032
- Table 55: Japan Insurtech Market Revenue (Million) Forecast, by Application 2019 & 2032
- Table 56: Japan Insurtech Market Volume (Billion) Forecast, by Application 2019 & 2032
- Table 57: Rest of Asia Pacific Insurtech Market Revenue (Million) Forecast, by Application 2019 & 2032
- Table 58: Rest of Asia Pacific Insurtech Market Volume (Billion) Forecast, by Application 2019 & 2032
- Table 59: Global Insurtech Market Revenue Million Forecast, by Insurance Line 2019 & 2032
- Table 60: Global Insurtech Market Volume Billion Forecast, by Insurance Line 2019 & 2032
- Table 61: Global Insurtech Market Revenue Million Forecast, by Country 2019 & 2032
- Table 62: Global Insurtech Market Volume Billion Forecast, by Country 2019 & 2032
- Table 63: Global Insurtech Market Revenue Million Forecast, by Insurance Line 2019 & 2032
- Table 64: Global Insurtech Market Volume Billion Forecast, by Insurance Line 2019 & 2032
- Table 65: Global Insurtech Market Revenue Million Forecast, by Country 2019 & 2032
- Table 66: Global Insurtech Market Volume Billion Forecast, by Country 2019 & 2032
- Table 67: Saudi Arabia Insurtech Market Revenue (Million) Forecast, by Application 2019 & 2032
- Table 68: Saudi Arabia Insurtech Market Volume (Billion) Forecast, by Application 2019 & 2032
- Table 69: South Africa Insurtech Market Revenue (Million) Forecast, by Application 2019 & 2032
- Table 70: South Africa Insurtech Market Volume (Billion) Forecast, by Application 2019 & 2032
- Table 71: Rest of Middle East Insurtech Market Revenue (Million) Forecast, by Application 2019 & 2032
- Table 72: Rest of Middle East Insurtech Market Volume (Billion) Forecast, by Application 2019 & 2032
Frequently Asked Questions
1. What is the projected Compound Annual Growth Rate (CAGR) of the Insurtech Market?
The projected CAGR is approximately 30.34%.
2. Which companies are prominent players in the Insurtech Market?
Key companies in the market include Banc Insurance Agency Inc (Insuritas), Policy Bazaar, ZhongAn Online Property & Casualty Insurance Co Ltd, Clover Health Insurance, Acko General Insurance Limited, Moonshot-Internet, Sureify, Lemonade, Oscar Health, Anorak, BDEO, Earnix, Planck, ThingCo, Tractable, Bima, Metromile, Collective Health**List Not Exhaustive.
3. What are the main segments of the Insurtech Market?
The market segments include Insurance Line.
4. Can you provide details about the market size?
The market size is estimated to be USD 8.63 Million as of 2022.
5. What are some drivers contributing to market growth?
Rise in Investments in Digital Technologies to Reduce Operational Costs and Improve Efficiency & Customer Experience; Growth in the Use of Blockchain-Based Technology Among Health and Life Insurance Companies is Also Expected to Drive the Growth.
6. What are the notable trends driving market growth?
Automotive Segment is Driving the Insurtech Market.
7. Are there any restraints impacting market growth?
Rise in Investments in Digital Technologies to Reduce Operational Costs and Improve Efficiency & Customer Experience; Growth in the Use of Blockchain-Based Technology Among Health and Life Insurance Companies is Also Expected to Drive the Growth.
8. Can you provide examples of recent developments in the market?
March 2024: CNB Bank & Trust (CIBC) and Insuritas partnered to launch an embedded full-service insurance agency. Insuritas is proud to announce that it has been chosen by CIBC to install its award-winning, fully-functioning digital insurance agency solution. BUNDLE is Insuritas' award-winning, full-functioning insurance agency platform embedded in CIBC's ecosystem and engineered to provide a complete solution for CIBC's retail and commercial clients.June 2023: Clover Health Investments Corp., a leading provider of physician enablement services with a mission to improve Medicare access to quality healthcare, announced that it had reached a partnership agreement in principle to settle seven derivative lawsuits that are pending in the courts of Delaware and New York, as well as in the courts of Tennessee.
9. What pricing options are available for accessing the report?
Pricing options include single-user, multi-user, and enterprise licenses priced at USD 4750, USD 5250, and USD 8750 respectively.
10. Is the market size provided in terms of value or volume?
The market size is provided in terms of value, measured in Million and volume, measured in Billion.
11. Are there any specific market keywords associated with the report?
Yes, the market keyword associated with the report is "Insurtech Market," which aids in identifying and referencing the specific market segment covered.
12. How do I determine which pricing option suits my needs best?
The pricing options vary based on user requirements and access needs. Individual users may opt for single-user licenses, while businesses requiring broader access may choose multi-user or enterprise licenses for cost-effective access to the report.
13. Are there any additional resources or data provided in the Insurtech Market report?
While the report offers comprehensive insights, it's advisable to review the specific contents or supplementary materials provided to ascertain if additional resources or data are available.
14. How can I stay updated on further developments or reports in the Insurtech Market?
To stay informed about further developments, trends, and reports in the Insurtech Market, consider subscribing to industry newsletters, following relevant companies and organizations, or regularly checking reputable industry news sources and publications.
Methodology
Step 1 - Identification of Relevant Samples Size from Population Database


Step 2 - Approaches for Defining Global Market Size (Value, Volume* & Price*)

Note*: In applicable scenarios
Step 3 - Data Sources
Primary Research
- Web Analytics
- Survey Reports
- Research Institute
- Latest Research Reports
- Opinion Leaders
Secondary Research
- Annual Reports
- White Paper
- Latest Press Release
- Industry Association
- Paid Database
- Investor Presentations

Step 4 - Data Triangulation
Involves using different sources of information in order to increase the validity of a study
These sources are likely to be stakeholders in a program - participants, other researchers, program staff, other community members, and so on.
Then we put all data in single framework & apply various statistical tools to find out the dynamic on the market.
During the analysis stage, feedback from the stakeholder groups would be compared to determine areas of agreement as well as areas of divergence


