
Key Insights
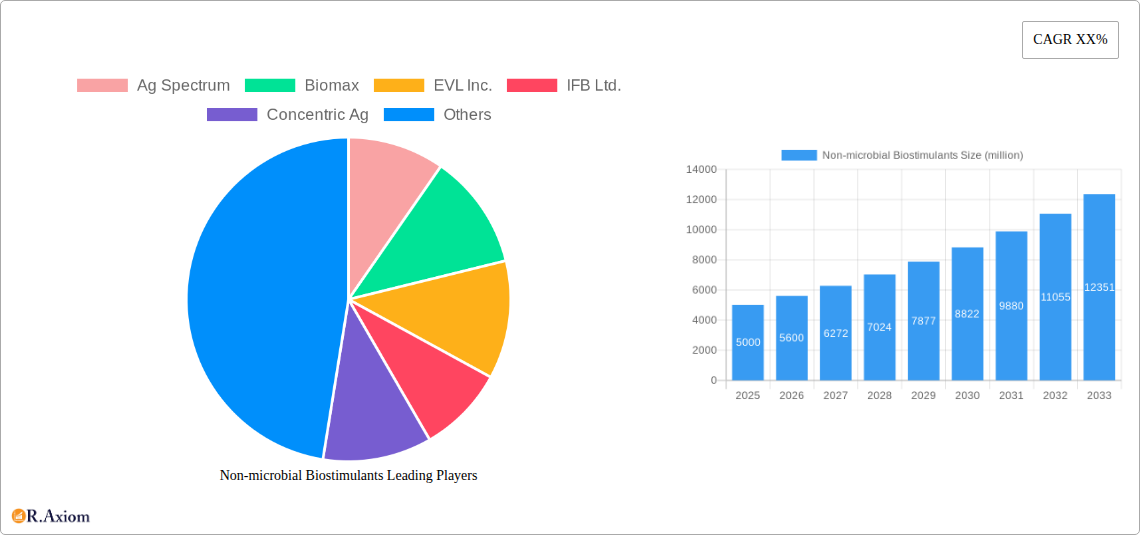
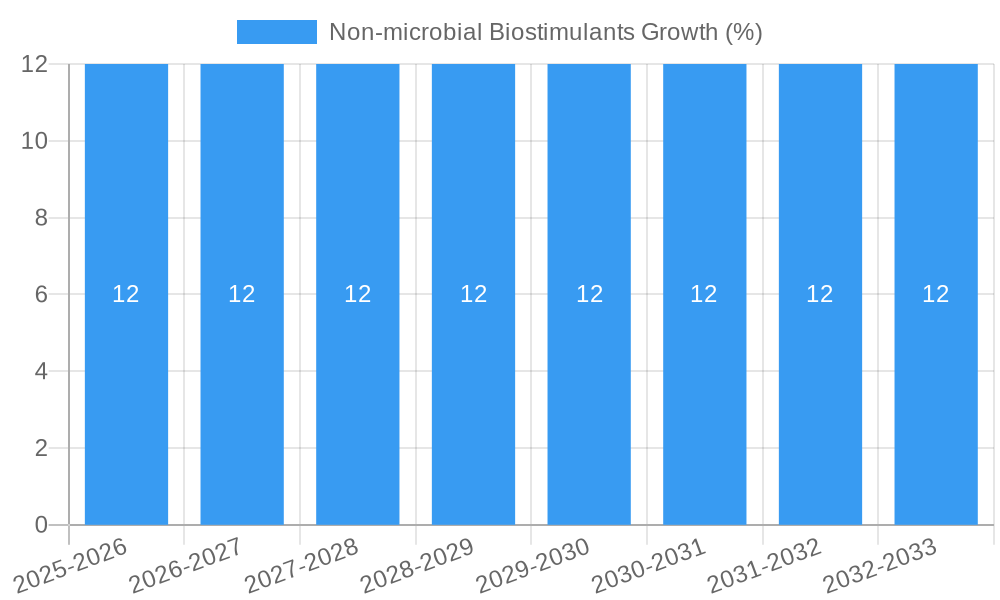
The global Non-microbial Biostimulants market is experiencing robust expansion, projected to reach approximately $5,000 million by 2025. This growth is driven by an increasing demand for sustainable agricultural practices, coupled with the need to enhance crop yield and quality in the face of evolving environmental challenges. The market is further propelled by the growing awareness among farmers about the benefits of biostimulants in improving nutrient uptake, stress tolerance, and overall plant health, thereby reducing reliance on synthetic fertilizers and pesticides. Key applications within this segment include legumes, grains, and vegetables and fruits, with all showing significant uptake. The rising adoption of advanced farming techniques and government initiatives promoting organic and sustainable agriculture are also contributing to this positive market trajectory, underpinning a compound annual growth rate (CAGR) of approximately 12% over the forecast period.
The market landscape is characterized by a diverse range of product types, with Humic Acid, Seaweed Extract, and Protein Hydrolysate and Amino Acids emerging as the dominant segments, accounting for a substantial share of the market value. Chitin, Chitosan and Its Derivatives are also gaining traction due to their unique properties and potential in enhancing soil health and plant defense mechanisms. Geographically, Asia Pacific, led by China and India, is anticipated to be the fastest-growing region, driven by its large agricultural base and increasing investments in agricultural technology. North America and Europe, with their established sustainable farming initiatives and high adoption rates of advanced agricultural inputs, are expected to maintain significant market shares. The competitive environment is dynamic, with prominent players like Ag Spectrum, Biomax, and IFB Ltd. actively engaged in research and development, strategic collaborations, and market expansion to capture a larger share of this expanding market.
Non-microbial Biostimulants Market Concentration & Innovation
The global Non-microbial Biostimulants market is characterized by a moderate level of concentration, with a few leading companies holding significant market share, while a growing number of regional and specialized players contribute to a dynamic competitive landscape. Innovation is a primary driver, fueled by extensive research and development into novel formulations and enhanced product efficacy. Key innovation areas include the extraction and synthesis of advanced compounds from natural sources, such as novel seaweed derivatives and refined protein hydrolysates, offering superior nutrient uptake and stress tolerance for crops. Regulatory frameworks, while evolving globally, are increasingly supportive of sustainable agricultural practices, creating a favorable environment for biostimulant adoption. The threat of product substitutes, primarily synthetic fertilizers and conventional crop protection chemicals, is managed through biostimulants' unique value propositions of improved soil health, reduced environmental impact, and enhanced crop quality. End-user trends clearly favor sustainable and organic farming practices, driving demand for biostimulant solutions. Mergers and Acquisitions (M&A) activity, valued in the tens of millions, plays a crucial role in market consolidation and technological advancement. For instance, acquisitions of innovative startups by larger corporations are common, aiming to integrate cutting-edge biostimulant technologies and expand market reach. The market share of top players is estimated to be between 15% and 25% individually, with M&A deal values ranging from xx million to xx million dollars annually.
Non-microbial Biostimulants Industry Trends & Insights
The Non-microbial Biostimulants industry is poised for substantial growth, driven by a confluence of factors that are reshaping modern agriculture. The market is projected to expand at a Compound Annual Growth Rate (CAGR) of approximately 8% to 12% from 2019 to 2033, reaching an estimated market size of over xx million in 2025, and projected to exceed xx million by 2033. This growth is underpinned by a global shift towards sustainable agricultural practices, aimed at enhancing crop yields and quality while minimizing environmental impact. Farmers are increasingly recognizing the benefits of biostimulants in improving nutrient use efficiency, enhancing plant resilience to abiotic stresses such as drought, salinity, and extreme temperatures, and promoting better soil health. Technological disruptions are at the forefront of this evolution, with continuous advancements in the extraction, purification, and formulation of active ingredients like humic acids, seaweed extracts, and amino acids. These innovations are leading to more potent and targeted biostimulant products that offer tangible benefits to growers. Consumer preferences are also playing a significant role, with a growing demand for sustainably produced food, free from excessive chemical residues. This demand translates into increased adoption of organic and integrated farming systems, where non-microbial biostimulants are essential components. The competitive dynamics within the industry are intensifying, with both established agrochemical giants and agile specialized biostimulant companies vying for market share. Strategic collaborations, product differentiation through specialized formulations, and a focus on addressing specific crop and regional needs are key strategies employed by market participants. The market penetration of biostimulants is expected to rise significantly as awareness grows and regulatory support strengthens, moving from an estimated xx% in 2025 to over xx% by 2033.
Dominant Markets & Segments in Non-microbial Biostimulants
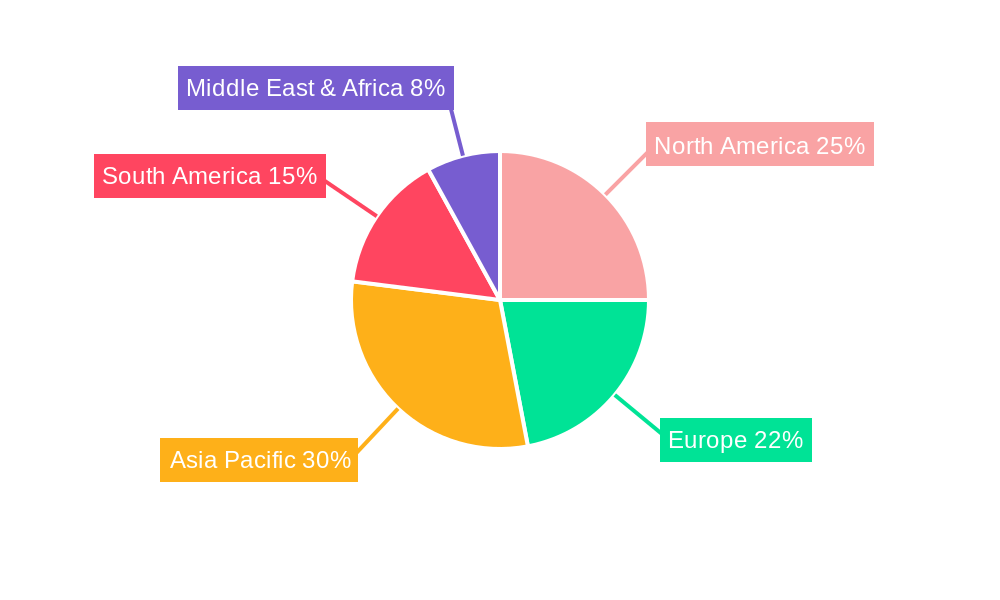
The Non-microbial Biostimulants market exhibits robust growth across its diverse segments, with certain regions and product types demonstrating exceptional dominance. North America is a leading market, driven by advanced agricultural practices, strong government support for sustainable farming initiatives, and a high adoption rate of innovative crop management solutions. The United States, in particular, represents a significant portion of this market due to its large agricultural land base and the increasing focus on precision agriculture and reducing reliance on synthetic inputs.
Asia Pacific is emerging as a high-growth region, fueled by increasing awareness of sustainable agriculture, a burgeoning population demanding more food, and supportive government policies aimed at improving crop yields and food security. Countries like China and India are key contributors to this growth, with a rising adoption of biostimulants in their vast agricultural sectors.
Within the Application segmentation, Vegetables and Fruits represent a dominant segment. This is attributed to the higher value of these crops, the growing consumer demand for premium quality produce with improved shelf life and nutritional content, and the susceptibility of these crops to various environmental stresses. The application of biostimulants in this segment directly translates to enhanced yield, improved fruit set, and better post-harvest quality.
Grains, followed closely by Legumes, also constitute significant segments. The widespread cultivation of grains globally, coupled with the need to optimize yield and nutrient uptake in staple crops, drives consistent demand. For legumes, biostimulants play a crucial role in enhancing nitrogen fixation and overall plant vigor, contributing to improved soil health and crop productivity.
In terms of Types, Seaweed Extract and Humic Acid are currently the most dominant. Seaweed extracts, rich in a complex array of growth hormones, trace elements, and polysaccharides, offer a wide range of benefits from nutrient absorption to stress tolerance. Humic acids, vital components of soil organic matter, improve soil structure, enhance nutrient availability, and stimulate root development, making them fundamental to sustainable agriculture.
Protein Hydrolysate and Amino Acids are rapidly gaining traction due to their direct role in plant metabolism, protein synthesis, and stress mitigation, offering targeted solutions for specific crop needs. The segment of Chitin, Chitosan and Its Derivatives is also witnessing an upward trend, driven by its multifaceted applications in plant defense activation and disease resistance, alongside its potential as a soil conditioner.
Key drivers for dominance in these segments include:
- Economic Policies: Government subsidies, tax incentives for sustainable farming, and trade policies that favor bio-based inputs.
- Infrastructure Development: Enhanced logistics and distribution networks facilitating wider product availability.
- Research & Development Investment: Continuous innovation leading to more effective and targeted biostimulant formulations.
- Farmer Education & Awareness Programs: Increased understanding of biostimulant benefits and their application in crop management.
- Climate Change Adaptation: Growing need for solutions that enhance crop resilience to adverse environmental conditions.
Non-microbial Biostimulants Product Developments
Product innovation in non-microbial biostimulants is focused on enhancing efficacy, sustainability, and ease of application. Companies are developing advanced formulations of seaweed extracts and humic acids with standardized active ingredient concentrations for predictable performance. Novel protein hydrolysates are being engineered for targeted nutrient delivery and stress response activation. The development of biodegradable and eco-friendly carriers for biostimulant active ingredients is a key trend, ensuring minimal environmental footprint. Competitive advantages are being built around specific crop-nutrient interaction capabilities, improved shelf-life, and compatibility with integrated pest management programs.
Report Scope & Segmentation Analysis
This report provides a comprehensive analysis of the global Non-microbial Biostimulants market, covering the study period from 2019 to 2033, with 2025 as the base and estimated year, and the forecast period spanning 2025–2033. The market is segmented by Application into Legumes, Grains, Vegetables and Fruits, and Other. The Vegetables and Fruits segment is projected to exhibit a CAGR of xx% and reach xx million by 2033, driven by demand for higher quality produce. The Grains segment is expected to grow at a CAGR of xx% with a market size of xx million by 2033. The Legumes segment is anticipated to grow at xx% CAGR, reaching xx million by 2033. The Other application segment, encompassing industrial crops and turf, is expected to grow at xx% CAGR. By Type, the market includes Humic Acid, Seaweed Extract, Protein Hydrolysate and Amino Acids, and Chitin, Chitosan and Its Derivatives. The Seaweed Extract segment is projected to lead with a CAGR of xx%, reaching xx million by 2033. Humic Acid is expected to grow at xx% CAGR to xx million. Protein Hydrolysate and Amino Acids are forecasted to expand at a rapid xx% CAGR to xx million. The Chitin, Chitosan and Its Derivatives segment is anticipated to grow at xx% CAGR to xx million.
Key Drivers of Non-microbial Biostimulants Growth
The growth of the non-microbial biostimulants sector is propelled by several key drivers. The increasing global demand for sustainably produced food, coupled with growing consumer awareness regarding environmental impact and food safety, is a primary catalyst. Furthermore, regulatory support for bio-based agricultural inputs and restrictions on synthetic fertilizers and pesticides encourage the adoption of biostimulants. Technological advancements in formulation and extraction techniques are leading to more effective and targeted products, enhancing crop yields and resilience. The rising incidence of abiotic stresses, such as drought and salinity, due to climate change necessitates the use of crop protection and enhancement solutions like biostimulants.
Challenges in the Non-microbial Biostimulants Sector
Despite the positive growth trajectory, the non-microbial biostimulants sector faces several challenges. Regulatory hurdles and varying approval processes across different regions can slow down market entry and product commercialization. Limited farmer awareness and understanding of biostimulant efficacy and application can hinder widespread adoption. Supply chain complexities and the need for specialized logistics for certain bio-based products can also present difficulties. Moreover, the high cost of research and development for novel formulations, coupled with the competitive pressure from established synthetic agrochemical products, contributes to market restraints.
Emerging Opportunities in Non-microbial Biostimulants
Emerging opportunities in the non-microbial biostimulants market lie in the development of advanced, precision-based formulations tailored for specific crop needs and environmental conditions. The growing trend of urban farming and controlled environment agriculture presents a niche market for specialized biostimulants. Furthermore, the integration of biostimulants with digital farming technologies, such as sensors and data analytics, offers potential for optimizing application and maximizing benefits. The increasing focus on soil health and regenerative agriculture practices creates a significant opportunity for biostimulants that enhance soil microbial activity and nutrient cycling.
Leading Players in the Non-microbial Biostimulants Market
- Ag Spectrum
- Biomax
- EVL Inc.
- IFB Ltd.
- Concentric Ag
- Symborg
- ABiTEP
- IAB
- AGRO Bio
- BioPower
- Lantmannen Bioagri
- Mapleton Agri
- CCS Aosta
- Motivos Campestres
- Organica
- T. Stanes
- De Sangosse
- Greenmax Agrotech
- Biostadt
- Biotech International
- HCM Agro Produts
- Dhanuka
- PI Industries
- IPL Biologicals
- AMMS Century
Key Developments in Non-microbial Biostimulants Industry
- 2023: Launch of a new seaweed-derived biostimulant with enhanced nutrient uptake capabilities by De Sangosse.
- 2022: Acquisition of a protein hydrolysate technology startup by PI Industries to expand its biostimulant portfolio.
- 2022: Introduction of a humic acid-based soil amendment designed for improved water retention by Concentric Ag.
- 2021: Symborg launched a range of amino acid-based biostimulants targeting specific stress tolerance in vegetable crops.
- 2020: EVL Inc. secured significant funding for the research and development of novel chitin-based biostimulants.
Strategic Outlook for Non-microbial Biostimulants Market
The strategic outlook for the non-microbial biostimulants market is highly positive, driven by a sustained global demand for sustainable agriculture and food security. The industry is expected to witness continued innovation in product formulation, leading to more targeted and effective solutions. Strategic partnerships and acquisitions will play a vital role in market consolidation and the dissemination of advanced technologies. The increasing regulatory favorability towards bio-based inputs and growing farmer adoption will further catalyze growth. Opportunities in emerging markets and the integration of biostimulants with digital agriculture present avenues for significant expansion and value creation.
Non-microbial Biostimulants Segmentation
-
1. Application
- 1.1. Legumes
- 1.2. Grains
- 1.3. Vegetables and Fruits
- 1.4. Other
-
2. Types
- 2.1. Humic Acid
- 2.2. Seaweed Extract
- 2.3. Protein Hydrolysate and Amino Acids
- 2.4. Chitin
- 2.5. Chitosan and Its Derivatives
Non-microbial Biostimulants Segmentation By Geography
-
1. North America
- 1.1. United States
- 1.2. Canada
- 1.3. Mexico
-
2. South America
- 2.1. Brazil
- 2.2. Argentina
- 2.3. Rest of South America
-
3. Europe
- 3.1. United Kingdom
- 3.2. Germany
- 3.3. France
- 3.4. Italy
- 3.5. Spain
- 3.6. Russia
- 3.7. Benelux
- 3.8. Nordics
- 3.9. Rest of Europe
-
4. Middle East & Africa
- 4.1. Turkey
- 4.2. Israel
- 4.3. GCC
- 4.4. North Africa
- 4.5. South Africa
- 4.6. Rest of Middle East & Africa
-
5. Asia Pacific
- 5.1. China
- 5.2. India
- 5.3. Japan
- 5.4. South Korea
- 5.5. ASEAN
- 5.6. Oceania
- 5.7. Rest of Asia Pacific
Non-microbial Biostimulants REPORT HIGHLIGHTS
| Aspects | Details |
|---|---|
| Study Period | 2019-2033 |
| Base Year | 2024 |
| Estimated Year | 2025 |
| Forecast Period | 2025-2033 |
| Historical Period | 2019-2024 |
| Growth Rate | CAGR of XX% from 2019-2033 |
| Segmentation |
|
Table of Contents
- 1. Introduction
- 1.1. Research Scope
- 1.2. Market Segmentation
- 1.3. Research Methodology
- 1.4. Definitions and Assumptions
- 2. Executive Summary
- 2.1. Introduction
- 3. Market Dynamics
- 3.1. Introduction
- 3.2. Market Drivers
- 3.3. Market Restrains
- 3.4. Market Trends
- 4. Market Factor Analysis
- 4.1. Porters Five Forces
- 4.2. Supply/Value Chain
- 4.3. PESTEL analysis
- 4.4. Market Entropy
- 4.5. Patent/Trademark Analysis
- 5. Global Non-microbial Biostimulants Analysis, Insights and Forecast, 2019-2031
- 5.1. Market Analysis, Insights and Forecast - by Application
- 5.1.1. Legumes
- 5.1.2. Grains
- 5.1.3. Vegetables and Fruits
- 5.1.4. Other
- 5.2. Market Analysis, Insights and Forecast - by Types
- 5.2.1. Humic Acid
- 5.2.2. Seaweed Extract
- 5.2.3. Protein Hydrolysate and Amino Acids
- 5.2.4. Chitin
- 5.2.5. Chitosan and Its Derivatives
- 5.3. Market Analysis, Insights and Forecast - by Region
- 5.3.1. North America
- 5.3.2. South America
- 5.3.3. Europe
- 5.3.4. Middle East & Africa
- 5.3.5. Asia Pacific
- 5.1. Market Analysis, Insights and Forecast - by Application
- 6. North America Non-microbial Biostimulants Analysis, Insights and Forecast, 2019-2031
- 6.1. Market Analysis, Insights and Forecast - by Application
- 6.1.1. Legumes
- 6.1.2. Grains
- 6.1.3. Vegetables and Fruits
- 6.1.4. Other
- 6.2. Market Analysis, Insights and Forecast - by Types
- 6.2.1. Humic Acid
- 6.2.2. Seaweed Extract
- 6.2.3. Protein Hydrolysate and Amino Acids
- 6.2.4. Chitin
- 6.2.5. Chitosan and Its Derivatives
- 6.1. Market Analysis, Insights and Forecast - by Application
- 7. South America Non-microbial Biostimulants Analysis, Insights and Forecast, 2019-2031
- 7.1. Market Analysis, Insights and Forecast - by Application
- 7.1.1. Legumes
- 7.1.2. Grains
- 7.1.3. Vegetables and Fruits
- 7.1.4. Other
- 7.2. Market Analysis, Insights and Forecast - by Types
- 7.2.1. Humic Acid
- 7.2.2. Seaweed Extract
- 7.2.3. Protein Hydrolysate and Amino Acids
- 7.2.4. Chitin
- 7.2.5. Chitosan and Its Derivatives
- 7.1. Market Analysis, Insights and Forecast - by Application
- 8. Europe Non-microbial Biostimulants Analysis, Insights and Forecast, 2019-2031
- 8.1. Market Analysis, Insights and Forecast - by Application
- 8.1.1. Legumes
- 8.1.2. Grains
- 8.1.3. Vegetables and Fruits
- 8.1.4. Other
- 8.2. Market Analysis, Insights and Forecast - by Types
- 8.2.1. Humic Acid
- 8.2.2. Seaweed Extract
- 8.2.3. Protein Hydrolysate and Amino Acids
- 8.2.4. Chitin
- 8.2.5. Chitosan and Its Derivatives
- 8.1. Market Analysis, Insights and Forecast - by Application
- 9. Middle East & Africa Non-microbial Biostimulants Analysis, Insights and Forecast, 2019-2031
- 9.1. Market Analysis, Insights and Forecast - by Application
- 9.1.1. Legumes
- 9.1.2. Grains
- 9.1.3. Vegetables and Fruits
- 9.1.4. Other
- 9.2. Market Analysis, Insights and Forecast - by Types
- 9.2.1. Humic Acid
- 9.2.2. Seaweed Extract
- 9.2.3. Protein Hydrolysate and Amino Acids
- 9.2.4. Chitin
- 9.2.5. Chitosan and Its Derivatives
- 9.1. Market Analysis, Insights and Forecast - by Application
- 10. Asia Pacific Non-microbial Biostimulants Analysis, Insights and Forecast, 2019-2031
- 10.1. Market Analysis, Insights and Forecast - by Application
- 10.1.1. Legumes
- 10.1.2. Grains
- 10.1.3. Vegetables and Fruits
- 10.1.4. Other
- 10.2. Market Analysis, Insights and Forecast - by Types
- 10.2.1. Humic Acid
- 10.2.2. Seaweed Extract
- 10.2.3. Protein Hydrolysate and Amino Acids
- 10.2.4. Chitin
- 10.2.5. Chitosan and Its Derivatives
- 10.1. Market Analysis, Insights and Forecast - by Application
- 11. Competitive Analysis
- 11.1. Global Market Share Analysis 2024
- 11.2. Company Profiles
- 11.2.1 Ag Spectrum
- 11.2.1.1. Overview
- 11.2.1.2. Products
- 11.2.1.3. SWOT Analysis
- 11.2.1.4. Recent Developments
- 11.2.1.5. Financials (Based on Availability)
- 11.2.2 Biomax
- 11.2.2.1. Overview
- 11.2.2.2. Products
- 11.2.2.3. SWOT Analysis
- 11.2.2.4. Recent Developments
- 11.2.2.5. Financials (Based on Availability)
- 11.2.3 EVL Inc.
- 11.2.3.1. Overview
- 11.2.3.2. Products
- 11.2.3.3. SWOT Analysis
- 11.2.3.4. Recent Developments
- 11.2.3.5. Financials (Based on Availability)
- 11.2.4 IFB Ltd.
- 11.2.4.1. Overview
- 11.2.4.2. Products
- 11.2.4.3. SWOT Analysis
- 11.2.4.4. Recent Developments
- 11.2.4.5. Financials (Based on Availability)
- 11.2.5 Concentric Ag
- 11.2.5.1. Overview
- 11.2.5.2. Products
- 11.2.5.3. SWOT Analysis
- 11.2.5.4. Recent Developments
- 11.2.5.5. Financials (Based on Availability)
- 11.2.6 Symborg
- 11.2.6.1. Overview
- 11.2.6.2. Products
- 11.2.6.3. SWOT Analysis
- 11.2.6.4. Recent Developments
- 11.2.6.5. Financials (Based on Availability)
- 11.2.7 ABiTEP
- 11.2.7.1. Overview
- 11.2.7.2. Products
- 11.2.7.3. SWOT Analysis
- 11.2.7.4. Recent Developments
- 11.2.7.5. Financials (Based on Availability)
- 11.2.8 IAB
- 11.2.8.1. Overview
- 11.2.8.2. Products
- 11.2.8.3. SWOT Analysis
- 11.2.8.4. Recent Developments
- 11.2.8.5. Financials (Based on Availability)
- 11.2.9 AGRO Bio
- 11.2.9.1. Overview
- 11.2.9.2. Products
- 11.2.9.3. SWOT Analysis
- 11.2.9.4. Recent Developments
- 11.2.9.5. Financials (Based on Availability)
- 11.2.10 BioPower
- 11.2.10.1. Overview
- 11.2.10.2. Products
- 11.2.10.3. SWOT Analysis
- 11.2.10.4. Recent Developments
- 11.2.10.5. Financials (Based on Availability)
- 11.2.11 Lantmannen Bioagri
- 11.2.11.1. Overview
- 11.2.11.2. Products
- 11.2.11.3. SWOT Analysis
- 11.2.11.4. Recent Developments
- 11.2.11.5. Financials (Based on Availability)
- 11.2.12 Mapleton Agri
- 11.2.12.1. Overview
- 11.2.12.2. Products
- 11.2.12.3. SWOT Analysis
- 11.2.12.4. Recent Developments
- 11.2.12.5. Financials (Based on Availability)
- 11.2.13 CCS Aosta
- 11.2.13.1. Overview
- 11.2.13.2. Products
- 11.2.13.3. SWOT Analysis
- 11.2.13.4. Recent Developments
- 11.2.13.5. Financials (Based on Availability)
- 11.2.14 Motivos Campestres
- 11.2.14.1. Overview
- 11.2.14.2. Products
- 11.2.14.3. SWOT Analysis
- 11.2.14.4. Recent Developments
- 11.2.14.5. Financials (Based on Availability)
- 11.2.15 Organica
- 11.2.15.1. Overview
- 11.2.15.2. Products
- 11.2.15.3. SWOT Analysis
- 11.2.15.4. Recent Developments
- 11.2.15.5. Financials (Based on Availability)
- 11.2.16 T. Stanes
- 11.2.16.1. Overview
- 11.2.16.2. Products
- 11.2.16.3. SWOT Analysis
- 11.2.16.4. Recent Developments
- 11.2.16.5. Financials (Based on Availability)
- 11.2.17 De Sangosse
- 11.2.17.1. Overview
- 11.2.17.2. Products
- 11.2.17.3. SWOT Analysis
- 11.2.17.4. Recent Developments
- 11.2.17.5. Financials (Based on Availability)
- 11.2.18 Greenmax Agrotech
- 11.2.18.1. Overview
- 11.2.18.2. Products
- 11.2.18.3. SWOT Analysis
- 11.2.18.4. Recent Developments
- 11.2.18.5. Financials (Based on Availability)
- 11.2.19 Biostadt
- 11.2.19.1. Overview
- 11.2.19.2. Products
- 11.2.19.3. SWOT Analysis
- 11.2.19.4. Recent Developments
- 11.2.19.5. Financials (Based on Availability)
- 11.2.20 Biotech International
- 11.2.20.1. Overview
- 11.2.20.2. Products
- 11.2.20.3. SWOT Analysis
- 11.2.20.4. Recent Developments
- 11.2.20.5. Financials (Based on Availability)
- 11.2.21 HCM Agro Produts
- 11.2.21.1. Overview
- 11.2.21.2. Products
- 11.2.21.3. SWOT Analysis
- 11.2.21.4. Recent Developments
- 11.2.21.5. Financials (Based on Availability)
- 11.2.22 Dhanuka
- 11.2.22.1. Overview
- 11.2.22.2. Products
- 11.2.22.3. SWOT Analysis
- 11.2.22.4. Recent Developments
- 11.2.22.5. Financials (Based on Availability)
- 11.2.23 PI Industries
- 11.2.23.1. Overview
- 11.2.23.2. Products
- 11.2.23.3. SWOT Analysis
- 11.2.23.4. Recent Developments
- 11.2.23.5. Financials (Based on Availability)
- 11.2.24 IPL Biologicals
- 11.2.24.1. Overview
- 11.2.24.2. Products
- 11.2.24.3. SWOT Analysis
- 11.2.24.4. Recent Developments
- 11.2.24.5. Financials (Based on Availability)
- 11.2.25 AMMS Century
- 11.2.25.1. Overview
- 11.2.25.2. Products
- 11.2.25.3. SWOT Analysis
- 11.2.25.4. Recent Developments
- 11.2.25.5. Financials (Based on Availability)
- 11.2.1 Ag Spectrum
List of Figures
- Figure 1: Global Non-microbial Biostimulants Revenue Breakdown (million, %) by Region 2024 & 2032
- Figure 2: Global Non-microbial Biostimulants Volume Breakdown (K, %) by Region 2024 & 2032
- Figure 3: North America Non-microbial Biostimulants Revenue (million), by Application 2024 & 2032
- Figure 4: North America Non-microbial Biostimulants Volume (K), by Application 2024 & 2032
- Figure 5: North America Non-microbial Biostimulants Revenue Share (%), by Application 2024 & 2032
- Figure 6: North America Non-microbial Biostimulants Volume Share (%), by Application 2024 & 2032
- Figure 7: North America Non-microbial Biostimulants Revenue (million), by Types 2024 & 2032
- Figure 8: North America Non-microbial Biostimulants Volume (K), by Types 2024 & 2032
- Figure 9: North America Non-microbial Biostimulants Revenue Share (%), by Types 2024 & 2032
- Figure 10: North America Non-microbial Biostimulants Volume Share (%), by Types 2024 & 2032
- Figure 11: North America Non-microbial Biostimulants Revenue (million), by Country 2024 & 2032
- Figure 12: North America Non-microbial Biostimulants Volume (K), by Country 2024 & 2032
- Figure 13: North America Non-microbial Biostimulants Revenue Share (%), by Country 2024 & 2032
- Figure 14: North America Non-microbial Biostimulants Volume Share (%), by Country 2024 & 2032
- Figure 15: South America Non-microbial Biostimulants Revenue (million), by Application 2024 & 2032
- Figure 16: South America Non-microbial Biostimulants Volume (K), by Application 2024 & 2032
- Figure 17: South America Non-microbial Biostimulants Revenue Share (%), by Application 2024 & 2032
- Figure 18: South America Non-microbial Biostimulants Volume Share (%), by Application 2024 & 2032
- Figure 19: South America Non-microbial Biostimulants Revenue (million), by Types 2024 & 2032
- Figure 20: South America Non-microbial Biostimulants Volume (K), by Types 2024 & 2032
- Figure 21: South America Non-microbial Biostimulants Revenue Share (%), by Types 2024 & 2032
- Figure 22: South America Non-microbial Biostimulants Volume Share (%), by Types 2024 & 2032
- Figure 23: South America Non-microbial Biostimulants Revenue (million), by Country 2024 & 2032
- Figure 24: South America Non-microbial Biostimulants Volume (K), by Country 2024 & 2032
- Figure 25: South America Non-microbial Biostimulants Revenue Share (%), by Country 2024 & 2032
- Figure 26: South America Non-microbial Biostimulants Volume Share (%), by Country 2024 & 2032
- Figure 27: Europe Non-microbial Biostimulants Revenue (million), by Application 2024 & 2032
- Figure 28: Europe Non-microbial Biostimulants Volume (K), by Application 2024 & 2032
- Figure 29: Europe Non-microbial Biostimulants Revenue Share (%), by Application 2024 & 2032
- Figure 30: Europe Non-microbial Biostimulants Volume Share (%), by Application 2024 & 2032
- Figure 31: Europe Non-microbial Biostimulants Revenue (million), by Types 2024 & 2032
- Figure 32: Europe Non-microbial Biostimulants Volume (K), by Types 2024 & 2032
- Figure 33: Europe Non-microbial Biostimulants Revenue Share (%), by Types 2024 & 2032
- Figure 34: Europe Non-microbial Biostimulants Volume Share (%), by Types 2024 & 2032
- Figure 35: Europe Non-microbial Biostimulants Revenue (million), by Country 2024 & 2032
- Figure 36: Europe Non-microbial Biostimulants Volume (K), by Country 2024 & 2032
- Figure 37: Europe Non-microbial Biostimulants Revenue Share (%), by Country 2024 & 2032
- Figure 38: Europe Non-microbial Biostimulants Volume Share (%), by Country 2024 & 2032
- Figure 39: Middle East & Africa Non-microbial Biostimulants Revenue (million), by Application 2024 & 2032
- Figure 40: Middle East & Africa Non-microbial Biostimulants Volume (K), by Application 2024 & 2032
- Figure 41: Middle East & Africa Non-microbial Biostimulants Revenue Share (%), by Application 2024 & 2032
- Figure 42: Middle East & Africa Non-microbial Biostimulants Volume Share (%), by Application 2024 & 2032
- Figure 43: Middle East & Africa Non-microbial Biostimulants Revenue (million), by Types 2024 & 2032
- Figure 44: Middle East & Africa Non-microbial Biostimulants Volume (K), by Types 2024 & 2032
- Figure 45: Middle East & Africa Non-microbial Biostimulants Revenue Share (%), by Types 2024 & 2032
- Figure 46: Middle East & Africa Non-microbial Biostimulants Volume Share (%), by Types 2024 & 2032
- Figure 47: Middle East & Africa Non-microbial Biostimulants Revenue (million), by Country 2024 & 2032
- Figure 48: Middle East & Africa Non-microbial Biostimulants Volume (K), by Country 2024 & 2032
- Figure 49: Middle East & Africa Non-microbial Biostimulants Revenue Share (%), by Country 2024 & 2032
- Figure 50: Middle East & Africa Non-microbial Biostimulants Volume Share (%), by Country 2024 & 2032
- Figure 51: Asia Pacific Non-microbial Biostimulants Revenue (million), by Application 2024 & 2032
- Figure 52: Asia Pacific Non-microbial Biostimulants Volume (K), by Application 2024 & 2032
- Figure 53: Asia Pacific Non-microbial Biostimulants Revenue Share (%), by Application 2024 & 2032
- Figure 54: Asia Pacific Non-microbial Biostimulants Volume Share (%), by Application 2024 & 2032
- Figure 55: Asia Pacific Non-microbial Biostimulants Revenue (million), by Types 2024 & 2032
- Figure 56: Asia Pacific Non-microbial Biostimulants Volume (K), by Types 2024 & 2032
- Figure 57: Asia Pacific Non-microbial Biostimulants Revenue Share (%), by Types 2024 & 2032
- Figure 58: Asia Pacific Non-microbial Biostimulants Volume Share (%), by Types 2024 & 2032
- Figure 59: Asia Pacific Non-microbial Biostimulants Revenue (million), by Country 2024 & 2032
- Figure 60: Asia Pacific Non-microbial Biostimulants Volume (K), by Country 2024 & 2032
- Figure 61: Asia Pacific Non-microbial Biostimulants Revenue Share (%), by Country 2024 & 2032
- Figure 62: Asia Pacific Non-microbial Biostimulants Volume Share (%), by Country 2024 & 2032
List of Tables
- Table 1: Global Non-microbial Biostimulants Revenue million Forecast, by Region 2019 & 2032
- Table 2: Global Non-microbial Biostimulants Volume K Forecast, by Region 2019 & 2032
- Table 3: Global Non-microbial Biostimulants Revenue million Forecast, by Application 2019 & 2032
- Table 4: Global Non-microbial Biostimulants Volume K Forecast, by Application 2019 & 2032
- Table 5: Global Non-microbial Biostimulants Revenue million Forecast, by Types 2019 & 2032
- Table 6: Global Non-microbial Biostimulants Volume K Forecast, by Types 2019 & 2032
- Table 7: Global Non-microbial Biostimulants Revenue million Forecast, by Region 2019 & 2032
- Table 8: Global Non-microbial Biostimulants Volume K Forecast, by Region 2019 & 2032
- Table 9: Global Non-microbial Biostimulants Revenue million Forecast, by Application 2019 & 2032
- Table 10: Global Non-microbial Biostimulants Volume K Forecast, by Application 2019 & 2032
- Table 11: Global Non-microbial Biostimulants Revenue million Forecast, by Types 2019 & 2032
- Table 12: Global Non-microbial Biostimulants Volume K Forecast, by Types 2019 & 2032
- Table 13: Global Non-microbial Biostimulants Revenue million Forecast, by Country 2019 & 2032
- Table 14: Global Non-microbial Biostimulants Volume K Forecast, by Country 2019 & 2032
- Table 15: United States Non-microbial Biostimulants Revenue (million) Forecast, by Application 2019 & 2032
- Table 16: United States Non-microbial Biostimulants Volume (K) Forecast, by Application 2019 & 2032
- Table 17: Canada Non-microbial Biostimulants Revenue (million) Forecast, by Application 2019 & 2032
- Table 18: Canada Non-microbial Biostimulants Volume (K) Forecast, by Application 2019 & 2032
- Table 19: Mexico Non-microbial Biostimulants Revenue (million) Forecast, by Application 2019 & 2032
- Table 20: Mexico Non-microbial Biostimulants Volume (K) Forecast, by Application 2019 & 2032
- Table 21: Global Non-microbial Biostimulants Revenue million Forecast, by Application 2019 & 2032
- Table 22: Global Non-microbial Biostimulants Volume K Forecast, by Application 2019 & 2032
- Table 23: Global Non-microbial Biostimulants Revenue million Forecast, by Types 2019 & 2032
- Table 24: Global Non-microbial Biostimulants Volume K Forecast, by Types 2019 & 2032
- Table 25: Global Non-microbial Biostimulants Revenue million Forecast, by Country 2019 & 2032
- Table 26: Global Non-microbial Biostimulants Volume K Forecast, by Country 2019 & 2032
- Table 27: Brazil Non-microbial Biostimulants Revenue (million) Forecast, by Application 2019 & 2032
- Table 28: Brazil Non-microbial Biostimulants Volume (K) Forecast, by Application 2019 & 2032
- Table 29: Argentina Non-microbial Biostimulants Revenue (million) Forecast, by Application 2019 & 2032
- Table 30: Argentina Non-microbial Biostimulants Volume (K) Forecast, by Application 2019 & 2032
- Table 31: Rest of South America Non-microbial Biostimulants Revenue (million) Forecast, by Application 2019 & 2032
- Table 32: Rest of South America Non-microbial Biostimulants Volume (K) Forecast, by Application 2019 & 2032
- Table 33: Global Non-microbial Biostimulants Revenue million Forecast, by Application 2019 & 2032
- Table 34: Global Non-microbial Biostimulants Volume K Forecast, by Application 2019 & 2032
- Table 35: Global Non-microbial Biostimulants Revenue million Forecast, by Types 2019 & 2032
- Table 36: Global Non-microbial Biostimulants Volume K Forecast, by Types 2019 & 2032
- Table 37: Global Non-microbial Biostimulants Revenue million Forecast, by Country 2019 & 2032
- Table 38: Global Non-microbial Biostimulants Volume K Forecast, by Country 2019 & 2032
- Table 39: United Kingdom Non-microbial Biostimulants Revenue (million) Forecast, by Application 2019 & 2032
- Table 40: United Kingdom Non-microbial Biostimulants Volume (K) Forecast, by Application 2019 & 2032
- Table 41: Germany Non-microbial Biostimulants Revenue (million) Forecast, by Application 2019 & 2032
- Table 42: Germany Non-microbial Biostimulants Volume (K) Forecast, by Application 2019 & 2032
- Table 43: France Non-microbial Biostimulants Revenue (million) Forecast, by Application 2019 & 2032
- Table 44: France Non-microbial Biostimulants Volume (K) Forecast, by Application 2019 & 2032
- Table 45: Italy Non-microbial Biostimulants Revenue (million) Forecast, by Application 2019 & 2032
- Table 46: Italy Non-microbial Biostimulants Volume (K) Forecast, by Application 2019 & 2032
- Table 47: Spain Non-microbial Biostimulants Revenue (million) Forecast, by Application 2019 & 2032
- Table 48: Spain Non-microbial Biostimulants Volume (K) Forecast, by Application 2019 & 2032
- Table 49: Russia Non-microbial Biostimulants Revenue (million) Forecast, by Application 2019 & 2032
- Table 50: Russia Non-microbial Biostimulants Volume (K) Forecast, by Application 2019 & 2032
- Table 51: Benelux Non-microbial Biostimulants Revenue (million) Forecast, by Application 2019 & 2032
- Table 52: Benelux Non-microbial Biostimulants Volume (K) Forecast, by Application 2019 & 2032
- Table 53: Nordics Non-microbial Biostimulants Revenue (million) Forecast, by Application 2019 & 2032
- Table 54: Nordics Non-microbial Biostimulants Volume (K) Forecast, by Application 2019 & 2032
- Table 55: Rest of Europe Non-microbial Biostimulants Revenue (million) Forecast, by Application 2019 & 2032
- Table 56: Rest of Europe Non-microbial Biostimulants Volume (K) Forecast, by Application 2019 & 2032
- Table 57: Global Non-microbial Biostimulants Revenue million Forecast, by Application 2019 & 2032
- Table 58: Global Non-microbial Biostimulants Volume K Forecast, by Application 2019 & 2032
- Table 59: Global Non-microbial Biostimulants Revenue million Forecast, by Types 2019 & 2032
- Table 60: Global Non-microbial Biostimulants Volume K Forecast, by Types 2019 & 2032
- Table 61: Global Non-microbial Biostimulants Revenue million Forecast, by Country 2019 & 2032
- Table 62: Global Non-microbial Biostimulants Volume K Forecast, by Country 2019 & 2032
- Table 63: Turkey Non-microbial Biostimulants Revenue (million) Forecast, by Application 2019 & 2032
- Table 64: Turkey Non-microbial Biostimulants Volume (K) Forecast, by Application 2019 & 2032
- Table 65: Israel Non-microbial Biostimulants Revenue (million) Forecast, by Application 2019 & 2032
- Table 66: Israel Non-microbial Biostimulants Volume (K) Forecast, by Application 2019 & 2032
- Table 67: GCC Non-microbial Biostimulants Revenue (million) Forecast, by Application 2019 & 2032
- Table 68: GCC Non-microbial Biostimulants Volume (K) Forecast, by Application 2019 & 2032
- Table 69: North Africa Non-microbial Biostimulants Revenue (million) Forecast, by Application 2019 & 2032
- Table 70: North Africa Non-microbial Biostimulants Volume (K) Forecast, by Application 2019 & 2032
- Table 71: South Africa Non-microbial Biostimulants Revenue (million) Forecast, by Application 2019 & 2032
- Table 72: South Africa Non-microbial Biostimulants Volume (K) Forecast, by Application 2019 & 2032
- Table 73: Rest of Middle East & Africa Non-microbial Biostimulants Revenue (million) Forecast, by Application 2019 & 2032
- Table 74: Rest of Middle East & Africa Non-microbial Biostimulants Volume (K) Forecast, by Application 2019 & 2032
- Table 75: Global Non-microbial Biostimulants Revenue million Forecast, by Application 2019 & 2032
- Table 76: Global Non-microbial Biostimulants Volume K Forecast, by Application 2019 & 2032
- Table 77: Global Non-microbial Biostimulants Revenue million Forecast, by Types 2019 & 2032
- Table 78: Global Non-microbial Biostimulants Volume K Forecast, by Types 2019 & 2032
- Table 79: Global Non-microbial Biostimulants Revenue million Forecast, by Country 2019 & 2032
- Table 80: Global Non-microbial Biostimulants Volume K Forecast, by Country 2019 & 2032
- Table 81: China Non-microbial Biostimulants Revenue (million) Forecast, by Application 2019 & 2032
- Table 82: China Non-microbial Biostimulants Volume (K) Forecast, by Application 2019 & 2032
- Table 83: India Non-microbial Biostimulants Revenue (million) Forecast, by Application 2019 & 2032
- Table 84: India Non-microbial Biostimulants Volume (K) Forecast, by Application 2019 & 2032
- Table 85: Japan Non-microbial Biostimulants Revenue (million) Forecast, by Application 2019 & 2032
- Table 86: Japan Non-microbial Biostimulants Volume (K) Forecast, by Application 2019 & 2032
- Table 87: South Korea Non-microbial Biostimulants Revenue (million) Forecast, by Application 2019 & 2032
- Table 88: South Korea Non-microbial Biostimulants Volume (K) Forecast, by Application 2019 & 2032
- Table 89: ASEAN Non-microbial Biostimulants Revenue (million) Forecast, by Application 2019 & 2032
- Table 90: ASEAN Non-microbial Biostimulants Volume (K) Forecast, by Application 2019 & 2032
- Table 91: Oceania Non-microbial Biostimulants Revenue (million) Forecast, by Application 2019 & 2032
- Table 92: Oceania Non-microbial Biostimulants Volume (K) Forecast, by Application 2019 & 2032
- Table 93: Rest of Asia Pacific Non-microbial Biostimulants Revenue (million) Forecast, by Application 2019 & 2032
- Table 94: Rest of Asia Pacific Non-microbial Biostimulants Volume (K) Forecast, by Application 2019 & 2032
Frequently Asked Questions
1. What is the projected Compound Annual Growth Rate (CAGR) of the Non-microbial Biostimulants?
The projected CAGR is approximately XX%.
2. Which companies are prominent players in the Non-microbial Biostimulants?
Key companies in the market include Ag Spectrum, Biomax, EVL Inc., IFB Ltd., Concentric Ag, Symborg, ABiTEP, IAB, AGRO Bio, BioPower, Lantmannen Bioagri, Mapleton Agri, CCS Aosta, Motivos Campestres, Organica, T. Stanes, De Sangosse, Greenmax Agrotech, Biostadt, Biotech International, HCM Agro Produts, Dhanuka, PI Industries, IPL Biologicals, AMMS Century.
3. What are the main segments of the Non-microbial Biostimulants?
The market segments include Application, Types.
4. Can you provide details about the market size?
The market size is estimated to be USD XXX million as of 2022.
5. What are some drivers contributing to market growth?
N/A
6. What are the notable trends driving market growth?
N/A
7. Are there any restraints impacting market growth?
N/A
8. Can you provide examples of recent developments in the market?
N/A
9. What pricing options are available for accessing the report?
Pricing options include single-user, multi-user, and enterprise licenses priced at USD 4350.00, USD 6525.00, and USD 8700.00 respectively.
10. Is the market size provided in terms of value or volume?
The market size is provided in terms of value, measured in million and volume, measured in K.
11. Are there any specific market keywords associated with the report?
Yes, the market keyword associated with the report is "Non-microbial Biostimulants," which aids in identifying and referencing the specific market segment covered.
12. How do I determine which pricing option suits my needs best?
The pricing options vary based on user requirements and access needs. Individual users may opt for single-user licenses, while businesses requiring broader access may choose multi-user or enterprise licenses for cost-effective access to the report.
13. Are there any additional resources or data provided in the Non-microbial Biostimulants report?
While the report offers comprehensive insights, it's advisable to review the specific contents or supplementary materials provided to ascertain if additional resources or data are available.
14. How can I stay updated on further developments or reports in the Non-microbial Biostimulants?
To stay informed about further developments, trends, and reports in the Non-microbial Biostimulants, consider subscribing to industry newsletters, following relevant companies and organizations, or regularly checking reputable industry news sources and publications.
Methodology
Step 1 - Identification of Relevant Samples Size from Population Database


Step 2 - Approaches for Defining Global Market Size (Value, Volume* & Price*)

Note*: In applicable scenarios
Step 3 - Data Sources
Primary Research
- Web Analytics
- Survey Reports
- Research Institute
- Latest Research Reports
- Opinion Leaders
Secondary Research
- Annual Reports
- White Paper
- Latest Press Release
- Industry Association
- Paid Database
- Investor Presentations

Step 4 - Data Triangulation
Involves using different sources of information in order to increase the validity of a study
These sources are likely to be stakeholders in a program - participants, other researchers, program staff, other community members, and so on.
Then we put all data in single framework & apply various statistical tools to find out the dynamic on the market.
During the analysis stage, feedback from the stakeholder groups would be compared to determine areas of agreement as well as areas of divergence


