
Key Insights
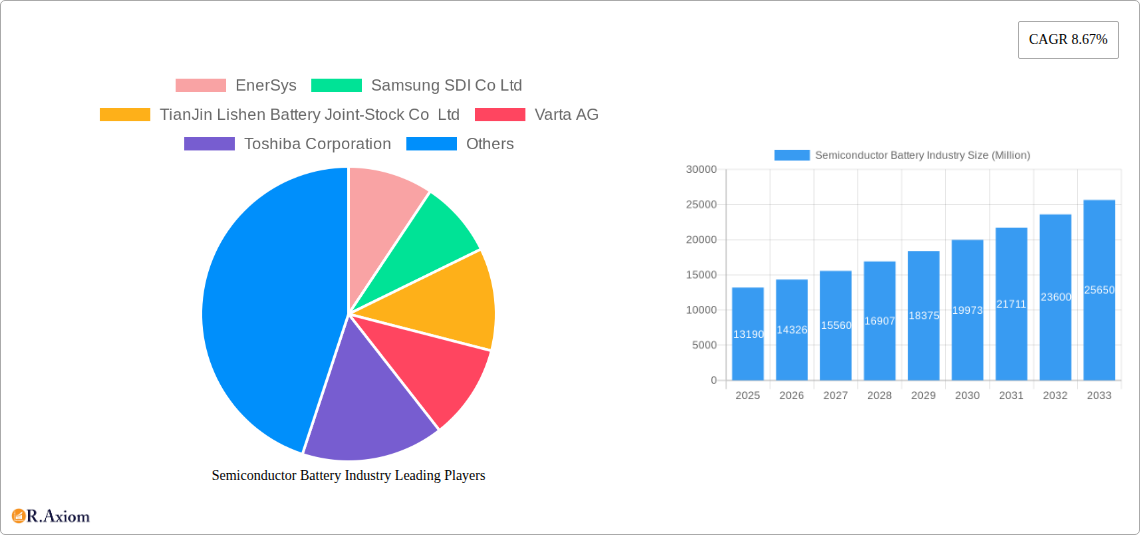
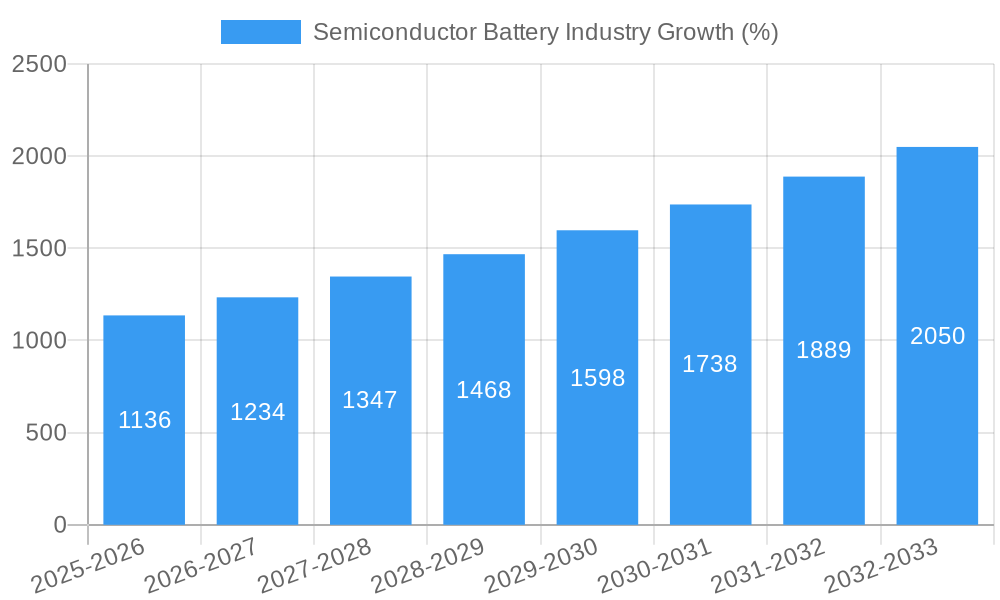
The global semiconductor battery market, valued at $13.19 billion in 2025, is projected to experience robust growth, driven by the increasing demand for energy storage solutions across diverse sectors. A compound annual growth rate (CAGR) of 8.67% from 2025 to 2033 indicates a significant expansion of the market, reaching an estimated $26.4 billion by 2033. This growth is fueled by several key factors. The proliferation of electric vehicles (EVs) and the expansion of renewable energy sources like solar and wind power are major drivers, creating a substantial need for efficient and reliable energy storage. Furthermore, advancements in battery technology, particularly in lithium-ion polymer and sodium-ion batteries, are enhancing energy density, lifespan, and safety, thereby boosting market adoption. The increasing demand for portable consumer electronics, coupled with the development of grid-scale energy storage systems, further contributes to market expansion. While challenges remain, such as the cost of raw materials and the environmental impact of battery production, ongoing technological innovations and government support for green initiatives are expected to mitigate these restraints. The market is segmented by battery type (Lithium-ion, Nickel-Metal Hydride, Lithium-ion Polymer, Sodium-ion) and end-user application (Consumer Electronics, Electric Vehicles, Energy Storage Systems, Other), offering diverse growth opportunities for companies like EnerSys, Samsung SDI, and Panasonic. Regional analysis reveals strong growth potential across North America, Europe, and Asia-Pacific, with China and the United States emerging as key markets.
The competitive landscape is marked by both established players and emerging companies focusing on innovation and cost optimization. Strategic partnerships, mergers, and acquisitions are expected to shape the market dynamics further. The ongoing research and development efforts focused on improving battery performance, safety, and sustainability will be crucial in determining future market growth trajectory. While the current dominance of Lithium-ion batteries is undeniable, the emergence of alternative technologies like Sodium-ion batteries presents exciting possibilities for cost-effective and sustainable energy storage solutions in the coming years. The continued integration of smart grid technologies and the growing adoption of energy management systems will further accelerate market growth and create new opportunities for semiconductor battery manufacturers. This dynamic market presents significant investment potential and underscores the importance of technological advancements and sustainable practices within the semiconductor battery industry.
Semiconductor Battery Industry: A Comprehensive Market Report (2019-2033)
This detailed report provides a comprehensive analysis of the Semiconductor Battery Industry, covering market size, segmentation, growth drivers, challenges, key players, and future outlook. The study period spans from 2019 to 2033, with 2025 serving as the base and estimated year. The report leverages extensive primary and secondary research to offer actionable insights for industry stakeholders, investors, and strategic decision-makers. The global market value is projected to reach xx Million by 2033.
Semiconductor Battery Industry Market Concentration & Innovation
This section analyzes the competitive landscape of the semiconductor battery market, encompassing market concentration, innovation drivers, regulatory influence, product substitution, end-user trends, and merger & acquisition (M&A) activities. The market is characterized by a moderately concentrated structure, with a few major players holding significant market share. However, the emergence of new technologies and entrants is increasing competition.
- Market Share: Top 5 players hold approximately xx% of the global market share in 2025, with EnerSys, Samsung SDI Co Ltd, and Panasonic Corporation being prominent examples.
- Innovation Drivers: Growing demand for energy-efficient devices across various end-user applications, coupled with advancements in battery technology, are major innovation drivers. Miniaturization, improved energy density, and enhanced safety features are key areas of focus.
- Regulatory Frameworks: Government regulations related to environmental protection and battery safety standards significantly influence market dynamics and product development. Stringent emission norms are particularly driving the demand for high-efficiency semiconductor batteries.
- Product Substitutes: Competition arises from alternative energy storage solutions, such as supercapacitors and fuel cells, but semiconductor batteries maintain a competitive edge in specific niches due to their high energy density and power output in certain applications.
- End-User Trends: The rising adoption of consumer electronics, electric vehicles (EVs), and energy storage systems (ESS) is driving the market's expansion. The growing popularity of IoT devices is also creating new opportunities.
- M&A Activities: The semiconductor battery industry has witnessed several M&A deals in recent years, with deal values averaging xx Million in the past five years. These activities reflect the industry's consolidation trend and quest for technological advancements.
Semiconductor Battery Industry Industry Trends & Insights
This section delves into the key trends and insights shaping the semiconductor battery market. The market exhibits significant growth potential, driven by several factors:
The global semiconductor battery market is projected to register a Compound Annual Growth Rate (CAGR) of xx% during the forecast period (2025-2033). Market penetration is expected to increase significantly, particularly in the electric vehicle and energy storage sectors. Technological disruptions, such as the development of solid-state batteries and advancements in materials science, are reshaping the industry. Consumer preferences increasingly favor high-performance, environmentally friendly, and cost-effective battery solutions. Competitive dynamics are marked by intense R&D efforts, strategic partnerships, and aggressive marketing strategies amongst market players.
Dominant Markets & Segments in Semiconductor Battery Industry
This section highlights the dominant regions, countries, and market segments within the semiconductor battery industry.
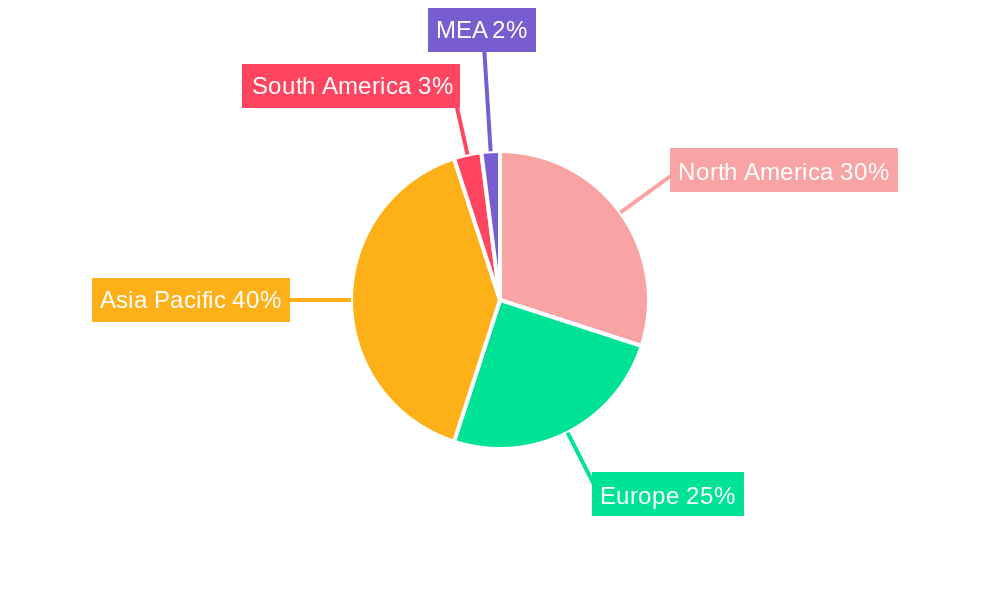
Dominant Regions: Asia-Pacific is currently the leading region, driven by substantial demand from the consumer electronics and electric vehicle sectors in China, Japan, and South Korea. North America and Europe are also significant markets, owing to increasing investments in renewable energy and the growing adoption of EVs.
Dominant Segments:
Type: Lithium-ion batteries dominate the market, accounting for xx% of the total market share in 2025, owing to their superior energy density and performance. However, sodium-ion batteries are emerging as a cost-effective alternative, with potential for significant growth in the future. Nickel-metal hydride and lithium-ion polymer batteries maintain niche applications.
End-User Application: The electric vehicle segment is projected to be the fastest-growing end-user application, driven by the global shift towards electric mobility. Energy storage systems and consumer electronics also represent significant market segments, with steady growth rates.
Key Drivers:
- Asia-Pacific: Strong government support for electric vehicle adoption, robust manufacturing capabilities, and the presence of major battery manufacturers.
- North America: Growing investments in renewable energy infrastructure, stringent emission regulations, and rising demand for energy storage solutions.
- Europe: Stringent environmental regulations, supportive government policies promoting electric vehicles, and a focus on sustainable energy solutions.
Semiconductor Battery Industry Product Developments
Recent product innovations focus on enhancing energy density, improving safety features, and extending battery lifespan. Advancements in materials science, such as the use of advanced cathode materials and solid-state electrolytes, are driving significant improvements in battery performance. These innovations directly address market demands for higher energy efficiency, faster charging times, and longer operational lifespans, translating into a strong market fit for both consumer and industrial applications.
Report Scope & Segmentation Analysis
This report segments the semiconductor battery market based on battery type (Lithium-Ion, Nickel-Metal Hydride, Lithium-Ion Polymer, Sodium-Ion Battery) and end-user application (Consumer Electronics, Electric Vehicles, Energy Storage System, Other End-User Applications). Each segment's growth projections, market size, and competitive dynamics are thoroughly analyzed, providing a detailed overview of the market's structure and evolution. For instance, the Lithium-ion battery segment is expected to maintain a significant market share due to its established technology and performance advantages, while the sodium-ion battery segment is poised for rapid growth due to its cost-effectiveness.
Key Drivers of Semiconductor Battery Industry Growth
Technological advancements in battery chemistry, materials science, and manufacturing processes are driving the market. Economic factors, such as government subsidies and incentives for electric vehicles and renewable energy adoption, further stimulate growth. Stringent environmental regulations globally are also playing a key role in driving the demand for cleaner energy solutions.
Challenges in the Semiconductor Battery Industry Sector
The semiconductor battery industry faces challenges such as the high cost of raw materials, particularly lithium and cobalt, which impact overall production costs. Supply chain complexities and geopolitical factors also influence market stability. Furthermore, intense competition among established players and the emergence of new entrants increase pressure on margins and profitability. These factors contribute to a complex market environment that impacts overall industry growth.
Emerging Opportunities in Semiconductor Battery Industry
Emerging opportunities include the development of next-generation battery technologies, such as solid-state batteries and all-solid-state batteries, that offer improved safety, energy density, and lifespan. The expanding adoption of electric vehicles and renewable energy infrastructure presents a significant growth opportunity for semiconductor battery manufacturers. Furthermore, the increasing demand for energy storage solutions for grid-scale applications and microgrids opens up a new market segment for high-capacity, long-duration batteries.
Leading Players in the Semiconductor Battery Industry Market
- EnerSys
- Samsung SDI Co Ltd
- TianJin Lishen Battery Joint-Stock Co Ltd
- Varta AG
- Toshiba Corporation
- Faradion Limited
- GS Yuasa Corporation
- Routejade
- Panasonic Corporation
- Sony Corporation
Key Developments in Semiconductor Battery Industry Industry
- February 2022: ROHM Semiconductor launched the REFLVBMS001-EVK-001 evaluation board for ultra-efficient semiconductor battery operations in IoT devices. This development highlights the growing importance of energy-efficient solutions in the burgeoning IoT sector.
- February 2022: Solus Advanced Materials announced plans to expand into semiconductor battery and battery foil production. This diversification strategy indicates the increasing attractiveness and growth potential within the semiconductor battery sector.
Strategic Outlook for Semiconductor Battery Industry Market
The semiconductor battery market holds substantial growth potential driven by technological advancements, supportive government policies, and the growing demand for cleaner energy solutions. Further market expansion is anticipated through the development of innovative battery chemistries, improved manufacturing processes, and expanding applications across various sectors. The integration of artificial intelligence and advanced analytics in battery management systems will also play a critical role in enhancing performance and lifespan.
Semiconductor Battery Industry Segmentation
-
1. Type
- 1.1. Lithium-Ion
- 1.2. Nickel-Metal Hydride
- 1.3. Lithium-Ion Polymer
- 1.4. Sodium-Ion Battery
-
2. End-User Application
- 2.1. Consumer Electronics
- 2.2. Electric Vehicles
- 2.3. Energy Storage System
- 2.4. Other End-User Applications
Semiconductor Battery Industry Segmentation By Geography
-
1. North America
- 1.1. United States
- 1.2. Canada
- 1.3. Rest of North America
-
2. Asia Pacific
- 2.1. China
- 2.2. India
- 2.3. Japan
- 2.4. South Korea
- 2.5. Rest of Asia Pacific
-
3. Europe
- 3.1. Germany
- 3.2. United Kingdom
- 3.3. France
- 3.4. Italy
- 3.5. Rest of Europe
-
4. South America
- 4.1. Chile
- 4.2. Brazil
- 4.3. Argentina
- 4.4. Rest of South America
-
5. Middle East and Africa
- 5.1. Saudi Arabia
- 5.2. United Arab Emirates
- 5.3. South Africa
- 5.4. Egypt
- 5.5. Rest of Middle East and Africa
Semiconductor Battery Industry REPORT HIGHLIGHTS
| Aspects | Details |
|---|---|
| Study Period | 2019-2033 |
| Base Year | 2024 |
| Estimated Year | 2025 |
| Forecast Period | 2025-2033 |
| Historical Period | 2019-2024 |
| Growth Rate | CAGR of 8.67% from 2019-2033 |
| Segmentation |
|
Table of Contents
- 1. Introduction
- 1.1. Research Scope
- 1.2. Market Segmentation
- 1.3. Research Methodology
- 1.4. Definitions and Assumptions
- 2. Executive Summary
- 2.1. Introduction
- 3. Market Dynamics
- 3.1. Introduction
- 3.2. Market Drivers
- 3.2.1. 4.; Increasing Demand for Mobile Devices4.; Rising Adaption of Electric Vehicles
- 3.3. Market Restrains
- 3.3.1. 4.; Availability of Technical Challenges
- 3.4. Market Trends
- 3.4.1. The Electric Vehicle Segment is Expected to Witness Significant Demand
- 4. Market Factor Analysis
- 4.1. Porters Five Forces
- 4.2. Supply/Value Chain
- 4.3. PESTEL analysis
- 4.4. Market Entropy
- 4.5. Patent/Trademark Analysis
- 5. Global Semiconductor Battery Industry Analysis, Insights and Forecast, 2019-2031
- 5.1. Market Analysis, Insights and Forecast - by Type
- 5.1.1. Lithium-Ion
- 5.1.2. Nickel-Metal Hydride
- 5.1.3. Lithium-Ion Polymer
- 5.1.4. Sodium-Ion Battery
- 5.2. Market Analysis, Insights and Forecast - by End-User Application
- 5.2.1. Consumer Electronics
- 5.2.2. Electric Vehicles
- 5.2.3. Energy Storage System
- 5.2.4. Other End-User Applications
- 5.3. Market Analysis, Insights and Forecast - by Region
- 5.3.1. North America
- 5.3.2. Asia Pacific
- 5.3.3. Europe
- 5.3.4. South America
- 5.3.5. Middle East and Africa
- 5.1. Market Analysis, Insights and Forecast - by Type
- 6. North America Semiconductor Battery Industry Analysis, Insights and Forecast, 2019-2031
- 6.1. Market Analysis, Insights and Forecast - by Type
- 6.1.1. Lithium-Ion
- 6.1.2. Nickel-Metal Hydride
- 6.1.3. Lithium-Ion Polymer
- 6.1.4. Sodium-Ion Battery
- 6.2. Market Analysis, Insights and Forecast - by End-User Application
- 6.2.1. Consumer Electronics
- 6.2.2. Electric Vehicles
- 6.2.3. Energy Storage System
- 6.2.4. Other End-User Applications
- 6.1. Market Analysis, Insights and Forecast - by Type
- 7. Asia Pacific Semiconductor Battery Industry Analysis, Insights and Forecast, 2019-2031
- 7.1. Market Analysis, Insights and Forecast - by Type
- 7.1.1. Lithium-Ion
- 7.1.2. Nickel-Metal Hydride
- 7.1.3. Lithium-Ion Polymer
- 7.1.4. Sodium-Ion Battery
- 7.2. Market Analysis, Insights and Forecast - by End-User Application
- 7.2.1. Consumer Electronics
- 7.2.2. Electric Vehicles
- 7.2.3. Energy Storage System
- 7.2.4. Other End-User Applications
- 7.1. Market Analysis, Insights and Forecast - by Type
- 8. Europe Semiconductor Battery Industry Analysis, Insights and Forecast, 2019-2031
- 8.1. Market Analysis, Insights and Forecast - by Type
- 8.1.1. Lithium-Ion
- 8.1.2. Nickel-Metal Hydride
- 8.1.3. Lithium-Ion Polymer
- 8.1.4. Sodium-Ion Battery
- 8.2. Market Analysis, Insights and Forecast - by End-User Application
- 8.2.1. Consumer Electronics
- 8.2.2. Electric Vehicles
- 8.2.3. Energy Storage System
- 8.2.4. Other End-User Applications
- 8.1. Market Analysis, Insights and Forecast - by Type
- 9. South America Semiconductor Battery Industry Analysis, Insights and Forecast, 2019-2031
- 9.1. Market Analysis, Insights and Forecast - by Type
- 9.1.1. Lithium-Ion
- 9.1.2. Nickel-Metal Hydride
- 9.1.3. Lithium-Ion Polymer
- 9.1.4. Sodium-Ion Battery
- 9.2. Market Analysis, Insights and Forecast - by End-User Application
- 9.2.1. Consumer Electronics
- 9.2.2. Electric Vehicles
- 9.2.3. Energy Storage System
- 9.2.4. Other End-User Applications
- 9.1. Market Analysis, Insights and Forecast - by Type
- 10. Middle East and Africa Semiconductor Battery Industry Analysis, Insights and Forecast, 2019-2031
- 10.1. Market Analysis, Insights and Forecast - by Type
- 10.1.1. Lithium-Ion
- 10.1.2. Nickel-Metal Hydride
- 10.1.3. Lithium-Ion Polymer
- 10.1.4. Sodium-Ion Battery
- 10.2. Market Analysis, Insights and Forecast - by End-User Application
- 10.2.1. Consumer Electronics
- 10.2.2. Electric Vehicles
- 10.2.3. Energy Storage System
- 10.2.4. Other End-User Applications
- 10.1. Market Analysis, Insights and Forecast - by Type
- 11. North America Semiconductor Battery Industry Analysis, Insights and Forecast, 2019-2031
- 11.1. Market Analysis, Insights and Forecast - By Country/Sub-region
- 11.1.1 United States
- 11.1.2 Canada
- 11.1.3 Mexico
- 12. Europe Semiconductor Battery Industry Analysis, Insights and Forecast, 2019-2031
- 12.1. Market Analysis, Insights and Forecast - By Country/Sub-region
- 12.1.1 Germany
- 12.1.2 United Kingdom
- 12.1.3 France
- 12.1.4 Spain
- 12.1.5 Italy
- 12.1.6 Spain
- 12.1.7 Belgium
- 12.1.8 Netherland
- 12.1.9 Nordics
- 12.1.10 Rest of Europe
- 13. Asia Pacific Semiconductor Battery Industry Analysis, Insights and Forecast, 2019-2031
- 13.1. Market Analysis, Insights and Forecast - By Country/Sub-region
- 13.1.1 China
- 13.1.2 Japan
- 13.1.3 India
- 13.1.4 South Korea
- 13.1.5 Southeast Asia
- 13.1.6 Australia
- 13.1.7 Indonesia
- 13.1.8 Phillipes
- 13.1.9 Singapore
- 13.1.10 Thailandc
- 13.1.11 Rest of Asia Pacific
- 14. South America Semiconductor Battery Industry Analysis, Insights and Forecast, 2019-2031
- 14.1. Market Analysis, Insights and Forecast - By Country/Sub-region
- 14.1.1 Brazil
- 14.1.2 Argentina
- 14.1.3 Peru
- 14.1.4 Chile
- 14.1.5 Colombia
- 14.1.6 Ecuador
- 14.1.7 Venezuela
- 14.1.8 Rest of South America
- 15. MEA Semiconductor Battery Industry Analysis, Insights and Forecast, 2019-2031
- 15.1. Market Analysis, Insights and Forecast - By Country/Sub-region
- 15.1.1 United Arab Emirates
- 15.1.2 Saudi Arabia
- 15.1.3 South Africa
- 15.1.4 Rest of Middle East and Africa
- 16. Competitive Analysis
- 16.1. Global Market Share Analysis 2024
- 16.2. Company Profiles
- 16.2.1 EnerSys
- 16.2.1.1. Overview
- 16.2.1.2. Products
- 16.2.1.3. SWOT Analysis
- 16.2.1.4. Recent Developments
- 16.2.1.5. Financials (Based on Availability)
- 16.2.2 Samsung SDI Co Ltd
- 16.2.2.1. Overview
- 16.2.2.2. Products
- 16.2.2.3. SWOT Analysis
- 16.2.2.4. Recent Developments
- 16.2.2.5. Financials (Based on Availability)
- 16.2.3 TianJin Lishen Battery Joint-Stock Co Ltd
- 16.2.3.1. Overview
- 16.2.3.2. Products
- 16.2.3.3. SWOT Analysis
- 16.2.3.4. Recent Developments
- 16.2.3.5. Financials (Based on Availability)
- 16.2.4 Varta AG
- 16.2.4.1. Overview
- 16.2.4.2. Products
- 16.2.4.3. SWOT Analysis
- 16.2.4.4. Recent Developments
- 16.2.4.5. Financials (Based on Availability)
- 16.2.5 Toshiba Corporation
- 16.2.5.1. Overview
- 16.2.5.2. Products
- 16.2.5.3. SWOT Analysis
- 16.2.5.4. Recent Developments
- 16.2.5.5. Financials (Based on Availability)
- 16.2.6 Faradion Limited
- 16.2.6.1. Overview
- 16.2.6.2. Products
- 16.2.6.3. SWOT Analysis
- 16.2.6.4. Recent Developments
- 16.2.6.5. Financials (Based on Availability)
- 16.2.7 GS Yuasa Corporation
- 16.2.7.1. Overview
- 16.2.7.2. Products
- 16.2.7.3. SWOT Analysis
- 16.2.7.4. Recent Developments
- 16.2.7.5. Financials (Based on Availability)
- 16.2.8 Routejade
- 16.2.8.1. Overview
- 16.2.8.2. Products
- 16.2.8.3. SWOT Analysis
- 16.2.8.4. Recent Developments
- 16.2.8.5. Financials (Based on Availability)
- 16.2.9 Panasonic Corporation
- 16.2.9.1. Overview
- 16.2.9.2. Products
- 16.2.9.3. SWOT Analysis
- 16.2.9.4. Recent Developments
- 16.2.9.5. Financials (Based on Availability)
- 16.2.10 Sony Corporation
- 16.2.10.1. Overview
- 16.2.10.2. Products
- 16.2.10.3. SWOT Analysis
- 16.2.10.4. Recent Developments
- 16.2.10.5. Financials (Based on Availability)
- 16.2.1 EnerSys
List of Figures
- Figure 1: Global Semiconductor Battery Industry Revenue Breakdown (Million, %) by Region 2024 & 2032
- Figure 2: Global Semiconductor Battery Industry Volume Breakdown (K Unit, %) by Region 2024 & 2032
- Figure 3: North America Semiconductor Battery Industry Revenue (Million), by Country 2024 & 2032
- Figure 4: North America Semiconductor Battery Industry Volume (K Unit), by Country 2024 & 2032
- Figure 5: North America Semiconductor Battery Industry Revenue Share (%), by Country 2024 & 2032
- Figure 6: North America Semiconductor Battery Industry Volume Share (%), by Country 2024 & 2032
- Figure 7: Europe Semiconductor Battery Industry Revenue (Million), by Country 2024 & 2032
- Figure 8: Europe Semiconductor Battery Industry Volume (K Unit), by Country 2024 & 2032
- Figure 9: Europe Semiconductor Battery Industry Revenue Share (%), by Country 2024 & 2032
- Figure 10: Europe Semiconductor Battery Industry Volume Share (%), by Country 2024 & 2032
- Figure 11: Asia Pacific Semiconductor Battery Industry Revenue (Million), by Country 2024 & 2032
- Figure 12: Asia Pacific Semiconductor Battery Industry Volume (K Unit), by Country 2024 & 2032
- Figure 13: Asia Pacific Semiconductor Battery Industry Revenue Share (%), by Country 2024 & 2032
- Figure 14: Asia Pacific Semiconductor Battery Industry Volume Share (%), by Country 2024 & 2032
- Figure 15: South America Semiconductor Battery Industry Revenue (Million), by Country 2024 & 2032
- Figure 16: South America Semiconductor Battery Industry Volume (K Unit), by Country 2024 & 2032
- Figure 17: South America Semiconductor Battery Industry Revenue Share (%), by Country 2024 & 2032
- Figure 18: South America Semiconductor Battery Industry Volume Share (%), by Country 2024 & 2032
- Figure 19: MEA Semiconductor Battery Industry Revenue (Million), by Country 2024 & 2032
- Figure 20: MEA Semiconductor Battery Industry Volume (K Unit), by Country 2024 & 2032
- Figure 21: MEA Semiconductor Battery Industry Revenue Share (%), by Country 2024 & 2032
- Figure 22: MEA Semiconductor Battery Industry Volume Share (%), by Country 2024 & 2032
- Figure 23: North America Semiconductor Battery Industry Revenue (Million), by Type 2024 & 2032
- Figure 24: North America Semiconductor Battery Industry Volume (K Unit), by Type 2024 & 2032
- Figure 25: North America Semiconductor Battery Industry Revenue Share (%), by Type 2024 & 2032
- Figure 26: North America Semiconductor Battery Industry Volume Share (%), by Type 2024 & 2032
- Figure 27: North America Semiconductor Battery Industry Revenue (Million), by End-User Application 2024 & 2032
- Figure 28: North America Semiconductor Battery Industry Volume (K Unit), by End-User Application 2024 & 2032
- Figure 29: North America Semiconductor Battery Industry Revenue Share (%), by End-User Application 2024 & 2032
- Figure 30: North America Semiconductor Battery Industry Volume Share (%), by End-User Application 2024 & 2032
- Figure 31: North America Semiconductor Battery Industry Revenue (Million), by Country 2024 & 2032
- Figure 32: North America Semiconductor Battery Industry Volume (K Unit), by Country 2024 & 2032
- Figure 33: North America Semiconductor Battery Industry Revenue Share (%), by Country 2024 & 2032
- Figure 34: North America Semiconductor Battery Industry Volume Share (%), by Country 2024 & 2032
- Figure 35: Asia Pacific Semiconductor Battery Industry Revenue (Million), by Type 2024 & 2032
- Figure 36: Asia Pacific Semiconductor Battery Industry Volume (K Unit), by Type 2024 & 2032
- Figure 37: Asia Pacific Semiconductor Battery Industry Revenue Share (%), by Type 2024 & 2032
- Figure 38: Asia Pacific Semiconductor Battery Industry Volume Share (%), by Type 2024 & 2032
- Figure 39: Asia Pacific Semiconductor Battery Industry Revenue (Million), by End-User Application 2024 & 2032
- Figure 40: Asia Pacific Semiconductor Battery Industry Volume (K Unit), by End-User Application 2024 & 2032
- Figure 41: Asia Pacific Semiconductor Battery Industry Revenue Share (%), by End-User Application 2024 & 2032
- Figure 42: Asia Pacific Semiconductor Battery Industry Volume Share (%), by End-User Application 2024 & 2032
- Figure 43: Asia Pacific Semiconductor Battery Industry Revenue (Million), by Country 2024 & 2032
- Figure 44: Asia Pacific Semiconductor Battery Industry Volume (K Unit), by Country 2024 & 2032
- Figure 45: Asia Pacific Semiconductor Battery Industry Revenue Share (%), by Country 2024 & 2032
- Figure 46: Asia Pacific Semiconductor Battery Industry Volume Share (%), by Country 2024 & 2032
- Figure 47: Europe Semiconductor Battery Industry Revenue (Million), by Type 2024 & 2032
- Figure 48: Europe Semiconductor Battery Industry Volume (K Unit), by Type 2024 & 2032
- Figure 49: Europe Semiconductor Battery Industry Revenue Share (%), by Type 2024 & 2032
- Figure 50: Europe Semiconductor Battery Industry Volume Share (%), by Type 2024 & 2032
- Figure 51: Europe Semiconductor Battery Industry Revenue (Million), by End-User Application 2024 & 2032
- Figure 52: Europe Semiconductor Battery Industry Volume (K Unit), by End-User Application 2024 & 2032
- Figure 53: Europe Semiconductor Battery Industry Revenue Share (%), by End-User Application 2024 & 2032
- Figure 54: Europe Semiconductor Battery Industry Volume Share (%), by End-User Application 2024 & 2032
- Figure 55: Europe Semiconductor Battery Industry Revenue (Million), by Country 2024 & 2032
- Figure 56: Europe Semiconductor Battery Industry Volume (K Unit), by Country 2024 & 2032
- Figure 57: Europe Semiconductor Battery Industry Revenue Share (%), by Country 2024 & 2032
- Figure 58: Europe Semiconductor Battery Industry Volume Share (%), by Country 2024 & 2032
- Figure 59: South America Semiconductor Battery Industry Revenue (Million), by Type 2024 & 2032
- Figure 60: South America Semiconductor Battery Industry Volume (K Unit), by Type 2024 & 2032
- Figure 61: South America Semiconductor Battery Industry Revenue Share (%), by Type 2024 & 2032
- Figure 62: South America Semiconductor Battery Industry Volume Share (%), by Type 2024 & 2032
- Figure 63: South America Semiconductor Battery Industry Revenue (Million), by End-User Application 2024 & 2032
- Figure 64: South America Semiconductor Battery Industry Volume (K Unit), by End-User Application 2024 & 2032
- Figure 65: South America Semiconductor Battery Industry Revenue Share (%), by End-User Application 2024 & 2032
- Figure 66: South America Semiconductor Battery Industry Volume Share (%), by End-User Application 2024 & 2032
- Figure 67: South America Semiconductor Battery Industry Revenue (Million), by Country 2024 & 2032
- Figure 68: South America Semiconductor Battery Industry Volume (K Unit), by Country 2024 & 2032
- Figure 69: South America Semiconductor Battery Industry Revenue Share (%), by Country 2024 & 2032
- Figure 70: South America Semiconductor Battery Industry Volume Share (%), by Country 2024 & 2032
- Figure 71: Middle East and Africa Semiconductor Battery Industry Revenue (Million), by Type 2024 & 2032
- Figure 72: Middle East and Africa Semiconductor Battery Industry Volume (K Unit), by Type 2024 & 2032
- Figure 73: Middle East and Africa Semiconductor Battery Industry Revenue Share (%), by Type 2024 & 2032
- Figure 74: Middle East and Africa Semiconductor Battery Industry Volume Share (%), by Type 2024 & 2032
- Figure 75: Middle East and Africa Semiconductor Battery Industry Revenue (Million), by End-User Application 2024 & 2032
- Figure 76: Middle East and Africa Semiconductor Battery Industry Volume (K Unit), by End-User Application 2024 & 2032
- Figure 77: Middle East and Africa Semiconductor Battery Industry Revenue Share (%), by End-User Application 2024 & 2032
- Figure 78: Middle East and Africa Semiconductor Battery Industry Volume Share (%), by End-User Application 2024 & 2032
- Figure 79: Middle East and Africa Semiconductor Battery Industry Revenue (Million), by Country 2024 & 2032
- Figure 80: Middle East and Africa Semiconductor Battery Industry Volume (K Unit), by Country 2024 & 2032
- Figure 81: Middle East and Africa Semiconductor Battery Industry Revenue Share (%), by Country 2024 & 2032
- Figure 82: Middle East and Africa Semiconductor Battery Industry Volume Share (%), by Country 2024 & 2032
List of Tables
- Table 1: Global Semiconductor Battery Industry Revenue Million Forecast, by Region 2019 & 2032
- Table 2: Global Semiconductor Battery Industry Volume K Unit Forecast, by Region 2019 & 2032
- Table 3: Global Semiconductor Battery Industry Revenue Million Forecast, by Type 2019 & 2032
- Table 4: Global Semiconductor Battery Industry Volume K Unit Forecast, by Type 2019 & 2032
- Table 5: Global Semiconductor Battery Industry Revenue Million Forecast, by End-User Application 2019 & 2032
- Table 6: Global Semiconductor Battery Industry Volume K Unit Forecast, by End-User Application 2019 & 2032
- Table 7: Global Semiconductor Battery Industry Revenue Million Forecast, by Region 2019 & 2032
- Table 8: Global Semiconductor Battery Industry Volume K Unit Forecast, by Region 2019 & 2032
- Table 9: Global Semiconductor Battery Industry Revenue Million Forecast, by Country 2019 & 2032
- Table 10: Global Semiconductor Battery Industry Volume K Unit Forecast, by Country 2019 & 2032
- Table 11: United States Semiconductor Battery Industry Revenue (Million) Forecast, by Application 2019 & 2032
- Table 12: United States Semiconductor Battery Industry Volume (K Unit) Forecast, by Application 2019 & 2032
- Table 13: Canada Semiconductor Battery Industry Revenue (Million) Forecast, by Application 2019 & 2032
- Table 14: Canada Semiconductor Battery Industry Volume (K Unit) Forecast, by Application 2019 & 2032
- Table 15: Mexico Semiconductor Battery Industry Revenue (Million) Forecast, by Application 2019 & 2032
- Table 16: Mexico Semiconductor Battery Industry Volume (K Unit) Forecast, by Application 2019 & 2032
- Table 17: Global Semiconductor Battery Industry Revenue Million Forecast, by Country 2019 & 2032
- Table 18: Global Semiconductor Battery Industry Volume K Unit Forecast, by Country 2019 & 2032
- Table 19: Germany Semiconductor Battery Industry Revenue (Million) Forecast, by Application 2019 & 2032
- Table 20: Germany Semiconductor Battery Industry Volume (K Unit) Forecast, by Application 2019 & 2032
- Table 21: United Kingdom Semiconductor Battery Industry Revenue (Million) Forecast, by Application 2019 & 2032
- Table 22: United Kingdom Semiconductor Battery Industry Volume (K Unit) Forecast, by Application 2019 & 2032
- Table 23: France Semiconductor Battery Industry Revenue (Million) Forecast, by Application 2019 & 2032
- Table 24: France Semiconductor Battery Industry Volume (K Unit) Forecast, by Application 2019 & 2032
- Table 25: Spain Semiconductor Battery Industry Revenue (Million) Forecast, by Application 2019 & 2032
- Table 26: Spain Semiconductor Battery Industry Volume (K Unit) Forecast, by Application 2019 & 2032
- Table 27: Italy Semiconductor Battery Industry Revenue (Million) Forecast, by Application 2019 & 2032
- Table 28: Italy Semiconductor Battery Industry Volume (K Unit) Forecast, by Application 2019 & 2032
- Table 29: Spain Semiconductor Battery Industry Revenue (Million) Forecast, by Application 2019 & 2032
- Table 30: Spain Semiconductor Battery Industry Volume (K Unit) Forecast, by Application 2019 & 2032
- Table 31: Belgium Semiconductor Battery Industry Revenue (Million) Forecast, by Application 2019 & 2032
- Table 32: Belgium Semiconductor Battery Industry Volume (K Unit) Forecast, by Application 2019 & 2032
- Table 33: Netherland Semiconductor Battery Industry Revenue (Million) Forecast, by Application 2019 & 2032
- Table 34: Netherland Semiconductor Battery Industry Volume (K Unit) Forecast, by Application 2019 & 2032
- Table 35: Nordics Semiconductor Battery Industry Revenue (Million) Forecast, by Application 2019 & 2032
- Table 36: Nordics Semiconductor Battery Industry Volume (K Unit) Forecast, by Application 2019 & 2032
- Table 37: Rest of Europe Semiconductor Battery Industry Revenue (Million) Forecast, by Application 2019 & 2032
- Table 38: Rest of Europe Semiconductor Battery Industry Volume (K Unit) Forecast, by Application 2019 & 2032
- Table 39: Global Semiconductor Battery Industry Revenue Million Forecast, by Country 2019 & 2032
- Table 40: Global Semiconductor Battery Industry Volume K Unit Forecast, by Country 2019 & 2032
- Table 41: China Semiconductor Battery Industry Revenue (Million) Forecast, by Application 2019 & 2032
- Table 42: China Semiconductor Battery Industry Volume (K Unit) Forecast, by Application 2019 & 2032
- Table 43: Japan Semiconductor Battery Industry Revenue (Million) Forecast, by Application 2019 & 2032
- Table 44: Japan Semiconductor Battery Industry Volume (K Unit) Forecast, by Application 2019 & 2032
- Table 45: India Semiconductor Battery Industry Revenue (Million) Forecast, by Application 2019 & 2032
- Table 46: India Semiconductor Battery Industry Volume (K Unit) Forecast, by Application 2019 & 2032
- Table 47: South Korea Semiconductor Battery Industry Revenue (Million) Forecast, by Application 2019 & 2032
- Table 48: South Korea Semiconductor Battery Industry Volume (K Unit) Forecast, by Application 2019 & 2032
- Table 49: Southeast Asia Semiconductor Battery Industry Revenue (Million) Forecast, by Application 2019 & 2032
- Table 50: Southeast Asia Semiconductor Battery Industry Volume (K Unit) Forecast, by Application 2019 & 2032
- Table 51: Australia Semiconductor Battery Industry Revenue (Million) Forecast, by Application 2019 & 2032
- Table 52: Australia Semiconductor Battery Industry Volume (K Unit) Forecast, by Application 2019 & 2032
- Table 53: Indonesia Semiconductor Battery Industry Revenue (Million) Forecast, by Application 2019 & 2032
- Table 54: Indonesia Semiconductor Battery Industry Volume (K Unit) Forecast, by Application 2019 & 2032
- Table 55: Phillipes Semiconductor Battery Industry Revenue (Million) Forecast, by Application 2019 & 2032
- Table 56: Phillipes Semiconductor Battery Industry Volume (K Unit) Forecast, by Application 2019 & 2032
- Table 57: Singapore Semiconductor Battery Industry Revenue (Million) Forecast, by Application 2019 & 2032
- Table 58: Singapore Semiconductor Battery Industry Volume (K Unit) Forecast, by Application 2019 & 2032
- Table 59: Thailandc Semiconductor Battery Industry Revenue (Million) Forecast, by Application 2019 & 2032
- Table 60: Thailandc Semiconductor Battery Industry Volume (K Unit) Forecast, by Application 2019 & 2032
- Table 61: Rest of Asia Pacific Semiconductor Battery Industry Revenue (Million) Forecast, by Application 2019 & 2032
- Table 62: Rest of Asia Pacific Semiconductor Battery Industry Volume (K Unit) Forecast, by Application 2019 & 2032
- Table 63: Global Semiconductor Battery Industry Revenue Million Forecast, by Country 2019 & 2032
- Table 64: Global Semiconductor Battery Industry Volume K Unit Forecast, by Country 2019 & 2032
- Table 65: Brazil Semiconductor Battery Industry Revenue (Million) Forecast, by Application 2019 & 2032
- Table 66: Brazil Semiconductor Battery Industry Volume (K Unit) Forecast, by Application 2019 & 2032
- Table 67: Argentina Semiconductor Battery Industry Revenue (Million) Forecast, by Application 2019 & 2032
- Table 68: Argentina Semiconductor Battery Industry Volume (K Unit) Forecast, by Application 2019 & 2032
- Table 69: Peru Semiconductor Battery Industry Revenue (Million) Forecast, by Application 2019 & 2032
- Table 70: Peru Semiconductor Battery Industry Volume (K Unit) Forecast, by Application 2019 & 2032
- Table 71: Chile Semiconductor Battery Industry Revenue (Million) Forecast, by Application 2019 & 2032
- Table 72: Chile Semiconductor Battery Industry Volume (K Unit) Forecast, by Application 2019 & 2032
- Table 73: Colombia Semiconductor Battery Industry Revenue (Million) Forecast, by Application 2019 & 2032
- Table 74: Colombia Semiconductor Battery Industry Volume (K Unit) Forecast, by Application 2019 & 2032
- Table 75: Ecuador Semiconductor Battery Industry Revenue (Million) Forecast, by Application 2019 & 2032
- Table 76: Ecuador Semiconductor Battery Industry Volume (K Unit) Forecast, by Application 2019 & 2032
- Table 77: Venezuela Semiconductor Battery Industry Revenue (Million) Forecast, by Application 2019 & 2032
- Table 78: Venezuela Semiconductor Battery Industry Volume (K Unit) Forecast, by Application 2019 & 2032
- Table 79: Rest of South America Semiconductor Battery Industry Revenue (Million) Forecast, by Application 2019 & 2032
- Table 80: Rest of South America Semiconductor Battery Industry Volume (K Unit) Forecast, by Application 2019 & 2032
- Table 81: Global Semiconductor Battery Industry Revenue Million Forecast, by Country 2019 & 2032
- Table 82: Global Semiconductor Battery Industry Volume K Unit Forecast, by Country 2019 & 2032
- Table 83: United Arab Emirates Semiconductor Battery Industry Revenue (Million) Forecast, by Application 2019 & 2032
- Table 84: United Arab Emirates Semiconductor Battery Industry Volume (K Unit) Forecast, by Application 2019 & 2032
- Table 85: Saudi Arabia Semiconductor Battery Industry Revenue (Million) Forecast, by Application 2019 & 2032
- Table 86: Saudi Arabia Semiconductor Battery Industry Volume (K Unit) Forecast, by Application 2019 & 2032
- Table 87: South Africa Semiconductor Battery Industry Revenue (Million) Forecast, by Application 2019 & 2032
- Table 88: South Africa Semiconductor Battery Industry Volume (K Unit) Forecast, by Application 2019 & 2032
- Table 89: Rest of Middle East and Africa Semiconductor Battery Industry Revenue (Million) Forecast, by Application 2019 & 2032
- Table 90: Rest of Middle East and Africa Semiconductor Battery Industry Volume (K Unit) Forecast, by Application 2019 & 2032
- Table 91: Global Semiconductor Battery Industry Revenue Million Forecast, by Type 2019 & 2032
- Table 92: Global Semiconductor Battery Industry Volume K Unit Forecast, by Type 2019 & 2032
- Table 93: Global Semiconductor Battery Industry Revenue Million Forecast, by End-User Application 2019 & 2032
- Table 94: Global Semiconductor Battery Industry Volume K Unit Forecast, by End-User Application 2019 & 2032
- Table 95: Global Semiconductor Battery Industry Revenue Million Forecast, by Country 2019 & 2032
- Table 96: Global Semiconductor Battery Industry Volume K Unit Forecast, by Country 2019 & 2032
- Table 97: United States Semiconductor Battery Industry Revenue (Million) Forecast, by Application 2019 & 2032
- Table 98: United States Semiconductor Battery Industry Volume (K Unit) Forecast, by Application 2019 & 2032
- Table 99: Canada Semiconductor Battery Industry Revenue (Million) Forecast, by Application 2019 & 2032
- Table 100: Canada Semiconductor Battery Industry Volume (K Unit) Forecast, by Application 2019 & 2032
- Table 101: Rest of North America Semiconductor Battery Industry Revenue (Million) Forecast, by Application 2019 & 2032
- Table 102: Rest of North America Semiconductor Battery Industry Volume (K Unit) Forecast, by Application 2019 & 2032
- Table 103: Global Semiconductor Battery Industry Revenue Million Forecast, by Type 2019 & 2032
- Table 104: Global Semiconductor Battery Industry Volume K Unit Forecast, by Type 2019 & 2032
- Table 105: Global Semiconductor Battery Industry Revenue Million Forecast, by End-User Application 2019 & 2032
- Table 106: Global Semiconductor Battery Industry Volume K Unit Forecast, by End-User Application 2019 & 2032
- Table 107: Global Semiconductor Battery Industry Revenue Million Forecast, by Country 2019 & 2032
- Table 108: Global Semiconductor Battery Industry Volume K Unit Forecast, by Country 2019 & 2032
- Table 109: China Semiconductor Battery Industry Revenue (Million) Forecast, by Application 2019 & 2032
- Table 110: China Semiconductor Battery Industry Volume (K Unit) Forecast, by Application 2019 & 2032
- Table 111: India Semiconductor Battery Industry Revenue (Million) Forecast, by Application 2019 & 2032
- Table 112: India Semiconductor Battery Industry Volume (K Unit) Forecast, by Application 2019 & 2032
- Table 113: Japan Semiconductor Battery Industry Revenue (Million) Forecast, by Application 2019 & 2032
- Table 114: Japan Semiconductor Battery Industry Volume (K Unit) Forecast, by Application 2019 & 2032
- Table 115: South Korea Semiconductor Battery Industry Revenue (Million) Forecast, by Application 2019 & 2032
- Table 116: South Korea Semiconductor Battery Industry Volume (K Unit) Forecast, by Application 2019 & 2032
- Table 117: Rest of Asia Pacific Semiconductor Battery Industry Revenue (Million) Forecast, by Application 2019 & 2032
- Table 118: Rest of Asia Pacific Semiconductor Battery Industry Volume (K Unit) Forecast, by Application 2019 & 2032
- Table 119: Global Semiconductor Battery Industry Revenue Million Forecast, by Type 2019 & 2032
- Table 120: Global Semiconductor Battery Industry Volume K Unit Forecast, by Type 2019 & 2032
- Table 121: Global Semiconductor Battery Industry Revenue Million Forecast, by End-User Application 2019 & 2032
- Table 122: Global Semiconductor Battery Industry Volume K Unit Forecast, by End-User Application 2019 & 2032
- Table 123: Global Semiconductor Battery Industry Revenue Million Forecast, by Country 2019 & 2032
- Table 124: Global Semiconductor Battery Industry Volume K Unit Forecast, by Country 2019 & 2032
- Table 125: Germany Semiconductor Battery Industry Revenue (Million) Forecast, by Application 2019 & 2032
- Table 126: Germany Semiconductor Battery Industry Volume (K Unit) Forecast, by Application 2019 & 2032
- Table 127: United Kingdom Semiconductor Battery Industry Revenue (Million) Forecast, by Application 2019 & 2032
- Table 128: United Kingdom Semiconductor Battery Industry Volume (K Unit) Forecast, by Application 2019 & 2032
- Table 129: France Semiconductor Battery Industry Revenue (Million) Forecast, by Application 2019 & 2032
- Table 130: France Semiconductor Battery Industry Volume (K Unit) Forecast, by Application 2019 & 2032
- Table 131: Italy Semiconductor Battery Industry Revenue (Million) Forecast, by Application 2019 & 2032
- Table 132: Italy Semiconductor Battery Industry Volume (K Unit) Forecast, by Application 2019 & 2032
- Table 133: Rest of Europe Semiconductor Battery Industry Revenue (Million) Forecast, by Application 2019 & 2032
- Table 134: Rest of Europe Semiconductor Battery Industry Volume (K Unit) Forecast, by Application 2019 & 2032
- Table 135: Global Semiconductor Battery Industry Revenue Million Forecast, by Type 2019 & 2032
- Table 136: Global Semiconductor Battery Industry Volume K Unit Forecast, by Type 2019 & 2032
- Table 137: Global Semiconductor Battery Industry Revenue Million Forecast, by End-User Application 2019 & 2032
- Table 138: Global Semiconductor Battery Industry Volume K Unit Forecast, by End-User Application 2019 & 2032
- Table 139: Global Semiconductor Battery Industry Revenue Million Forecast, by Country 2019 & 2032
- Table 140: Global Semiconductor Battery Industry Volume K Unit Forecast, by Country 2019 & 2032
- Table 141: Chile Semiconductor Battery Industry Revenue (Million) Forecast, by Application 2019 & 2032
- Table 142: Chile Semiconductor Battery Industry Volume (K Unit) Forecast, by Application 2019 & 2032
- Table 143: Brazil Semiconductor Battery Industry Revenue (Million) Forecast, by Application 2019 & 2032
- Table 144: Brazil Semiconductor Battery Industry Volume (K Unit) Forecast, by Application 2019 & 2032
- Table 145: Argentina Semiconductor Battery Industry Revenue (Million) Forecast, by Application 2019 & 2032
- Table 146: Argentina Semiconductor Battery Industry Volume (K Unit) Forecast, by Application 2019 & 2032
- Table 147: Rest of South America Semiconductor Battery Industry Revenue (Million) Forecast, by Application 2019 & 2032
- Table 148: Rest of South America Semiconductor Battery Industry Volume (K Unit) Forecast, by Application 2019 & 2032
- Table 149: Global Semiconductor Battery Industry Revenue Million Forecast, by Type 2019 & 2032
- Table 150: Global Semiconductor Battery Industry Volume K Unit Forecast, by Type 2019 & 2032
- Table 151: Global Semiconductor Battery Industry Revenue Million Forecast, by End-User Application 2019 & 2032
- Table 152: Global Semiconductor Battery Industry Volume K Unit Forecast, by End-User Application 2019 & 2032
- Table 153: Global Semiconductor Battery Industry Revenue Million Forecast, by Country 2019 & 2032
- Table 154: Global Semiconductor Battery Industry Volume K Unit Forecast, by Country 2019 & 2032
- Table 155: Saudi Arabia Semiconductor Battery Industry Revenue (Million) Forecast, by Application 2019 & 2032
- Table 156: Saudi Arabia Semiconductor Battery Industry Volume (K Unit) Forecast, by Application 2019 & 2032
- Table 157: United Arab Emirates Semiconductor Battery Industry Revenue (Million) Forecast, by Application 2019 & 2032
- Table 158: United Arab Emirates Semiconductor Battery Industry Volume (K Unit) Forecast, by Application 2019 & 2032
- Table 159: South Africa Semiconductor Battery Industry Revenue (Million) Forecast, by Application 2019 & 2032
- Table 160: South Africa Semiconductor Battery Industry Volume (K Unit) Forecast, by Application 2019 & 2032
- Table 161: Egypt Semiconductor Battery Industry Revenue (Million) Forecast, by Application 2019 & 2032
- Table 162: Egypt Semiconductor Battery Industry Volume (K Unit) Forecast, by Application 2019 & 2032
- Table 163: Rest of Middle East and Africa Semiconductor Battery Industry Revenue (Million) Forecast, by Application 2019 & 2032
- Table 164: Rest of Middle East and Africa Semiconductor Battery Industry Volume (K Unit) Forecast, by Application 2019 & 2032
Frequently Asked Questions
1. What is the projected Compound Annual Growth Rate (CAGR) of the Semiconductor Battery Industry?
The projected CAGR is approximately 8.67%.
2. Which companies are prominent players in the Semiconductor Battery Industry?
Key companies in the market include EnerSys, Samsung SDI Co Ltd, TianJin Lishen Battery Joint-Stock Co Ltd, Varta AG, Toshiba Corporation, Faradion Limited, GS Yuasa Corporation, Routejade, Panasonic Corporation, Sony Corporation.
3. What are the main segments of the Semiconductor Battery Industry?
The market segments include Type, End-User Application.
4. Can you provide details about the market size?
The market size is estimated to be USD 13.19 Million as of 2022.
5. What are some drivers contributing to market growth?
4.; Increasing Demand for Mobile Devices4.; Rising Adaption of Electric Vehicles.
6. What are the notable trends driving market growth?
The Electric Vehicle Segment is Expected to Witness Significant Demand.
7. Are there any restraints impacting market growth?
4.; Availability of Technical Challenges.
8. Can you provide examples of recent developments in the market?
February 2022: ROHM Semiconductor announced that the company developed a new evaluation board for ultra-efficient semiconductor battery operations for the newly developed Internet of Things devices called REFLVBMS001-EVK-001.
9. What pricing options are available for accessing the report?
Pricing options include single-user, multi-user, and enterprise licenses priced at USD 4750, USD 5250, and USD 8750 respectively.
10. Is the market size provided in terms of value or volume?
The market size is provided in terms of value, measured in Million and volume, measured in K Unit.
11. Are there any specific market keywords associated with the report?
Yes, the market keyword associated with the report is "Semiconductor Battery Industry," which aids in identifying and referencing the specific market segment covered.
12. How do I determine which pricing option suits my needs best?
The pricing options vary based on user requirements and access needs. Individual users may opt for single-user licenses, while businesses requiring broader access may choose multi-user or enterprise licenses for cost-effective access to the report.
13. Are there any additional resources or data provided in the Semiconductor Battery Industry report?
While the report offers comprehensive insights, it's advisable to review the specific contents or supplementary materials provided to ascertain if additional resources or data are available.
14. How can I stay updated on further developments or reports in the Semiconductor Battery Industry?
To stay informed about further developments, trends, and reports in the Semiconductor Battery Industry, consider subscribing to industry newsletters, following relevant companies and organizations, or regularly checking reputable industry news sources and publications.
Methodology
Step 1 - Identification of Relevant Samples Size from Population Database


Step 2 - Approaches for Defining Global Market Size (Value, Volume* & Price*)

Note*: In applicable scenarios
Step 3 - Data Sources
Primary Research
- Web Analytics
- Survey Reports
- Research Institute
- Latest Research Reports
- Opinion Leaders
Secondary Research
- Annual Reports
- White Paper
- Latest Press Release
- Industry Association
- Paid Database
- Investor Presentations

Step 4 - Data Triangulation
Involves using different sources of information in order to increase the validity of a study
These sources are likely to be stakeholders in a program - participants, other researchers, program staff, other community members, and so on.
Then we put all data in single framework & apply various statistical tools to find out the dynamic on the market.
During the analysis stage, feedback from the stakeholder groups would be compared to determine areas of agreement as well as areas of divergence


