
Key Insights
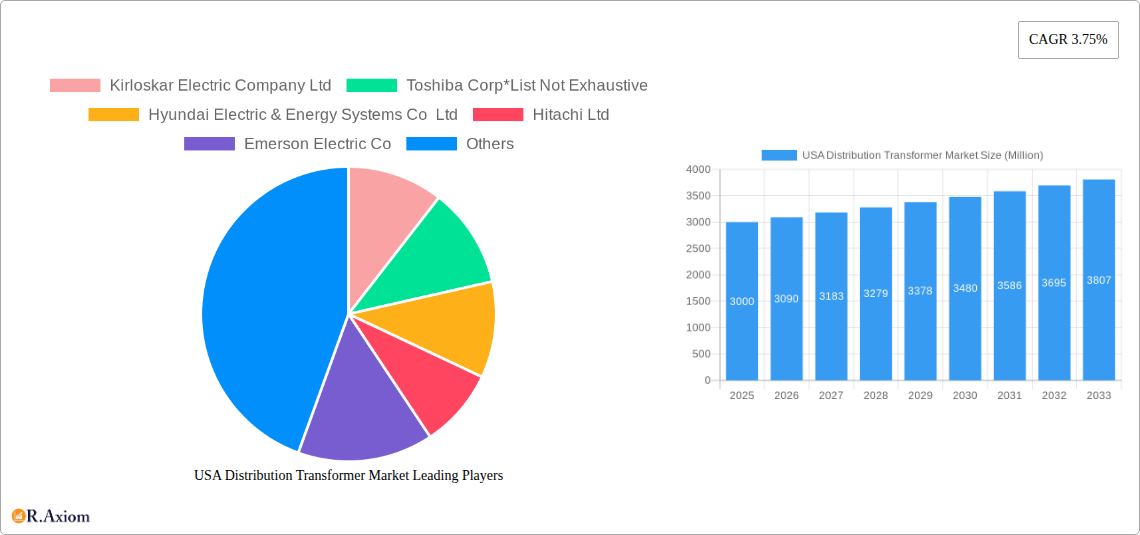
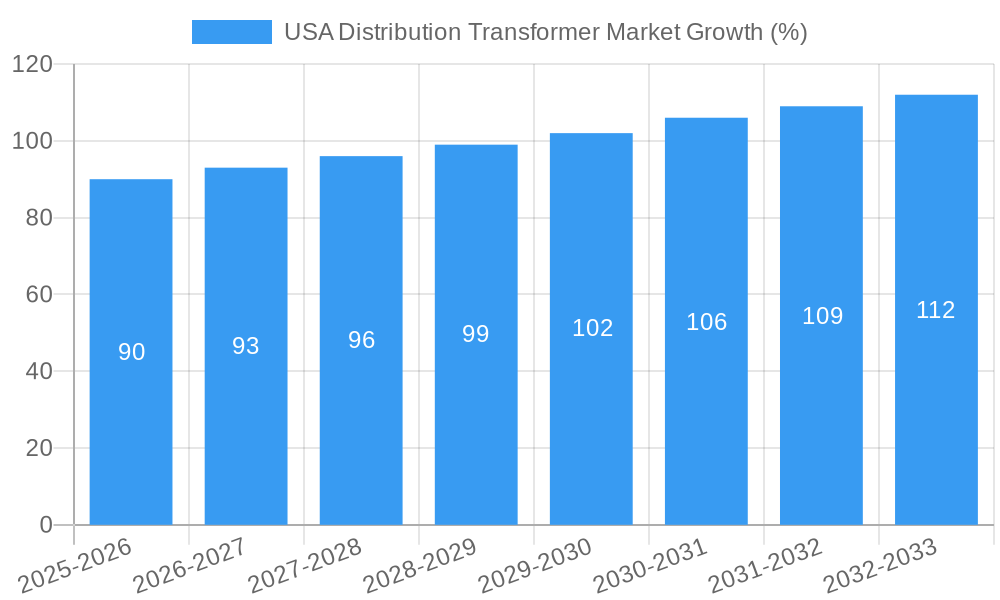
The US distribution transformer market, valued at approximately $3 billion in 2025, is projected to experience steady growth, exhibiting a Compound Annual Growth Rate (CAGR) of 3.75% from 2025 to 2033. This growth is primarily driven by the increasing demand for electricity across diverse sectors, including residential, commercial, and industrial applications. Expansion of the national grid infrastructure, coupled with the growing adoption of renewable energy sources and smart grid technologies, further fuels market expansion. The market segmentation reveals significant demand for dry-type transformers, owing to their enhanced safety features and reduced environmental impact compared to oil-filled counterparts. Medium-sized power rating transformers are expected to dominate the market due to their wide applicability in various distribution networks. Pad-mounted transformers are gaining traction due to their compact design and ease of installation, especially in urban areas with limited space. Key players like Kirloskar Electric, Toshiba, and Siemens are leveraging technological advancements and strategic partnerships to strengthen their market positions, focusing on energy efficiency and smart grid integration.
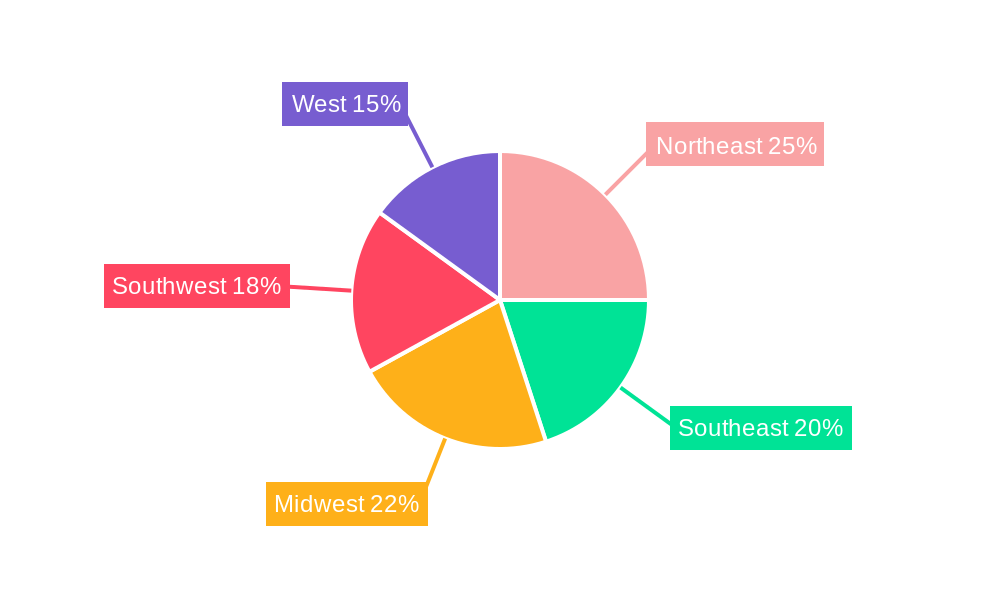
Regional analysis reveals varying growth trajectories across the US. While the Northeast and West regions are anticipated to experience robust growth due to increased urbanization and industrial activity, the Southwest and Midwest may exhibit slightly slower growth rates, influenced by factors like population density and existing infrastructure. The competitive landscape is characterized by both established multinational corporations and regional players, resulting in a dynamic market with ongoing innovation and competition. The market faces challenges such as increasing raw material costs and stringent regulatory compliance requirements. However, the long-term outlook remains positive, driven by the consistent demand for reliable and efficient power distribution infrastructure.
USA Distribution Transformer Market: A Comprehensive Report (2019-2033)
This in-depth report provides a comprehensive analysis of the USA Distribution Transformer Market, covering the period 2019-2033. It offers actionable insights for industry stakeholders, investors, and businesses seeking to understand the market dynamics, growth opportunities, and competitive landscape. The report leverages extensive data analysis and expert insights to deliver a clear and concise overview of this crucial sector. The forecast period is 2025-2033, with 2025 serving as the base and estimated year. The historical period covered is 2019-2024. The market is segmented by power rating (small, medium, large), type (oil-filled, dry-type), phase (single-phase, three-phase), and type of mounting (pole-mounted, pad-mounted). Key players analyzed include Kirloskar Electric Company Ltd, Toshiba Corp, Hyundai Electric & Energy Systems Co Ltd, Hitachi Ltd, Emerson Electric Co, Siemens AG, Schneider Electric SE, Eaton Corporation PLC, Southwest Electric Co, and General Electric Company.
USA Distribution Transformer Market Concentration & Innovation
The USA distribution transformer market exhibits a moderately concentrated landscape, with a few major players holding significant market share. Precise market share figures for each company require further proprietary research, but it's expected that established players like Siemens, GE, and Eaton hold substantial portions. However, the market also features several regional and niche players, creating a dynamic competitive environment.
Innovation is a key driver, fueled by the increasing demand for energy-efficient and sustainable solutions. Regulatory frameworks, such as those promoting renewable energy integration and grid modernization, further stimulate innovation. The emergence of dry-type transformers as a substitute for oil-filled transformers, driven by environmental concerns and safety regulations, is a significant example. End-user trends toward smart grids and distributed generation systems also influence product development. M&A activity in the sector, while not exceptionally high in recent years, has been observed, with deal values ranging from xx Million to xx Million, primarily focusing on acquiring smaller companies with specialized technologies or regional presence.
USA Distribution Transformer Market Industry Trends & Insights
The USA distribution transformer market is projected to experience a CAGR of xx% during the forecast period (2025-2033). This growth is primarily driven by increasing investments in grid infrastructure modernization, expanding renewable energy integration, and rising urbanization leading to higher electricity demand. Technological disruptions, such as the adoption of smart grid technologies and the increasing popularity of dry-type transformers, are reshaping the market. Consumer preferences are shifting towards environmentally friendly and energy-efficient solutions, further accelerating the adoption of dry-type transformers. Competitive dynamics are characterized by both intense rivalry among established players and the emergence of new entrants offering innovative solutions. Market penetration for dry-type transformers is estimated to reach xx% by 2033, signifying substantial growth in this segment.
Dominant Markets & Segments in USA Distribution Transformer Market
The largest segment by power rating is expected to be the medium-power rating transformers, driven by widespread use in residential and commercial applications. The leading segment by type is oil-filled transformers, though the dry-type segment is witnessing rapid growth due to increasing environmental awareness. Three-phase transformers dominate the market due to their higher capacity and suitability for industrial and commercial applications. Pole-mounted transformers hold a larger market share compared to pad-mounted transformers due to their cost-effectiveness and ease of installation.
- Key Drivers for Medium Power Rating Segment: Widespread use in residential and commercial settings, relatively lower cost, and ease of installation.
- Key Drivers for Dry-Type Transformers: Growing environmental concerns, enhanced safety features, and reduced maintenance requirements.
- Key Drivers for Three-Phase Transformers: High capacity and suitability for commercial and industrial applications.
- Key Drivers for Pole-Mounted Transformers: Cost-effectiveness, ease of installation and maintenance, and suitability for various applications.
The geographic dominance remains spread across several states with high energy consumption and grid modernization initiatives.
USA Distribution Transformer Market Product Developments
Recent product innovations focus on enhancing energy efficiency, improving safety, and minimizing environmental impact. Dry-type transformers are gaining significant traction, featuring advanced insulation materials and compact designs. Smart transformers equipped with sensors and communication capabilities enable real-time monitoring and improved grid management. These advancements contribute to a more reliable, efficient, and sustainable power distribution system, aligning with the growing demand for grid modernization and renewable energy integration.
Report Scope & Segmentation Analysis
This report segments the USA distribution transformer market based on power rating (small, medium, large), type (oil-filled, dry-type), phase (single-phase, three-phase), and type of mounting (pole-mounted, pad-mounted). Each segment's market size, growth projections, and competitive dynamics are analyzed in detail, providing a comprehensive overview of the market landscape. For instance, the dry-type segment is expected to witness significant growth driven by increasing environmental concerns and safety regulations. Similarly, the three-phase segment is expected to remain dominant due to its higher capacity and wide applications.
Key Drivers of USA Distribution Transformer Market Growth
The growth of the USA distribution transformer market is primarily driven by the increasing demand for electricity, grid modernization initiatives aimed at improving reliability and efficiency, the rising adoption of renewable energy sources, and stringent government regulations promoting energy efficiency. Furthermore, technological advancements in transformer design and manufacturing are contributing to improved performance and reduced environmental impact. These factors collectively drive the demand for advanced and efficient distribution transformers across various applications.
Challenges in the USA Distribution Transformer Market Sector
The USA distribution transformer market faces challenges such as the fluctuating prices of raw materials, stringent environmental regulations impacting manufacturing processes, and intense competition from both domestic and international players. Supply chain disruptions and increasing labor costs also pose significant challenges. These factors can lead to increased production costs and potentially affect market profitability.
Emerging Opportunities in USA Distribution Transformer Market
Emerging opportunities lie in the growing adoption of smart grid technologies, the integration of renewable energy sources, and the increasing demand for energy-efficient and sustainable solutions. The development of advanced materials and technologies, enabling the creation of more efficient and durable transformers, presents significant growth potential. Furthermore, expansion into new geographical markets and applications will create further opportunities.
Leading Players in the USA Distribution Transformer Market Market
- Kirloskar Electric Company Ltd
- Toshiba Corp
- Hyundai Electric & Energy Systems Co Ltd
- Hitachi Ltd
- Emerson Electric Co
- Siemens AG
- Schneider Electric SE
- Eaton Corporation PLC
- Southwest Electric Co
- General Electric Company
Key Developments in USA Distribution Transformer Market Industry
- May 2022: Hitachi Energy announced a USD 10 Million+ investment to expand its distribution transformer facility in Jefferson City, Missouri, boosting capacity and manufacturing capabilities.
- April 2022: Siemens Energy launched an innovative dry-type single-phase transformer for pole applications, offering a sustainable and reliable alternative to oil-filled transformers.
Strategic Outlook for USA Distribution Transformer Market Market
The future of the USA distribution transformer market looks promising, driven by sustained growth in electricity demand, ongoing grid modernization efforts, and a growing emphasis on renewable energy integration. Opportunities for growth exist in developing innovative, energy-efficient, and sustainable transformer solutions, catering to the evolving needs of a modernizing power grid. Companies that embrace technological advancements and adapt to changing market dynamics will be best positioned for success.
USA Distribution Transformer Market Segmentation
-
1. Power Rating
- 1.1. Small
- 1.2. Large
- 1.3. Medium
-
2. Type
- 2.1. Oil-Filled
- 2.2. Dry-Type
-
3. Phase
- 3.1. Single Phase
- 3.2. Triple Phase
-
4. Type of Mounting
- 4.1. Pole-mounted
- 4.2. Pad-mounted
USA Distribution Transformer Market Segmentation By Geography
-
1. North America
- 1.1. United States
- 1.2. Canada
- 1.3. Mexico
-
2. South America
- 2.1. Brazil
- 2.2. Argentina
- 2.3. Rest of South America
-
3. Europe
- 3.1. United Kingdom
- 3.2. Germany
- 3.3. France
- 3.4. Italy
- 3.5. Spain
- 3.6. Russia
- 3.7. Benelux
- 3.8. Nordics
- 3.9. Rest of Europe
-
4. Middle East & Africa
- 4.1. Turkey
- 4.2. Israel
- 4.3. GCC
- 4.4. North Africa
- 4.5. South Africa
- 4.6. Rest of Middle East & Africa
-
5. Asia Pacific
- 5.1. China
- 5.2. India
- 5.3. Japan
- 5.4. South Korea
- 5.5. ASEAN
- 5.6. Oceania
- 5.7. Rest of Asia Pacific
USA Distribution Transformer Market REPORT HIGHLIGHTS
| Aspects | Details |
|---|---|
| Study Period | 2019-2033 |
| Base Year | 2024 |
| Estimated Year | 2025 |
| Forecast Period | 2025-2033 |
| Historical Period | 2019-2024 |
| Growth Rate | CAGR of 3.75% from 2019-2033 |
| Segmentation |
|
Table of Contents
- 1. Introduction
- 1.1. Research Scope
- 1.2. Market Segmentation
- 1.3. Research Methodology
- 1.4. Definitions and Assumptions
- 2. Executive Summary
- 2.1. Introduction
- 3. Market Dynamics
- 3.1. Introduction
- 3.2. Market Drivers
- 3.2.1. 4.; Rising Power Demand4.; Substantial Investments And Efforts To Modernize The T&D Grid
- 3.3. Market Restrains
- 3.3.1. 4.; Rising Distributed Energy Generation
- 3.4. Market Trends
- 3.4.1. High Voltage Segment Expected to Dominate the Market
- 4. Market Factor Analysis
- 4.1. Porters Five Forces
- 4.2. Supply/Value Chain
- 4.3. PESTEL analysis
- 4.4. Market Entropy
- 4.5. Patent/Trademark Analysis
- 5. Global USA Distribution Transformer Market Analysis, Insights and Forecast, 2019-2031
- 5.1. Market Analysis, Insights and Forecast - by Power Rating
- 5.1.1. Small
- 5.1.2. Large
- 5.1.3. Medium
- 5.2. Market Analysis, Insights and Forecast - by Type
- 5.2.1. Oil-Filled
- 5.2.2. Dry-Type
- 5.3. Market Analysis, Insights and Forecast - by Phase
- 5.3.1. Single Phase
- 5.3.2. Triple Phase
- 5.4. Market Analysis, Insights and Forecast - by Type of Mounting
- 5.4.1. Pole-mounted
- 5.4.2. Pad-mounted
- 5.5. Market Analysis, Insights and Forecast - by Region
- 5.5.1. North America
- 5.5.2. South America
- 5.5.3. Europe
- 5.5.4. Middle East & Africa
- 5.5.5. Asia Pacific
- 5.1. Market Analysis, Insights and Forecast - by Power Rating
- 6. North America USA Distribution Transformer Market Analysis, Insights and Forecast, 2019-2031
- 6.1. Market Analysis, Insights and Forecast - by Power Rating
- 6.1.1. Small
- 6.1.2. Large
- 6.1.3. Medium
- 6.2. Market Analysis, Insights and Forecast - by Type
- 6.2.1. Oil-Filled
- 6.2.2. Dry-Type
- 6.3. Market Analysis, Insights and Forecast - by Phase
- 6.3.1. Single Phase
- 6.3.2. Triple Phase
- 6.4. Market Analysis, Insights and Forecast - by Type of Mounting
- 6.4.1. Pole-mounted
- 6.4.2. Pad-mounted
- 6.1. Market Analysis, Insights and Forecast - by Power Rating
- 7. South America USA Distribution Transformer Market Analysis, Insights and Forecast, 2019-2031
- 7.1. Market Analysis, Insights and Forecast - by Power Rating
- 7.1.1. Small
- 7.1.2. Large
- 7.1.3. Medium
- 7.2. Market Analysis, Insights and Forecast - by Type
- 7.2.1. Oil-Filled
- 7.2.2. Dry-Type
- 7.3. Market Analysis, Insights and Forecast - by Phase
- 7.3.1. Single Phase
- 7.3.2. Triple Phase
- 7.4. Market Analysis, Insights and Forecast - by Type of Mounting
- 7.4.1. Pole-mounted
- 7.4.2. Pad-mounted
- 7.1. Market Analysis, Insights and Forecast - by Power Rating
- 8. Europe USA Distribution Transformer Market Analysis, Insights and Forecast, 2019-2031
- 8.1. Market Analysis, Insights and Forecast - by Power Rating
- 8.1.1. Small
- 8.1.2. Large
- 8.1.3. Medium
- 8.2. Market Analysis, Insights and Forecast - by Type
- 8.2.1. Oil-Filled
- 8.2.2. Dry-Type
- 8.3. Market Analysis, Insights and Forecast - by Phase
- 8.3.1. Single Phase
- 8.3.2. Triple Phase
- 8.4. Market Analysis, Insights and Forecast - by Type of Mounting
- 8.4.1. Pole-mounted
- 8.4.2. Pad-mounted
- 8.1. Market Analysis, Insights and Forecast - by Power Rating
- 9. Middle East & Africa USA Distribution Transformer Market Analysis, Insights and Forecast, 2019-2031
- 9.1. Market Analysis, Insights and Forecast - by Power Rating
- 9.1.1. Small
- 9.1.2. Large
- 9.1.3. Medium
- 9.2. Market Analysis, Insights and Forecast - by Type
- 9.2.1. Oil-Filled
- 9.2.2. Dry-Type
- 9.3. Market Analysis, Insights and Forecast - by Phase
- 9.3.1. Single Phase
- 9.3.2. Triple Phase
- 9.4. Market Analysis, Insights and Forecast - by Type of Mounting
- 9.4.1. Pole-mounted
- 9.4.2. Pad-mounted
- 9.1. Market Analysis, Insights and Forecast - by Power Rating
- 10. Asia Pacific USA Distribution Transformer Market Analysis, Insights and Forecast, 2019-2031
- 10.1. Market Analysis, Insights and Forecast - by Power Rating
- 10.1.1. Small
- 10.1.2. Large
- 10.1.3. Medium
- 10.2. Market Analysis, Insights and Forecast - by Type
- 10.2.1. Oil-Filled
- 10.2.2. Dry-Type
- 10.3. Market Analysis, Insights and Forecast - by Phase
- 10.3.1. Single Phase
- 10.3.2. Triple Phase
- 10.4. Market Analysis, Insights and Forecast - by Type of Mounting
- 10.4.1. Pole-mounted
- 10.4.2. Pad-mounted
- 10.1. Market Analysis, Insights and Forecast - by Power Rating
- 11. Northeast USA Distribution Transformer Market Analysis, Insights and Forecast, 2019-2031
- 12. Southeast USA Distribution Transformer Market Analysis, Insights and Forecast, 2019-2031
- 13. Midwest USA Distribution Transformer Market Analysis, Insights and Forecast, 2019-2031
- 14. Southwest USA Distribution Transformer Market Analysis, Insights and Forecast, 2019-2031
- 15. West USA Distribution Transformer Market Analysis, Insights and Forecast, 2019-2031
- 16. Competitive Analysis
- 16.1. Global Market Share Analysis 2024
- 16.2. Company Profiles
- 16.2.1 Kirloskar Electric Company Ltd
- 16.2.1.1. Overview
- 16.2.1.2. Products
- 16.2.1.3. SWOT Analysis
- 16.2.1.4. Recent Developments
- 16.2.1.5. Financials (Based on Availability)
- 16.2.2 Toshiba Corp*List Not Exhaustive
- 16.2.2.1. Overview
- 16.2.2.2. Products
- 16.2.2.3. SWOT Analysis
- 16.2.2.4. Recent Developments
- 16.2.2.5. Financials (Based on Availability)
- 16.2.3 Hyundai Electric & Energy Systems Co Ltd
- 16.2.3.1. Overview
- 16.2.3.2. Products
- 16.2.3.3. SWOT Analysis
- 16.2.3.4. Recent Developments
- 16.2.3.5. Financials (Based on Availability)
- 16.2.4 Hitachi Ltd
- 16.2.4.1. Overview
- 16.2.4.2. Products
- 16.2.4.3. SWOT Analysis
- 16.2.4.4. Recent Developments
- 16.2.4.5. Financials (Based on Availability)
- 16.2.5 Emerson Electric Co
- 16.2.5.1. Overview
- 16.2.5.2. Products
- 16.2.5.3. SWOT Analysis
- 16.2.5.4. Recent Developments
- 16.2.5.5. Financials (Based on Availability)
- 16.2.6 Siemens AG
- 16.2.6.1. Overview
- 16.2.6.2. Products
- 16.2.6.3. SWOT Analysis
- 16.2.6.4. Recent Developments
- 16.2.6.5. Financials (Based on Availability)
- 16.2.7 Schneider Electric SE
- 16.2.7.1. Overview
- 16.2.7.2. Products
- 16.2.7.3. SWOT Analysis
- 16.2.7.4. Recent Developments
- 16.2.7.5. Financials (Based on Availability)
- 16.2.8 Eaton Corporation PLC
- 16.2.8.1. Overview
- 16.2.8.2. Products
- 16.2.8.3. SWOT Analysis
- 16.2.8.4. Recent Developments
- 16.2.8.5. Financials (Based on Availability)
- 16.2.9 Southwest Electric Co
- 16.2.9.1. Overview
- 16.2.9.2. Products
- 16.2.9.3. SWOT Analysis
- 16.2.9.4. Recent Developments
- 16.2.9.5. Financials (Based on Availability)
- 16.2.10 General Electric Company
- 16.2.10.1. Overview
- 16.2.10.2. Products
- 16.2.10.3. SWOT Analysis
- 16.2.10.4. Recent Developments
- 16.2.10.5. Financials (Based on Availability)
- 16.2.1 Kirloskar Electric Company Ltd
List of Figures
- Figure 1: Global USA Distribution Transformer Market Revenue Breakdown (Million, %) by Region 2024 & 2032
- Figure 2: Global USA Distribution Transformer Market Volume Breakdown (K Units, %) by Region 2024 & 2032
- Figure 3: United states USA Distribution Transformer Market Revenue (Million), by Country 2024 & 2032
- Figure 4: United states USA Distribution Transformer Market Volume (K Units), by Country 2024 & 2032
- Figure 5: United states USA Distribution Transformer Market Revenue Share (%), by Country 2024 & 2032
- Figure 6: United states USA Distribution Transformer Market Volume Share (%), by Country 2024 & 2032
- Figure 7: North America USA Distribution Transformer Market Revenue (Million), by Power Rating 2024 & 2032
- Figure 8: North America USA Distribution Transformer Market Volume (K Units), by Power Rating 2024 & 2032
- Figure 9: North America USA Distribution Transformer Market Revenue Share (%), by Power Rating 2024 & 2032
- Figure 10: North America USA Distribution Transformer Market Volume Share (%), by Power Rating 2024 & 2032
- Figure 11: North America USA Distribution Transformer Market Revenue (Million), by Type 2024 & 2032
- Figure 12: North America USA Distribution Transformer Market Volume (K Units), by Type 2024 & 2032
- Figure 13: North America USA Distribution Transformer Market Revenue Share (%), by Type 2024 & 2032
- Figure 14: North America USA Distribution Transformer Market Volume Share (%), by Type 2024 & 2032
- Figure 15: North America USA Distribution Transformer Market Revenue (Million), by Phase 2024 & 2032
- Figure 16: North America USA Distribution Transformer Market Volume (K Units), by Phase 2024 & 2032
- Figure 17: North America USA Distribution Transformer Market Revenue Share (%), by Phase 2024 & 2032
- Figure 18: North America USA Distribution Transformer Market Volume Share (%), by Phase 2024 & 2032
- Figure 19: North America USA Distribution Transformer Market Revenue (Million), by Type of Mounting 2024 & 2032
- Figure 20: North America USA Distribution Transformer Market Volume (K Units), by Type of Mounting 2024 & 2032
- Figure 21: North America USA Distribution Transformer Market Revenue Share (%), by Type of Mounting 2024 & 2032
- Figure 22: North America USA Distribution Transformer Market Volume Share (%), by Type of Mounting 2024 & 2032
- Figure 23: North America USA Distribution Transformer Market Revenue (Million), by Country 2024 & 2032
- Figure 24: North America USA Distribution Transformer Market Volume (K Units), by Country 2024 & 2032
- Figure 25: North America USA Distribution Transformer Market Revenue Share (%), by Country 2024 & 2032
- Figure 26: North America USA Distribution Transformer Market Volume Share (%), by Country 2024 & 2032
- Figure 27: South America USA Distribution Transformer Market Revenue (Million), by Power Rating 2024 & 2032
- Figure 28: South America USA Distribution Transformer Market Volume (K Units), by Power Rating 2024 & 2032
- Figure 29: South America USA Distribution Transformer Market Revenue Share (%), by Power Rating 2024 & 2032
- Figure 30: South America USA Distribution Transformer Market Volume Share (%), by Power Rating 2024 & 2032
- Figure 31: South America USA Distribution Transformer Market Revenue (Million), by Type 2024 & 2032
- Figure 32: South America USA Distribution Transformer Market Volume (K Units), by Type 2024 & 2032
- Figure 33: South America USA Distribution Transformer Market Revenue Share (%), by Type 2024 & 2032
- Figure 34: South America USA Distribution Transformer Market Volume Share (%), by Type 2024 & 2032
- Figure 35: South America USA Distribution Transformer Market Revenue (Million), by Phase 2024 & 2032
- Figure 36: South America USA Distribution Transformer Market Volume (K Units), by Phase 2024 & 2032
- Figure 37: South America USA Distribution Transformer Market Revenue Share (%), by Phase 2024 & 2032
- Figure 38: South America USA Distribution Transformer Market Volume Share (%), by Phase 2024 & 2032
- Figure 39: South America USA Distribution Transformer Market Revenue (Million), by Type of Mounting 2024 & 2032
- Figure 40: South America USA Distribution Transformer Market Volume (K Units), by Type of Mounting 2024 & 2032
- Figure 41: South America USA Distribution Transformer Market Revenue Share (%), by Type of Mounting 2024 & 2032
- Figure 42: South America USA Distribution Transformer Market Volume Share (%), by Type of Mounting 2024 & 2032
- Figure 43: South America USA Distribution Transformer Market Revenue (Million), by Country 2024 & 2032
- Figure 44: South America USA Distribution Transformer Market Volume (K Units), by Country 2024 & 2032
- Figure 45: South America USA Distribution Transformer Market Revenue Share (%), by Country 2024 & 2032
- Figure 46: South America USA Distribution Transformer Market Volume Share (%), by Country 2024 & 2032
- Figure 47: Europe USA Distribution Transformer Market Revenue (Million), by Power Rating 2024 & 2032
- Figure 48: Europe USA Distribution Transformer Market Volume (K Units), by Power Rating 2024 & 2032
- Figure 49: Europe USA Distribution Transformer Market Revenue Share (%), by Power Rating 2024 & 2032
- Figure 50: Europe USA Distribution Transformer Market Volume Share (%), by Power Rating 2024 & 2032
- Figure 51: Europe USA Distribution Transformer Market Revenue (Million), by Type 2024 & 2032
- Figure 52: Europe USA Distribution Transformer Market Volume (K Units), by Type 2024 & 2032
- Figure 53: Europe USA Distribution Transformer Market Revenue Share (%), by Type 2024 & 2032
- Figure 54: Europe USA Distribution Transformer Market Volume Share (%), by Type 2024 & 2032
- Figure 55: Europe USA Distribution Transformer Market Revenue (Million), by Phase 2024 & 2032
- Figure 56: Europe USA Distribution Transformer Market Volume (K Units), by Phase 2024 & 2032
- Figure 57: Europe USA Distribution Transformer Market Revenue Share (%), by Phase 2024 & 2032
- Figure 58: Europe USA Distribution Transformer Market Volume Share (%), by Phase 2024 & 2032
- Figure 59: Europe USA Distribution Transformer Market Revenue (Million), by Type of Mounting 2024 & 2032
- Figure 60: Europe USA Distribution Transformer Market Volume (K Units), by Type of Mounting 2024 & 2032
- Figure 61: Europe USA Distribution Transformer Market Revenue Share (%), by Type of Mounting 2024 & 2032
- Figure 62: Europe USA Distribution Transformer Market Volume Share (%), by Type of Mounting 2024 & 2032
- Figure 63: Europe USA Distribution Transformer Market Revenue (Million), by Country 2024 & 2032
- Figure 64: Europe USA Distribution Transformer Market Volume (K Units), by Country 2024 & 2032
- Figure 65: Europe USA Distribution Transformer Market Revenue Share (%), by Country 2024 & 2032
- Figure 66: Europe USA Distribution Transformer Market Volume Share (%), by Country 2024 & 2032
- Figure 67: Middle East & Africa USA Distribution Transformer Market Revenue (Million), by Power Rating 2024 & 2032
- Figure 68: Middle East & Africa USA Distribution Transformer Market Volume (K Units), by Power Rating 2024 & 2032
- Figure 69: Middle East & Africa USA Distribution Transformer Market Revenue Share (%), by Power Rating 2024 & 2032
- Figure 70: Middle East & Africa USA Distribution Transformer Market Volume Share (%), by Power Rating 2024 & 2032
- Figure 71: Middle East & Africa USA Distribution Transformer Market Revenue (Million), by Type 2024 & 2032
- Figure 72: Middle East & Africa USA Distribution Transformer Market Volume (K Units), by Type 2024 & 2032
- Figure 73: Middle East & Africa USA Distribution Transformer Market Revenue Share (%), by Type 2024 & 2032
- Figure 74: Middle East & Africa USA Distribution Transformer Market Volume Share (%), by Type 2024 & 2032
- Figure 75: Middle East & Africa USA Distribution Transformer Market Revenue (Million), by Phase 2024 & 2032
- Figure 76: Middle East & Africa USA Distribution Transformer Market Volume (K Units), by Phase 2024 & 2032
- Figure 77: Middle East & Africa USA Distribution Transformer Market Revenue Share (%), by Phase 2024 & 2032
- Figure 78: Middle East & Africa USA Distribution Transformer Market Volume Share (%), by Phase 2024 & 2032
- Figure 79: Middle East & Africa USA Distribution Transformer Market Revenue (Million), by Type of Mounting 2024 & 2032
- Figure 80: Middle East & Africa USA Distribution Transformer Market Volume (K Units), by Type of Mounting 2024 & 2032
- Figure 81: Middle East & Africa USA Distribution Transformer Market Revenue Share (%), by Type of Mounting 2024 & 2032
- Figure 82: Middle East & Africa USA Distribution Transformer Market Volume Share (%), by Type of Mounting 2024 & 2032
- Figure 83: Middle East & Africa USA Distribution Transformer Market Revenue (Million), by Country 2024 & 2032
- Figure 84: Middle East & Africa USA Distribution Transformer Market Volume (K Units), by Country 2024 & 2032
- Figure 85: Middle East & Africa USA Distribution Transformer Market Revenue Share (%), by Country 2024 & 2032
- Figure 86: Middle East & Africa USA Distribution Transformer Market Volume Share (%), by Country 2024 & 2032
- Figure 87: Asia Pacific USA Distribution Transformer Market Revenue (Million), by Power Rating 2024 & 2032
- Figure 88: Asia Pacific USA Distribution Transformer Market Volume (K Units), by Power Rating 2024 & 2032
- Figure 89: Asia Pacific USA Distribution Transformer Market Revenue Share (%), by Power Rating 2024 & 2032
- Figure 90: Asia Pacific USA Distribution Transformer Market Volume Share (%), by Power Rating 2024 & 2032
- Figure 91: Asia Pacific USA Distribution Transformer Market Revenue (Million), by Type 2024 & 2032
- Figure 92: Asia Pacific USA Distribution Transformer Market Volume (K Units), by Type 2024 & 2032
- Figure 93: Asia Pacific USA Distribution Transformer Market Revenue Share (%), by Type 2024 & 2032
- Figure 94: Asia Pacific USA Distribution Transformer Market Volume Share (%), by Type 2024 & 2032
- Figure 95: Asia Pacific USA Distribution Transformer Market Revenue (Million), by Phase 2024 & 2032
- Figure 96: Asia Pacific USA Distribution Transformer Market Volume (K Units), by Phase 2024 & 2032
- Figure 97: Asia Pacific USA Distribution Transformer Market Revenue Share (%), by Phase 2024 & 2032
- Figure 98: Asia Pacific USA Distribution Transformer Market Volume Share (%), by Phase 2024 & 2032
- Figure 99: Asia Pacific USA Distribution Transformer Market Revenue (Million), by Type of Mounting 2024 & 2032
- Figure 100: Asia Pacific USA Distribution Transformer Market Volume (K Units), by Type of Mounting 2024 & 2032
- Figure 101: Asia Pacific USA Distribution Transformer Market Revenue Share (%), by Type of Mounting 2024 & 2032
- Figure 102: Asia Pacific USA Distribution Transformer Market Volume Share (%), by Type of Mounting 2024 & 2032
- Figure 103: Asia Pacific USA Distribution Transformer Market Revenue (Million), by Country 2024 & 2032
- Figure 104: Asia Pacific USA Distribution Transformer Market Volume (K Units), by Country 2024 & 2032
- Figure 105: Asia Pacific USA Distribution Transformer Market Revenue Share (%), by Country 2024 & 2032
- Figure 106: Asia Pacific USA Distribution Transformer Market Volume Share (%), by Country 2024 & 2032
List of Tables
- Table 1: Global USA Distribution Transformer Market Revenue Million Forecast, by Region 2019 & 2032
- Table 2: Global USA Distribution Transformer Market Volume K Units Forecast, by Region 2019 & 2032
- Table 3: Global USA Distribution Transformer Market Revenue Million Forecast, by Power Rating 2019 & 2032
- Table 4: Global USA Distribution Transformer Market Volume K Units Forecast, by Power Rating 2019 & 2032
- Table 5: Global USA Distribution Transformer Market Revenue Million Forecast, by Type 2019 & 2032
- Table 6: Global USA Distribution Transformer Market Volume K Units Forecast, by Type 2019 & 2032
- Table 7: Global USA Distribution Transformer Market Revenue Million Forecast, by Phase 2019 & 2032
- Table 8: Global USA Distribution Transformer Market Volume K Units Forecast, by Phase 2019 & 2032
- Table 9: Global USA Distribution Transformer Market Revenue Million Forecast, by Type of Mounting 2019 & 2032
- Table 10: Global USA Distribution Transformer Market Volume K Units Forecast, by Type of Mounting 2019 & 2032
- Table 11: Global USA Distribution Transformer Market Revenue Million Forecast, by Region 2019 & 2032
- Table 12: Global USA Distribution Transformer Market Volume K Units Forecast, by Region 2019 & 2032
- Table 13: Global USA Distribution Transformer Market Revenue Million Forecast, by Country 2019 & 2032
- Table 14: Global USA Distribution Transformer Market Volume K Units Forecast, by Country 2019 & 2032
- Table 15: Northeast USA Distribution Transformer Market Revenue (Million) Forecast, by Application 2019 & 2032
- Table 16: Northeast USA Distribution Transformer Market Volume (K Units) Forecast, by Application 2019 & 2032
- Table 17: Southeast USA Distribution Transformer Market Revenue (Million) Forecast, by Application 2019 & 2032
- Table 18: Southeast USA Distribution Transformer Market Volume (K Units) Forecast, by Application 2019 & 2032
- Table 19: Midwest USA Distribution Transformer Market Revenue (Million) Forecast, by Application 2019 & 2032
- Table 20: Midwest USA Distribution Transformer Market Volume (K Units) Forecast, by Application 2019 & 2032
- Table 21: Southwest USA Distribution Transformer Market Revenue (Million) Forecast, by Application 2019 & 2032
- Table 22: Southwest USA Distribution Transformer Market Volume (K Units) Forecast, by Application 2019 & 2032
- Table 23: West USA Distribution Transformer Market Revenue (Million) Forecast, by Application 2019 & 2032
- Table 24: West USA Distribution Transformer Market Volume (K Units) Forecast, by Application 2019 & 2032
- Table 25: Global USA Distribution Transformer Market Revenue Million Forecast, by Power Rating 2019 & 2032
- Table 26: Global USA Distribution Transformer Market Volume K Units Forecast, by Power Rating 2019 & 2032
- Table 27: Global USA Distribution Transformer Market Revenue Million Forecast, by Type 2019 & 2032
- Table 28: Global USA Distribution Transformer Market Volume K Units Forecast, by Type 2019 & 2032
- Table 29: Global USA Distribution Transformer Market Revenue Million Forecast, by Phase 2019 & 2032
- Table 30: Global USA Distribution Transformer Market Volume K Units Forecast, by Phase 2019 & 2032
- Table 31: Global USA Distribution Transformer Market Revenue Million Forecast, by Type of Mounting 2019 & 2032
- Table 32: Global USA Distribution Transformer Market Volume K Units Forecast, by Type of Mounting 2019 & 2032
- Table 33: Global USA Distribution Transformer Market Revenue Million Forecast, by Country 2019 & 2032
- Table 34: Global USA Distribution Transformer Market Volume K Units Forecast, by Country 2019 & 2032
- Table 35: United States USA Distribution Transformer Market Revenue (Million) Forecast, by Application 2019 & 2032
- Table 36: United States USA Distribution Transformer Market Volume (K Units) Forecast, by Application 2019 & 2032
- Table 37: Canada USA Distribution Transformer Market Revenue (Million) Forecast, by Application 2019 & 2032
- Table 38: Canada USA Distribution Transformer Market Volume (K Units) Forecast, by Application 2019 & 2032
- Table 39: Mexico USA Distribution Transformer Market Revenue (Million) Forecast, by Application 2019 & 2032
- Table 40: Mexico USA Distribution Transformer Market Volume (K Units) Forecast, by Application 2019 & 2032
- Table 41: Global USA Distribution Transformer Market Revenue Million Forecast, by Power Rating 2019 & 2032
- Table 42: Global USA Distribution Transformer Market Volume K Units Forecast, by Power Rating 2019 & 2032
- Table 43: Global USA Distribution Transformer Market Revenue Million Forecast, by Type 2019 & 2032
- Table 44: Global USA Distribution Transformer Market Volume K Units Forecast, by Type 2019 & 2032
- Table 45: Global USA Distribution Transformer Market Revenue Million Forecast, by Phase 2019 & 2032
- Table 46: Global USA Distribution Transformer Market Volume K Units Forecast, by Phase 2019 & 2032
- Table 47: Global USA Distribution Transformer Market Revenue Million Forecast, by Type of Mounting 2019 & 2032
- Table 48: Global USA Distribution Transformer Market Volume K Units Forecast, by Type of Mounting 2019 & 2032
- Table 49: Global USA Distribution Transformer Market Revenue Million Forecast, by Country 2019 & 2032
- Table 50: Global USA Distribution Transformer Market Volume K Units Forecast, by Country 2019 & 2032
- Table 51: Brazil USA Distribution Transformer Market Revenue (Million) Forecast, by Application 2019 & 2032
- Table 52: Brazil USA Distribution Transformer Market Volume (K Units) Forecast, by Application 2019 & 2032
- Table 53: Argentina USA Distribution Transformer Market Revenue (Million) Forecast, by Application 2019 & 2032
- Table 54: Argentina USA Distribution Transformer Market Volume (K Units) Forecast, by Application 2019 & 2032
- Table 55: Rest of South America USA Distribution Transformer Market Revenue (Million) Forecast, by Application 2019 & 2032
- Table 56: Rest of South America USA Distribution Transformer Market Volume (K Units) Forecast, by Application 2019 & 2032
- Table 57: Global USA Distribution Transformer Market Revenue Million Forecast, by Power Rating 2019 & 2032
- Table 58: Global USA Distribution Transformer Market Volume K Units Forecast, by Power Rating 2019 & 2032
- Table 59: Global USA Distribution Transformer Market Revenue Million Forecast, by Type 2019 & 2032
- Table 60: Global USA Distribution Transformer Market Volume K Units Forecast, by Type 2019 & 2032
- Table 61: Global USA Distribution Transformer Market Revenue Million Forecast, by Phase 2019 & 2032
- Table 62: Global USA Distribution Transformer Market Volume K Units Forecast, by Phase 2019 & 2032
- Table 63: Global USA Distribution Transformer Market Revenue Million Forecast, by Type of Mounting 2019 & 2032
- Table 64: Global USA Distribution Transformer Market Volume K Units Forecast, by Type of Mounting 2019 & 2032
- Table 65: Global USA Distribution Transformer Market Revenue Million Forecast, by Country 2019 & 2032
- Table 66: Global USA Distribution Transformer Market Volume K Units Forecast, by Country 2019 & 2032
- Table 67: United Kingdom USA Distribution Transformer Market Revenue (Million) Forecast, by Application 2019 & 2032
- Table 68: United Kingdom USA Distribution Transformer Market Volume (K Units) Forecast, by Application 2019 & 2032
- Table 69: Germany USA Distribution Transformer Market Revenue (Million) Forecast, by Application 2019 & 2032
- Table 70: Germany USA Distribution Transformer Market Volume (K Units) Forecast, by Application 2019 & 2032
- Table 71: France USA Distribution Transformer Market Revenue (Million) Forecast, by Application 2019 & 2032
- Table 72: France USA Distribution Transformer Market Volume (K Units) Forecast, by Application 2019 & 2032
- Table 73: Italy USA Distribution Transformer Market Revenue (Million) Forecast, by Application 2019 & 2032
- Table 74: Italy USA Distribution Transformer Market Volume (K Units) Forecast, by Application 2019 & 2032
- Table 75: Spain USA Distribution Transformer Market Revenue (Million) Forecast, by Application 2019 & 2032
- Table 76: Spain USA Distribution Transformer Market Volume (K Units) Forecast, by Application 2019 & 2032
- Table 77: Russia USA Distribution Transformer Market Revenue (Million) Forecast, by Application 2019 & 2032
- Table 78: Russia USA Distribution Transformer Market Volume (K Units) Forecast, by Application 2019 & 2032
- Table 79: Benelux USA Distribution Transformer Market Revenue (Million) Forecast, by Application 2019 & 2032
- Table 80: Benelux USA Distribution Transformer Market Volume (K Units) Forecast, by Application 2019 & 2032
- Table 81: Nordics USA Distribution Transformer Market Revenue (Million) Forecast, by Application 2019 & 2032
- Table 82: Nordics USA Distribution Transformer Market Volume (K Units) Forecast, by Application 2019 & 2032
- Table 83: Rest of Europe USA Distribution Transformer Market Revenue (Million) Forecast, by Application 2019 & 2032
- Table 84: Rest of Europe USA Distribution Transformer Market Volume (K Units) Forecast, by Application 2019 & 2032
- Table 85: Global USA Distribution Transformer Market Revenue Million Forecast, by Power Rating 2019 & 2032
- Table 86: Global USA Distribution Transformer Market Volume K Units Forecast, by Power Rating 2019 & 2032
- Table 87: Global USA Distribution Transformer Market Revenue Million Forecast, by Type 2019 & 2032
- Table 88: Global USA Distribution Transformer Market Volume K Units Forecast, by Type 2019 & 2032
- Table 89: Global USA Distribution Transformer Market Revenue Million Forecast, by Phase 2019 & 2032
- Table 90: Global USA Distribution Transformer Market Volume K Units Forecast, by Phase 2019 & 2032
- Table 91: Global USA Distribution Transformer Market Revenue Million Forecast, by Type of Mounting 2019 & 2032
- Table 92: Global USA Distribution Transformer Market Volume K Units Forecast, by Type of Mounting 2019 & 2032
- Table 93: Global USA Distribution Transformer Market Revenue Million Forecast, by Country 2019 & 2032
- Table 94: Global USA Distribution Transformer Market Volume K Units Forecast, by Country 2019 & 2032
- Table 95: Turkey USA Distribution Transformer Market Revenue (Million) Forecast, by Application 2019 & 2032
- Table 96: Turkey USA Distribution Transformer Market Volume (K Units) Forecast, by Application 2019 & 2032
- Table 97: Israel USA Distribution Transformer Market Revenue (Million) Forecast, by Application 2019 & 2032
- Table 98: Israel USA Distribution Transformer Market Volume (K Units) Forecast, by Application 2019 & 2032
- Table 99: GCC USA Distribution Transformer Market Revenue (Million) Forecast, by Application 2019 & 2032
- Table 100: GCC USA Distribution Transformer Market Volume (K Units) Forecast, by Application 2019 & 2032
- Table 101: North Africa USA Distribution Transformer Market Revenue (Million) Forecast, by Application 2019 & 2032
- Table 102: North Africa USA Distribution Transformer Market Volume (K Units) Forecast, by Application 2019 & 2032
- Table 103: South Africa USA Distribution Transformer Market Revenue (Million) Forecast, by Application 2019 & 2032
- Table 104: South Africa USA Distribution Transformer Market Volume (K Units) Forecast, by Application 2019 & 2032
- Table 105: Rest of Middle East & Africa USA Distribution Transformer Market Revenue (Million) Forecast, by Application 2019 & 2032
- Table 106: Rest of Middle East & Africa USA Distribution Transformer Market Volume (K Units) Forecast, by Application 2019 & 2032
- Table 107: Global USA Distribution Transformer Market Revenue Million Forecast, by Power Rating 2019 & 2032
- Table 108: Global USA Distribution Transformer Market Volume K Units Forecast, by Power Rating 2019 & 2032
- Table 109: Global USA Distribution Transformer Market Revenue Million Forecast, by Type 2019 & 2032
- Table 110: Global USA Distribution Transformer Market Volume K Units Forecast, by Type 2019 & 2032
- Table 111: Global USA Distribution Transformer Market Revenue Million Forecast, by Phase 2019 & 2032
- Table 112: Global USA Distribution Transformer Market Volume K Units Forecast, by Phase 2019 & 2032
- Table 113: Global USA Distribution Transformer Market Revenue Million Forecast, by Type of Mounting 2019 & 2032
- Table 114: Global USA Distribution Transformer Market Volume K Units Forecast, by Type of Mounting 2019 & 2032
- Table 115: Global USA Distribution Transformer Market Revenue Million Forecast, by Country 2019 & 2032
- Table 116: Global USA Distribution Transformer Market Volume K Units Forecast, by Country 2019 & 2032
- Table 117: China USA Distribution Transformer Market Revenue (Million) Forecast, by Application 2019 & 2032
- Table 118: China USA Distribution Transformer Market Volume (K Units) Forecast, by Application 2019 & 2032
- Table 119: India USA Distribution Transformer Market Revenue (Million) Forecast, by Application 2019 & 2032
- Table 120: India USA Distribution Transformer Market Volume (K Units) Forecast, by Application 2019 & 2032
- Table 121: Japan USA Distribution Transformer Market Revenue (Million) Forecast, by Application 2019 & 2032
- Table 122: Japan USA Distribution Transformer Market Volume (K Units) Forecast, by Application 2019 & 2032
- Table 123: South Korea USA Distribution Transformer Market Revenue (Million) Forecast, by Application 2019 & 2032
- Table 124: South Korea USA Distribution Transformer Market Volume (K Units) Forecast, by Application 2019 & 2032
- Table 125: ASEAN USA Distribution Transformer Market Revenue (Million) Forecast, by Application 2019 & 2032
- Table 126: ASEAN USA Distribution Transformer Market Volume (K Units) Forecast, by Application 2019 & 2032
- Table 127: Oceania USA Distribution Transformer Market Revenue (Million) Forecast, by Application 2019 & 2032
- Table 128: Oceania USA Distribution Transformer Market Volume (K Units) Forecast, by Application 2019 & 2032
- Table 129: Rest of Asia Pacific USA Distribution Transformer Market Revenue (Million) Forecast, by Application 2019 & 2032
- Table 130: Rest of Asia Pacific USA Distribution Transformer Market Volume (K Units) Forecast, by Application 2019 & 2032
Frequently Asked Questions
1. What is the projected Compound Annual Growth Rate (CAGR) of the USA Distribution Transformer Market?
The projected CAGR is approximately 3.75%.
2. Which companies are prominent players in the USA Distribution Transformer Market?
Key companies in the market include Kirloskar Electric Company Ltd, Toshiba Corp*List Not Exhaustive, Hyundai Electric & Energy Systems Co Ltd, Hitachi Ltd, Emerson Electric Co, Siemens AG, Schneider Electric SE, Eaton Corporation PLC, Southwest Electric Co, General Electric Company.
3. What are the main segments of the USA Distribution Transformer Market?
The market segments include Power Rating, Type, Phase, Type of Mounting.
4. Can you provide details about the market size?
The market size is estimated to be USD XX Million as of 2022.
5. What are some drivers contributing to market growth?
4.; Rising Power Demand4.; Substantial Investments And Efforts To Modernize The T&D Grid.
6. What are the notable trends driving market growth?
High Voltage Segment Expected to Dominate the Market.
7. Are there any restraints impacting market growth?
4.; Rising Distributed Energy Generation.
8. Can you provide examples of recent developments in the market?
May 2022: Hitachi Energy revealed plans to invest more than USD 10 million to expand and improve its distribution transformer facility in Jefferson City, Missouri. The investment was expected to provide additional capacity and enhance its manufacturing capabilities.
9. What pricing options are available for accessing the report?
Pricing options include single-user, multi-user, and enterprise licenses priced at USD 3800, USD 4500, and USD 5800 respectively.
10. Is the market size provided in terms of value or volume?
The market size is provided in terms of value, measured in Million and volume, measured in K Units.
11. Are there any specific market keywords associated with the report?
Yes, the market keyword associated with the report is "USA Distribution Transformer Market," which aids in identifying and referencing the specific market segment covered.
12. How do I determine which pricing option suits my needs best?
The pricing options vary based on user requirements and access needs. Individual users may opt for single-user licenses, while businesses requiring broader access may choose multi-user or enterprise licenses for cost-effective access to the report.
13. Are there any additional resources or data provided in the USA Distribution Transformer Market report?
While the report offers comprehensive insights, it's advisable to review the specific contents or supplementary materials provided to ascertain if additional resources or data are available.
14. How can I stay updated on further developments or reports in the USA Distribution Transformer Market?
To stay informed about further developments, trends, and reports in the USA Distribution Transformer Market, consider subscribing to industry newsletters, following relevant companies and organizations, or regularly checking reputable industry news sources and publications.
Methodology
Step 1 - Identification of Relevant Samples Size from Population Database


Step 2 - Approaches for Defining Global Market Size (Value, Volume* & Price*)

Note*: In applicable scenarios
Step 3 - Data Sources
Primary Research
- Web Analytics
- Survey Reports
- Research Institute
- Latest Research Reports
- Opinion Leaders
Secondary Research
- Annual Reports
- White Paper
- Latest Press Release
- Industry Association
- Paid Database
- Investor Presentations

Step 4 - Data Triangulation
Involves using different sources of information in order to increase the validity of a study
These sources are likely to be stakeholders in a program - participants, other researchers, program staff, other community members, and so on.
Then we put all data in single framework & apply various statistical tools to find out the dynamic on the market.
During the analysis stage, feedback from the stakeholder groups would be compared to determine areas of agreement as well as areas of divergence


