
Key Insights
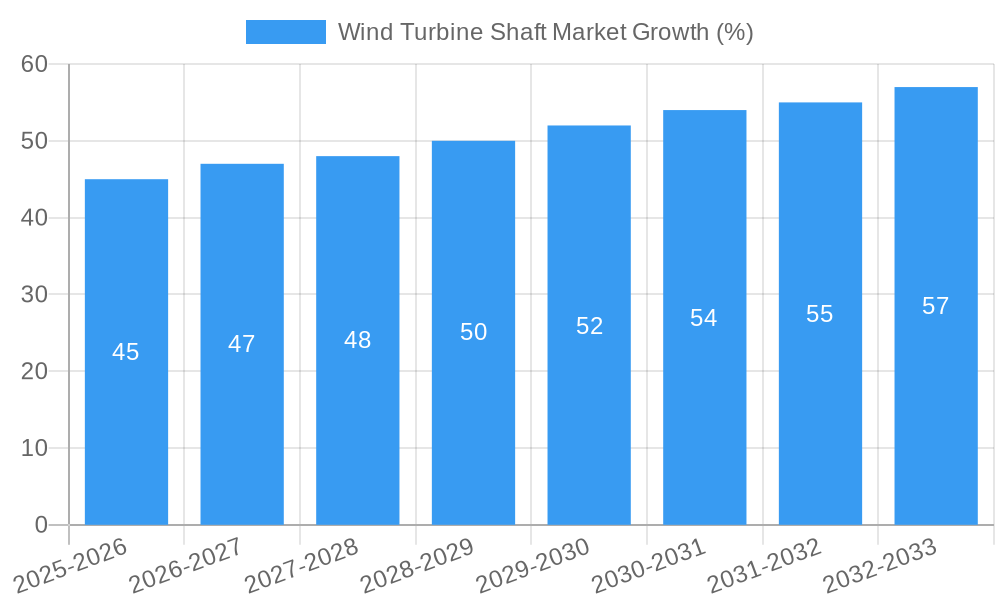
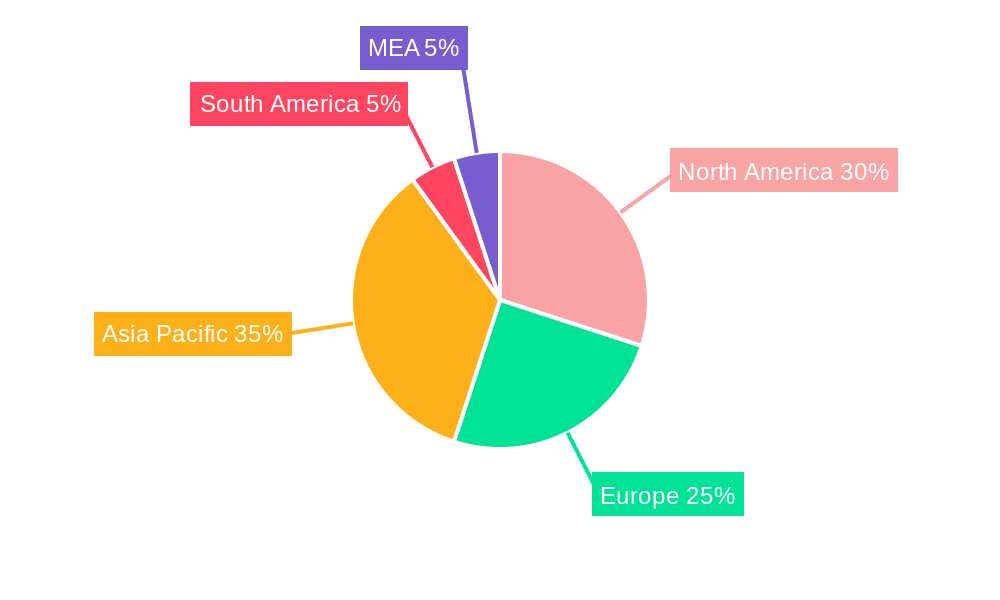
The global wind turbine shaft market is experiencing robust growth, driven by the increasing demand for renewable energy sources and supportive government policies promoting wind power adoption worldwide. A compound annual growth rate (CAGR) exceeding 3% indicates a steadily expanding market, projected to reach significant value over the forecast period (2025-2033). Key drivers include the rising global energy consumption, stringent environmental regulations aimed at reducing carbon emissions, and the decreasing cost of wind energy technology, making it a more competitive power source. Market segmentation by location of deployment (onshore and offshore) highlights distinct growth patterns, with offshore wind farms potentially exhibiting higher growth rates due to larger turbine sizes and higher energy yields, although they face greater infrastructure and installation challenges. Leading manufacturers like Broadwind Energy, Luoyang Yujie, Sany Group, and Liebherr Group are actively shaping the market landscape through technological innovation and strategic expansions. Geographical distribution shows strong performance in North America and Asia-Pacific regions, fueled by significant investments in wind energy projects and robust economic growth. While challenges exist, such as supply chain disruptions and material cost fluctuations, the overall market outlook remains positive, driven by sustained global demand for cleaner energy solutions.
The market's continued expansion is largely dependent on ongoing technological advancements leading to improved shaft designs, enhanced durability, and cost reductions. Further growth hinges on the successful integration of wind energy into existing power grids and the development of more efficient energy storage solutions to address the intermittent nature of wind power generation. Government incentives, including tax credits and subsidies, continue to play a crucial role in stimulating investments in wind energy projects, indirectly boosting the wind turbine shaft market. Competitive dynamics among major players are intense, characterized by a focus on product differentiation, technological innovation, and strategic partnerships to secure market share. The evolving landscape also sees a growing emphasis on sustainability throughout the entire wind turbine lifecycle, from raw material sourcing to end-of-life management. This commitment to environmental responsibility enhances the market's long-term prospects and fosters greater consumer confidence.
Wind Turbine Shaft Market: A Comprehensive Analysis (2019-2033)
This comprehensive report provides an in-depth analysis of the global Wind Turbine Shaft Market, offering actionable insights for stakeholders across the renewable energy sector. The study covers the period from 2019 to 2033, with 2025 serving as the base and estimated year. The report meticulously examines market dynamics, competitive landscapes, and future growth potential, encompassing crucial segments and key players. It leverages extensive primary and secondary research to deliver accurate and reliable market sizing and forecasting. The total market value in 2025 is estimated at xx Million, projected to reach xx Million by 2033, exhibiting a CAGR of xx% during the forecast period (2025-2033).
Wind Turbine Shaft Market Market Concentration & Innovation
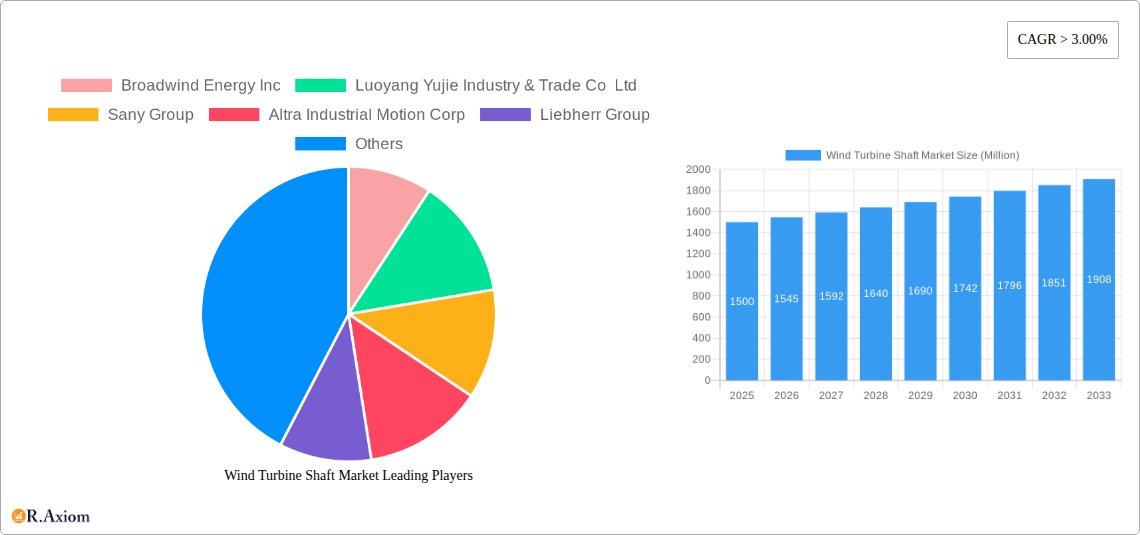
The Wind Turbine Shaft market exhibits a moderately concentrated landscape, with a handful of major players holding significant market share. The top five companies, including Broadwind Energy Inc, Luoyang Yujie Industry & Trade Co Ltd, Sany Group, Altra Industrial Motion Corp, and Liebherr Group, collectively account for approximately xx% of the global market in 2025. However, the market also features several smaller, regional players that contribute significantly to overall market volume. Innovation is a key driver, with continuous advancements in materials science (e.g., the use of advanced composites) and manufacturing processes leading to lighter, more efficient, and durable shafts. Stringent regulatory frameworks concerning safety and environmental impact further fuel innovation. While direct substitutes are limited, improvements in other wind turbine components might indirectly impact demand. Mergers and acquisitions (M&A) activities are relatively frequent, reflecting consolidation within the industry and efforts to enhance technological capabilities. Recent M&A activity saw a total deal value of approximately xx Million in 2024.
Wind Turbine Shaft Market Industry Trends & Insights
The global Wind Turbine Shaft market is experiencing robust growth, driven primarily by the escalating global demand for renewable energy and supportive government policies promoting wind energy adoption. The increasing focus on reducing carbon emissions and achieving climate change goals is a major impetus. The market is witnessing a significant shift towards larger capacity wind turbines, particularly in the offshore sector, leading to higher demand for larger and more robust shafts. Technological disruptions, such as the development of advanced materials and manufacturing techniques, are enhancing the efficiency, durability, and cost-effectiveness of wind turbine shafts. Consumer preferences are increasingly leaning towards sustainable and environmentally friendly energy sources, positively impacting market growth. Competitive dynamics are characterized by intense competition among established players and the emergence of new entrants, driving innovation and price competition. The market is expected to witness a CAGR of xx% during the forecast period, with a significant market penetration in both onshore and offshore deployments.
Dominant Markets & Segments in Wind Turbine Shaft Market
The onshore wind turbine shaft segment currently dominates the market, accounting for approximately xx% of the global market share in 2025. This dominance is primarily attributed to the larger installed base of onshore wind farms compared to offshore installations.
- Key Drivers for Onshore Dominance:
- Lower initial investment costs compared to offshore projects.
- Easier access and faster installation times.
- Established supply chains and infrastructure.
- Government incentives and supportive policies in several regions.
However, the offshore segment is exhibiting rapid growth, driven by favorable government policies, the availability of stronger and more consistent wind resources, and technological advancements enabling the construction of larger offshore wind farms. The offshore segment is anticipated to exhibit a higher CAGR compared to the onshore segment over the forecast period, particularly in regions with substantial offshore wind resources, such as Europe and Asia. China and the USA are anticipated to lead the market. Europe holds a significant market share due to strong governmental support and technological advancements in offshore wind energy.
Wind Turbine Shaft Market Product Developments
Recent product innovations have focused on enhancing the fatigue life, reducing weight, and improving the efficiency of wind turbine shafts. The use of advanced materials like high-strength steel alloys and composites is becoming increasingly prevalent, enabling the design of lighter and more durable shafts. Furthermore, improvements in manufacturing techniques, such as advanced forging and machining processes, contribute to higher precision and reduced manufacturing costs. These innovations enable wind turbine manufacturers to create more efficient and cost-effective wind energy systems, enhancing the overall competitiveness of wind power.
Report Scope & Segmentation Analysis
This report segments the Wind Turbine Shaft market based on Location of Deployment: Onshore and Offshore.
Onshore: This segment comprises shafts used in wind turbines located on land. The market size in 2025 is estimated at xx Million, expected to reach xx Million by 2033, demonstrating significant growth driven by increasing onshore wind farm installations globally. Competitive dynamics are marked by a combination of established players and emerging regional manufacturers.
Offshore: This segment includes shafts for wind turbines installed in offshore environments. The market size in 2025 is estimated at xx Million, with projections reaching xx Million by 2033, exhibiting robust growth due to the expansion of offshore wind capacity and the increasing demand for larger capacity turbines. Competition is characterized by a smaller number of major players with advanced technologies and expertise in offshore projects.
Key Drivers of Wind Turbine Shaft Market Growth
The growth of the Wind Turbine Shaft market is propelled by several key factors. Firstly, the global push for renewable energy sources, coupled with stringent environmental regulations, significantly increases the demand for wind energy. Secondly, technological advancements in wind turbine design and manufacturing lead to improved efficiency and cost reductions, thereby bolstering market growth. Thirdly, supportive government policies and subsidies in various countries promote wind energy development, fostering further market expansion.
Challenges in the Wind Turbine Shaft Market Sector
The Wind Turbine Shaft market faces challenges such as the volatility of raw material prices, impacting manufacturing costs. Supply chain disruptions can lead to delays in project completion. Intense competition among manufacturers exerts pressure on pricing and profit margins. Furthermore, stringent quality and safety regulations necessitate compliance, adding to operational costs. Finally, the cyclical nature of the renewable energy sector can affect investment levels and market demand.
Emerging Opportunities in Wind Turbine Shaft Market
Emerging opportunities lie in the expansion of offshore wind energy projects, particularly in regions with abundant wind resources. Advancements in materials science and manufacturing techniques present opportunities for developing lighter, stronger, and more efficient shafts. The increasing demand for larger capacity wind turbines creates opportunities for specialized shaft manufacturing. Finally, the development of innovative maintenance and monitoring solutions can improve operational efficiency and extend the lifespan of wind turbine shafts.
Leading Players in the Wind Turbine Shaft Market Market
- Broadwind Energy Inc
- Luoyang Yujie Industry & Trade Co Ltd
- Sany Group
- Altra Industrial Motion Corp
- Liebherr Group
- Western Machine Works Inc
- Siemens Gamesa Renewable Energy
- Jiangyin Zenkung Forging Co
- Wuxi Solar Wind Energy Technology Co Ltd
- Schaeffler Technologies AG & Co KG
Key Developments in Wind Turbine Shaft Market Industry
- Q1 2023: Broadwind Energy Inc. announced a new contract for the supply of wind turbine shafts for a major wind farm project in the US.
- Q3 2022: Liebherr Group unveiled a new generation of wind turbine shafts featuring improved fatigue life and reduced weight.
- Q4 2021: Siemens Gamesa Renewable Energy and Altra Industrial Motion Corp. formed a strategic partnership to develop next-generation wind turbine shaft technologies.
Strategic Outlook for Wind Turbine Shaft Market Market
The future of the Wind Turbine Shaft market appears bright, driven by the sustained global growth of the renewable energy sector. The increasing adoption of wind energy, especially offshore, will continue to fuel demand for high-performance wind turbine shafts. Technological innovation, particularly in materials science and manufacturing, will play a crucial role in shaping market dynamics. Strategic partnerships and collaborations among manufacturers will be essential in fostering innovation and enhancing competitiveness. The market is expected to witness significant expansion, presenting lucrative opportunities for existing and new players alike.
Wind Turbine Shaft Market Segmentation
-
1. Location of Deployment
- 1.1. Onshore
- 1.2. Offshore
Wind Turbine Shaft Market Segmentation By Geography
- 1. North America
- 2. Asia Pacific
- 3. Europe
- 4. South America
- 5. Middle East and Africa
Wind Turbine Shaft Market REPORT HIGHLIGHTS
| Aspects | Details |
|---|---|
| Study Period | 2019-2033 |
| Base Year | 2024 |
| Estimated Year | 2025 |
| Forecast Period | 2025-2033 |
| Historical Period | 2019-2024 |
| Growth Rate | CAGR of > 3.00% from 2019-2033 |
| Segmentation |
|
Table of Contents
- 1. Introduction
- 1.1. Research Scope
- 1.2. Market Segmentation
- 1.3. Research Methodology
- 1.4. Definitions and Assumptions
- 2. Executive Summary
- 2.1. Introduction
- 3. Market Dynamics
- 3.1. Introduction
- 3.2. Market Drivers
- 3.2.1. 4.; Increasing Automotive Sales in Saudi Arabia4.; Rising Demand from Heavy Automotives
- 3.3. Market Restrains
- 3.3.1. 4.; Rising Emphasis on Electric Vehicles
- 3.4. Market Trends
- 3.4.1. Onshore Wind Turbine Shaft to Dominate the Market
- 4. Market Factor Analysis
- 4.1. Porters Five Forces
- 4.2. Supply/Value Chain
- 4.3. PESTEL analysis
- 4.4. Market Entropy
- 4.5. Patent/Trademark Analysis
- 5. Global Wind Turbine Shaft Market Analysis, Insights and Forecast, 2019-2031
- 5.1. Market Analysis, Insights and Forecast - by Location of Deployment
- 5.1.1. Onshore
- 5.1.2. Offshore
- 5.2. Market Analysis, Insights and Forecast - by Region
- 5.2.1. North America
- 5.2.2. Asia Pacific
- 5.2.3. Europe
- 5.2.4. South America
- 5.2.5. Middle East and Africa
- 5.1. Market Analysis, Insights and Forecast - by Location of Deployment
- 6. North America Wind Turbine Shaft Market Analysis, Insights and Forecast, 2019-2031
- 6.1. Market Analysis, Insights and Forecast - by Location of Deployment
- 6.1.1. Onshore
- 6.1.2. Offshore
- 6.1. Market Analysis, Insights and Forecast - by Location of Deployment
- 7. Asia Pacific Wind Turbine Shaft Market Analysis, Insights and Forecast, 2019-2031
- 7.1. Market Analysis, Insights and Forecast - by Location of Deployment
- 7.1.1. Onshore
- 7.1.2. Offshore
- 7.1. Market Analysis, Insights and Forecast - by Location of Deployment
- 8. Europe Wind Turbine Shaft Market Analysis, Insights and Forecast, 2019-2031
- 8.1. Market Analysis, Insights and Forecast - by Location of Deployment
- 8.1.1. Onshore
- 8.1.2. Offshore
- 8.1. Market Analysis, Insights and Forecast - by Location of Deployment
- 9. South America Wind Turbine Shaft Market Analysis, Insights and Forecast, 2019-2031
- 9.1. Market Analysis, Insights and Forecast - by Location of Deployment
- 9.1.1. Onshore
- 9.1.2. Offshore
- 9.1. Market Analysis, Insights and Forecast - by Location of Deployment
- 10. Middle East and Africa Wind Turbine Shaft Market Analysis, Insights and Forecast, 2019-2031
- 10.1. Market Analysis, Insights and Forecast - by Location of Deployment
- 10.1.1. Onshore
- 10.1.2. Offshore
- 10.1. Market Analysis, Insights and Forecast - by Location of Deployment
- 11. North America Wind Turbine Shaft Market Analysis, Insights and Forecast, 2019-2031
- 11.1. Market Analysis, Insights and Forecast - By Country/Sub-region
- 11.1.1 United States
- 11.1.2 Canada
- 11.1.3 Mexico
- 12. Europe Wind Turbine Shaft Market Analysis, Insights and Forecast, 2019-2031
- 12.1. Market Analysis, Insights and Forecast - By Country/Sub-region
- 12.1.1 Germany
- 12.1.2 United Kingdom
- 12.1.3 France
- 12.1.4 Spain
- 12.1.5 Italy
- 12.1.6 Spain
- 12.1.7 Belgium
- 12.1.8 Netherland
- 12.1.9 Nordics
- 12.1.10 Rest of Europe
- 13. Asia Pacific Wind Turbine Shaft Market Analysis, Insights and Forecast, 2019-2031
- 13.1. Market Analysis, Insights and Forecast - By Country/Sub-region
- 13.1.1 China
- 13.1.2 Japan
- 13.1.3 India
- 13.1.4 South Korea
- 13.1.5 Southeast Asia
- 13.1.6 Australia
- 13.1.7 Indonesia
- 13.1.8 Phillipes
- 13.1.9 Singapore
- 13.1.10 Thailandc
- 13.1.11 Rest of Asia Pacific
- 14. South America Wind Turbine Shaft Market Analysis, Insights and Forecast, 2019-2031
- 14.1. Market Analysis, Insights and Forecast - By Country/Sub-region
- 14.1.1 Brazil
- 14.1.2 Argentina
- 14.1.3 Peru
- 14.1.4 Chile
- 14.1.5 Colombia
- 14.1.6 Ecuador
- 14.1.7 Venezuela
- 14.1.8 Rest of South America
- 15. MEA Wind Turbine Shaft Market Analysis, Insights and Forecast, 2019-2031
- 15.1. Market Analysis, Insights and Forecast - By Country/Sub-region
- 15.1.1 United Arab Emirates
- 15.1.2 Saudi Arabia
- 15.1.3 South Africa
- 15.1.4 Rest of Middle East and Africa
- 16. Competitive Analysis
- 16.1. Global Market Share Analysis 2024
- 16.2. Company Profiles
- 16.2.1 Broadwind Energy Inc
- 16.2.1.1. Overview
- 16.2.1.2. Products
- 16.2.1.3. SWOT Analysis
- 16.2.1.4. Recent Developments
- 16.2.1.5. Financials (Based on Availability)
- 16.2.2 Luoyang Yujie Industry & Trade Co Ltd
- 16.2.2.1. Overview
- 16.2.2.2. Products
- 16.2.2.3. SWOT Analysis
- 16.2.2.4. Recent Developments
- 16.2.2.5. Financials (Based on Availability)
- 16.2.3 Sany Group
- 16.2.3.1. Overview
- 16.2.3.2. Products
- 16.2.3.3. SWOT Analysis
- 16.2.3.4. Recent Developments
- 16.2.3.5. Financials (Based on Availability)
- 16.2.4 Altra Industrial Motion Corp
- 16.2.4.1. Overview
- 16.2.4.2. Products
- 16.2.4.3. SWOT Analysis
- 16.2.4.4. Recent Developments
- 16.2.4.5. Financials (Based on Availability)
- 16.2.5 Liebherr Group
- 16.2.5.1. Overview
- 16.2.5.2. Products
- 16.2.5.3. SWOT Analysis
- 16.2.5.4. Recent Developments
- 16.2.5.5. Financials (Based on Availability)
- 16.2.6 Western Machine Works Inc
- 16.2.6.1. Overview
- 16.2.6.2. Products
- 16.2.6.3. SWOT Analysis
- 16.2.6.4. Recent Developments
- 16.2.6.5. Financials (Based on Availability)
- 16.2.7 Siemens Gamesa Renewable Energy
- 16.2.7.1. Overview
- 16.2.7.2. Products
- 16.2.7.3. SWOT Analysis
- 16.2.7.4. Recent Developments
- 16.2.7.5. Financials (Based on Availability)
- 16.2.8 Jiangyin Zenkung Forging Co
- 16.2.8.1. Overview
- 16.2.8.2. Products
- 16.2.8.3. SWOT Analysis
- 16.2.8.4. Recent Developments
- 16.2.8.5. Financials (Based on Availability)
- 16.2.9 Wuxi Solar Wind Energy Technology Co Ltd
- 16.2.9.1. Overview
- 16.2.9.2. Products
- 16.2.9.3. SWOT Analysis
- 16.2.9.4. Recent Developments
- 16.2.9.5. Financials (Based on Availability)
- 16.2.10 Schaeffler Technologies AG & Co KG
- 16.2.10.1. Overview
- 16.2.10.2. Products
- 16.2.10.3. SWOT Analysis
- 16.2.10.4. Recent Developments
- 16.2.10.5. Financials (Based on Availability)
- 16.2.1 Broadwind Energy Inc
List of Figures
- Figure 1: Global Wind Turbine Shaft Market Revenue Breakdown (Million, %) by Region 2024 & 2032
- Figure 2: Global Wind Turbine Shaft Market Volume Breakdown (K Unit, %) by Region 2024 & 2032
- Figure 3: North America Wind Turbine Shaft Market Revenue (Million), by Country 2024 & 2032
- Figure 4: North America Wind Turbine Shaft Market Volume (K Unit), by Country 2024 & 2032
- Figure 5: North America Wind Turbine Shaft Market Revenue Share (%), by Country 2024 & 2032
- Figure 6: North America Wind Turbine Shaft Market Volume Share (%), by Country 2024 & 2032
- Figure 7: Europe Wind Turbine Shaft Market Revenue (Million), by Country 2024 & 2032
- Figure 8: Europe Wind Turbine Shaft Market Volume (K Unit), by Country 2024 & 2032
- Figure 9: Europe Wind Turbine Shaft Market Revenue Share (%), by Country 2024 & 2032
- Figure 10: Europe Wind Turbine Shaft Market Volume Share (%), by Country 2024 & 2032
- Figure 11: Asia Pacific Wind Turbine Shaft Market Revenue (Million), by Country 2024 & 2032
- Figure 12: Asia Pacific Wind Turbine Shaft Market Volume (K Unit), by Country 2024 & 2032
- Figure 13: Asia Pacific Wind Turbine Shaft Market Revenue Share (%), by Country 2024 & 2032
- Figure 14: Asia Pacific Wind Turbine Shaft Market Volume Share (%), by Country 2024 & 2032
- Figure 15: South America Wind Turbine Shaft Market Revenue (Million), by Country 2024 & 2032
- Figure 16: South America Wind Turbine Shaft Market Volume (K Unit), by Country 2024 & 2032
- Figure 17: South America Wind Turbine Shaft Market Revenue Share (%), by Country 2024 & 2032
- Figure 18: South America Wind Turbine Shaft Market Volume Share (%), by Country 2024 & 2032
- Figure 19: MEA Wind Turbine Shaft Market Revenue (Million), by Country 2024 & 2032
- Figure 20: MEA Wind Turbine Shaft Market Volume (K Unit), by Country 2024 & 2032
- Figure 21: MEA Wind Turbine Shaft Market Revenue Share (%), by Country 2024 & 2032
- Figure 22: MEA Wind Turbine Shaft Market Volume Share (%), by Country 2024 & 2032
- Figure 23: North America Wind Turbine Shaft Market Revenue (Million), by Location of Deployment 2024 & 2032
- Figure 24: North America Wind Turbine Shaft Market Volume (K Unit), by Location of Deployment 2024 & 2032
- Figure 25: North America Wind Turbine Shaft Market Revenue Share (%), by Location of Deployment 2024 & 2032
- Figure 26: North America Wind Turbine Shaft Market Volume Share (%), by Location of Deployment 2024 & 2032
- Figure 27: North America Wind Turbine Shaft Market Revenue (Million), by Country 2024 & 2032
- Figure 28: North America Wind Turbine Shaft Market Volume (K Unit), by Country 2024 & 2032
- Figure 29: North America Wind Turbine Shaft Market Revenue Share (%), by Country 2024 & 2032
- Figure 30: North America Wind Turbine Shaft Market Volume Share (%), by Country 2024 & 2032
- Figure 31: Asia Pacific Wind Turbine Shaft Market Revenue (Million), by Location of Deployment 2024 & 2032
- Figure 32: Asia Pacific Wind Turbine Shaft Market Volume (K Unit), by Location of Deployment 2024 & 2032
- Figure 33: Asia Pacific Wind Turbine Shaft Market Revenue Share (%), by Location of Deployment 2024 & 2032
- Figure 34: Asia Pacific Wind Turbine Shaft Market Volume Share (%), by Location of Deployment 2024 & 2032
- Figure 35: Asia Pacific Wind Turbine Shaft Market Revenue (Million), by Country 2024 & 2032
- Figure 36: Asia Pacific Wind Turbine Shaft Market Volume (K Unit), by Country 2024 & 2032
- Figure 37: Asia Pacific Wind Turbine Shaft Market Revenue Share (%), by Country 2024 & 2032
- Figure 38: Asia Pacific Wind Turbine Shaft Market Volume Share (%), by Country 2024 & 2032
- Figure 39: Europe Wind Turbine Shaft Market Revenue (Million), by Location of Deployment 2024 & 2032
- Figure 40: Europe Wind Turbine Shaft Market Volume (K Unit), by Location of Deployment 2024 & 2032
- Figure 41: Europe Wind Turbine Shaft Market Revenue Share (%), by Location of Deployment 2024 & 2032
- Figure 42: Europe Wind Turbine Shaft Market Volume Share (%), by Location of Deployment 2024 & 2032
- Figure 43: Europe Wind Turbine Shaft Market Revenue (Million), by Country 2024 & 2032
- Figure 44: Europe Wind Turbine Shaft Market Volume (K Unit), by Country 2024 & 2032
- Figure 45: Europe Wind Turbine Shaft Market Revenue Share (%), by Country 2024 & 2032
- Figure 46: Europe Wind Turbine Shaft Market Volume Share (%), by Country 2024 & 2032
- Figure 47: South America Wind Turbine Shaft Market Revenue (Million), by Location of Deployment 2024 & 2032
- Figure 48: South America Wind Turbine Shaft Market Volume (K Unit), by Location of Deployment 2024 & 2032
- Figure 49: South America Wind Turbine Shaft Market Revenue Share (%), by Location of Deployment 2024 & 2032
- Figure 50: South America Wind Turbine Shaft Market Volume Share (%), by Location of Deployment 2024 & 2032
- Figure 51: South America Wind Turbine Shaft Market Revenue (Million), by Country 2024 & 2032
- Figure 52: South America Wind Turbine Shaft Market Volume (K Unit), by Country 2024 & 2032
- Figure 53: South America Wind Turbine Shaft Market Revenue Share (%), by Country 2024 & 2032
- Figure 54: South America Wind Turbine Shaft Market Volume Share (%), by Country 2024 & 2032
- Figure 55: Middle East and Africa Wind Turbine Shaft Market Revenue (Million), by Location of Deployment 2024 & 2032
- Figure 56: Middle East and Africa Wind Turbine Shaft Market Volume (K Unit), by Location of Deployment 2024 & 2032
- Figure 57: Middle East and Africa Wind Turbine Shaft Market Revenue Share (%), by Location of Deployment 2024 & 2032
- Figure 58: Middle East and Africa Wind Turbine Shaft Market Volume Share (%), by Location of Deployment 2024 & 2032
- Figure 59: Middle East and Africa Wind Turbine Shaft Market Revenue (Million), by Country 2024 & 2032
- Figure 60: Middle East and Africa Wind Turbine Shaft Market Volume (K Unit), by Country 2024 & 2032
- Figure 61: Middle East and Africa Wind Turbine Shaft Market Revenue Share (%), by Country 2024 & 2032
- Figure 62: Middle East and Africa Wind Turbine Shaft Market Volume Share (%), by Country 2024 & 2032
List of Tables
- Table 1: Global Wind Turbine Shaft Market Revenue Million Forecast, by Region 2019 & 2032
- Table 2: Global Wind Turbine Shaft Market Volume K Unit Forecast, by Region 2019 & 2032
- Table 3: Global Wind Turbine Shaft Market Revenue Million Forecast, by Location of Deployment 2019 & 2032
- Table 4: Global Wind Turbine Shaft Market Volume K Unit Forecast, by Location of Deployment 2019 & 2032
- Table 5: Global Wind Turbine Shaft Market Revenue Million Forecast, by Region 2019 & 2032
- Table 6: Global Wind Turbine Shaft Market Volume K Unit Forecast, by Region 2019 & 2032
- Table 7: Global Wind Turbine Shaft Market Revenue Million Forecast, by Country 2019 & 2032
- Table 8: Global Wind Turbine Shaft Market Volume K Unit Forecast, by Country 2019 & 2032
- Table 9: United States Wind Turbine Shaft Market Revenue (Million) Forecast, by Application 2019 & 2032
- Table 10: United States Wind Turbine Shaft Market Volume (K Unit) Forecast, by Application 2019 & 2032
- Table 11: Canada Wind Turbine Shaft Market Revenue (Million) Forecast, by Application 2019 & 2032
- Table 12: Canada Wind Turbine Shaft Market Volume (K Unit) Forecast, by Application 2019 & 2032
- Table 13: Mexico Wind Turbine Shaft Market Revenue (Million) Forecast, by Application 2019 & 2032
- Table 14: Mexico Wind Turbine Shaft Market Volume (K Unit) Forecast, by Application 2019 & 2032
- Table 15: Global Wind Turbine Shaft Market Revenue Million Forecast, by Country 2019 & 2032
- Table 16: Global Wind Turbine Shaft Market Volume K Unit Forecast, by Country 2019 & 2032
- Table 17: Germany Wind Turbine Shaft Market Revenue (Million) Forecast, by Application 2019 & 2032
- Table 18: Germany Wind Turbine Shaft Market Volume (K Unit) Forecast, by Application 2019 & 2032
- Table 19: United Kingdom Wind Turbine Shaft Market Revenue (Million) Forecast, by Application 2019 & 2032
- Table 20: United Kingdom Wind Turbine Shaft Market Volume (K Unit) Forecast, by Application 2019 & 2032
- Table 21: France Wind Turbine Shaft Market Revenue (Million) Forecast, by Application 2019 & 2032
- Table 22: France Wind Turbine Shaft Market Volume (K Unit) Forecast, by Application 2019 & 2032
- Table 23: Spain Wind Turbine Shaft Market Revenue (Million) Forecast, by Application 2019 & 2032
- Table 24: Spain Wind Turbine Shaft Market Volume (K Unit) Forecast, by Application 2019 & 2032
- Table 25: Italy Wind Turbine Shaft Market Revenue (Million) Forecast, by Application 2019 & 2032
- Table 26: Italy Wind Turbine Shaft Market Volume (K Unit) Forecast, by Application 2019 & 2032
- Table 27: Spain Wind Turbine Shaft Market Revenue (Million) Forecast, by Application 2019 & 2032
- Table 28: Spain Wind Turbine Shaft Market Volume (K Unit) Forecast, by Application 2019 & 2032
- Table 29: Belgium Wind Turbine Shaft Market Revenue (Million) Forecast, by Application 2019 & 2032
- Table 30: Belgium Wind Turbine Shaft Market Volume (K Unit) Forecast, by Application 2019 & 2032
- Table 31: Netherland Wind Turbine Shaft Market Revenue (Million) Forecast, by Application 2019 & 2032
- Table 32: Netherland Wind Turbine Shaft Market Volume (K Unit) Forecast, by Application 2019 & 2032
- Table 33: Nordics Wind Turbine Shaft Market Revenue (Million) Forecast, by Application 2019 & 2032
- Table 34: Nordics Wind Turbine Shaft Market Volume (K Unit) Forecast, by Application 2019 & 2032
- Table 35: Rest of Europe Wind Turbine Shaft Market Revenue (Million) Forecast, by Application 2019 & 2032
- Table 36: Rest of Europe Wind Turbine Shaft Market Volume (K Unit) Forecast, by Application 2019 & 2032
- Table 37: Global Wind Turbine Shaft Market Revenue Million Forecast, by Country 2019 & 2032
- Table 38: Global Wind Turbine Shaft Market Volume K Unit Forecast, by Country 2019 & 2032
- Table 39: China Wind Turbine Shaft Market Revenue (Million) Forecast, by Application 2019 & 2032
- Table 40: China Wind Turbine Shaft Market Volume (K Unit) Forecast, by Application 2019 & 2032
- Table 41: Japan Wind Turbine Shaft Market Revenue (Million) Forecast, by Application 2019 & 2032
- Table 42: Japan Wind Turbine Shaft Market Volume (K Unit) Forecast, by Application 2019 & 2032
- Table 43: India Wind Turbine Shaft Market Revenue (Million) Forecast, by Application 2019 & 2032
- Table 44: India Wind Turbine Shaft Market Volume (K Unit) Forecast, by Application 2019 & 2032
- Table 45: South Korea Wind Turbine Shaft Market Revenue (Million) Forecast, by Application 2019 & 2032
- Table 46: South Korea Wind Turbine Shaft Market Volume (K Unit) Forecast, by Application 2019 & 2032
- Table 47: Southeast Asia Wind Turbine Shaft Market Revenue (Million) Forecast, by Application 2019 & 2032
- Table 48: Southeast Asia Wind Turbine Shaft Market Volume (K Unit) Forecast, by Application 2019 & 2032
- Table 49: Australia Wind Turbine Shaft Market Revenue (Million) Forecast, by Application 2019 & 2032
- Table 50: Australia Wind Turbine Shaft Market Volume (K Unit) Forecast, by Application 2019 & 2032
- Table 51: Indonesia Wind Turbine Shaft Market Revenue (Million) Forecast, by Application 2019 & 2032
- Table 52: Indonesia Wind Turbine Shaft Market Volume (K Unit) Forecast, by Application 2019 & 2032
- Table 53: Phillipes Wind Turbine Shaft Market Revenue (Million) Forecast, by Application 2019 & 2032
- Table 54: Phillipes Wind Turbine Shaft Market Volume (K Unit) Forecast, by Application 2019 & 2032
- Table 55: Singapore Wind Turbine Shaft Market Revenue (Million) Forecast, by Application 2019 & 2032
- Table 56: Singapore Wind Turbine Shaft Market Volume (K Unit) Forecast, by Application 2019 & 2032
- Table 57: Thailandc Wind Turbine Shaft Market Revenue (Million) Forecast, by Application 2019 & 2032
- Table 58: Thailandc Wind Turbine Shaft Market Volume (K Unit) Forecast, by Application 2019 & 2032
- Table 59: Rest of Asia Pacific Wind Turbine Shaft Market Revenue (Million) Forecast, by Application 2019 & 2032
- Table 60: Rest of Asia Pacific Wind Turbine Shaft Market Volume (K Unit) Forecast, by Application 2019 & 2032
- Table 61: Global Wind Turbine Shaft Market Revenue Million Forecast, by Country 2019 & 2032
- Table 62: Global Wind Turbine Shaft Market Volume K Unit Forecast, by Country 2019 & 2032
- Table 63: Brazil Wind Turbine Shaft Market Revenue (Million) Forecast, by Application 2019 & 2032
- Table 64: Brazil Wind Turbine Shaft Market Volume (K Unit) Forecast, by Application 2019 & 2032
- Table 65: Argentina Wind Turbine Shaft Market Revenue (Million) Forecast, by Application 2019 & 2032
- Table 66: Argentina Wind Turbine Shaft Market Volume (K Unit) Forecast, by Application 2019 & 2032
- Table 67: Peru Wind Turbine Shaft Market Revenue (Million) Forecast, by Application 2019 & 2032
- Table 68: Peru Wind Turbine Shaft Market Volume (K Unit) Forecast, by Application 2019 & 2032
- Table 69: Chile Wind Turbine Shaft Market Revenue (Million) Forecast, by Application 2019 & 2032
- Table 70: Chile Wind Turbine Shaft Market Volume (K Unit) Forecast, by Application 2019 & 2032
- Table 71: Colombia Wind Turbine Shaft Market Revenue (Million) Forecast, by Application 2019 & 2032
- Table 72: Colombia Wind Turbine Shaft Market Volume (K Unit) Forecast, by Application 2019 & 2032
- Table 73: Ecuador Wind Turbine Shaft Market Revenue (Million) Forecast, by Application 2019 & 2032
- Table 74: Ecuador Wind Turbine Shaft Market Volume (K Unit) Forecast, by Application 2019 & 2032
- Table 75: Venezuela Wind Turbine Shaft Market Revenue (Million) Forecast, by Application 2019 & 2032
- Table 76: Venezuela Wind Turbine Shaft Market Volume (K Unit) Forecast, by Application 2019 & 2032
- Table 77: Rest of South America Wind Turbine Shaft Market Revenue (Million) Forecast, by Application 2019 & 2032
- Table 78: Rest of South America Wind Turbine Shaft Market Volume (K Unit) Forecast, by Application 2019 & 2032
- Table 79: Global Wind Turbine Shaft Market Revenue Million Forecast, by Country 2019 & 2032
- Table 80: Global Wind Turbine Shaft Market Volume K Unit Forecast, by Country 2019 & 2032
- Table 81: United Arab Emirates Wind Turbine Shaft Market Revenue (Million) Forecast, by Application 2019 & 2032
- Table 82: United Arab Emirates Wind Turbine Shaft Market Volume (K Unit) Forecast, by Application 2019 & 2032
- Table 83: Saudi Arabia Wind Turbine Shaft Market Revenue (Million) Forecast, by Application 2019 & 2032
- Table 84: Saudi Arabia Wind Turbine Shaft Market Volume (K Unit) Forecast, by Application 2019 & 2032
- Table 85: South Africa Wind Turbine Shaft Market Revenue (Million) Forecast, by Application 2019 & 2032
- Table 86: South Africa Wind Turbine Shaft Market Volume (K Unit) Forecast, by Application 2019 & 2032
- Table 87: Rest of Middle East and Africa Wind Turbine Shaft Market Revenue (Million) Forecast, by Application 2019 & 2032
- Table 88: Rest of Middle East and Africa Wind Turbine Shaft Market Volume (K Unit) Forecast, by Application 2019 & 2032
- Table 89: Global Wind Turbine Shaft Market Revenue Million Forecast, by Location of Deployment 2019 & 2032
- Table 90: Global Wind Turbine Shaft Market Volume K Unit Forecast, by Location of Deployment 2019 & 2032
- Table 91: Global Wind Turbine Shaft Market Revenue Million Forecast, by Country 2019 & 2032
- Table 92: Global Wind Turbine Shaft Market Volume K Unit Forecast, by Country 2019 & 2032
- Table 93: Global Wind Turbine Shaft Market Revenue Million Forecast, by Location of Deployment 2019 & 2032
- Table 94: Global Wind Turbine Shaft Market Volume K Unit Forecast, by Location of Deployment 2019 & 2032
- Table 95: Global Wind Turbine Shaft Market Revenue Million Forecast, by Country 2019 & 2032
- Table 96: Global Wind Turbine Shaft Market Volume K Unit Forecast, by Country 2019 & 2032
- Table 97: Global Wind Turbine Shaft Market Revenue Million Forecast, by Location of Deployment 2019 & 2032
- Table 98: Global Wind Turbine Shaft Market Volume K Unit Forecast, by Location of Deployment 2019 & 2032
- Table 99: Global Wind Turbine Shaft Market Revenue Million Forecast, by Country 2019 & 2032
- Table 100: Global Wind Turbine Shaft Market Volume K Unit Forecast, by Country 2019 & 2032
- Table 101: Global Wind Turbine Shaft Market Revenue Million Forecast, by Location of Deployment 2019 & 2032
- Table 102: Global Wind Turbine Shaft Market Volume K Unit Forecast, by Location of Deployment 2019 & 2032
- Table 103: Global Wind Turbine Shaft Market Revenue Million Forecast, by Country 2019 & 2032
- Table 104: Global Wind Turbine Shaft Market Volume K Unit Forecast, by Country 2019 & 2032
- Table 105: Global Wind Turbine Shaft Market Revenue Million Forecast, by Location of Deployment 2019 & 2032
- Table 106: Global Wind Turbine Shaft Market Volume K Unit Forecast, by Location of Deployment 2019 & 2032
- Table 107: Global Wind Turbine Shaft Market Revenue Million Forecast, by Country 2019 & 2032
- Table 108: Global Wind Turbine Shaft Market Volume K Unit Forecast, by Country 2019 & 2032
Frequently Asked Questions
1. What is the projected Compound Annual Growth Rate (CAGR) of the Wind Turbine Shaft Market?
The projected CAGR is approximately > 3.00%.
2. Which companies are prominent players in the Wind Turbine Shaft Market?
Key companies in the market include Broadwind Energy Inc, Luoyang Yujie Industry & Trade Co Ltd, Sany Group, Altra Industrial Motion Corp, Liebherr Group, Western Machine Works Inc, Siemens Gamesa Renewable Energy, Jiangyin Zenkung Forging Co, Wuxi Solar Wind Energy Technology Co Ltd, Schaeffler Technologies AG & Co KG.
3. What are the main segments of the Wind Turbine Shaft Market?
The market segments include Location of Deployment .
4. Can you provide details about the market size?
The market size is estimated to be USD XX Million as of 2022.
5. What are some drivers contributing to market growth?
4.; Increasing Automotive Sales in Saudi Arabia4.; Rising Demand from Heavy Automotives.
6. What are the notable trends driving market growth?
Onshore Wind Turbine Shaft to Dominate the Market.
7. Are there any restraints impacting market growth?
4.; Rising Emphasis on Electric Vehicles.
8. Can you provide examples of recent developments in the market?
N/A
9. What pricing options are available for accessing the report?
Pricing options include single-user, multi-user, and enterprise licenses priced at USD 4750, USD 5250, and USD 8750 respectively.
10. Is the market size provided in terms of value or volume?
The market size is provided in terms of value, measured in Million and volume, measured in K Unit.
11. Are there any specific market keywords associated with the report?
Yes, the market keyword associated with the report is "Wind Turbine Shaft Market," which aids in identifying and referencing the specific market segment covered.
12. How do I determine which pricing option suits my needs best?
The pricing options vary based on user requirements and access needs. Individual users may opt for single-user licenses, while businesses requiring broader access may choose multi-user or enterprise licenses for cost-effective access to the report.
13. Are there any additional resources or data provided in the Wind Turbine Shaft Market report?
While the report offers comprehensive insights, it's advisable to review the specific contents or supplementary materials provided to ascertain if additional resources or data are available.
14. How can I stay updated on further developments or reports in the Wind Turbine Shaft Market?
To stay informed about further developments, trends, and reports in the Wind Turbine Shaft Market, consider subscribing to industry newsletters, following relevant companies and organizations, or regularly checking reputable industry news sources and publications.
Methodology
Step 1 - Identification of Relevant Samples Size from Population Database


Step 2 - Approaches for Defining Global Market Size (Value, Volume* & Price*)

Note*: In applicable scenarios
Step 3 - Data Sources
Primary Research
- Web Analytics
- Survey Reports
- Research Institute
- Latest Research Reports
- Opinion Leaders
Secondary Research
- Annual Reports
- White Paper
- Latest Press Release
- Industry Association
- Paid Database
- Investor Presentations

Step 4 - Data Triangulation
Involves using different sources of information in order to increase the validity of a study
These sources are likely to be stakeholders in a program - participants, other researchers, program staff, other community members, and so on.
Then we put all data in single framework & apply various statistical tools to find out the dynamic on the market.
During the analysis stage, feedback from the stakeholder groups would be compared to determine areas of agreement as well as areas of divergence


