

Key Insights
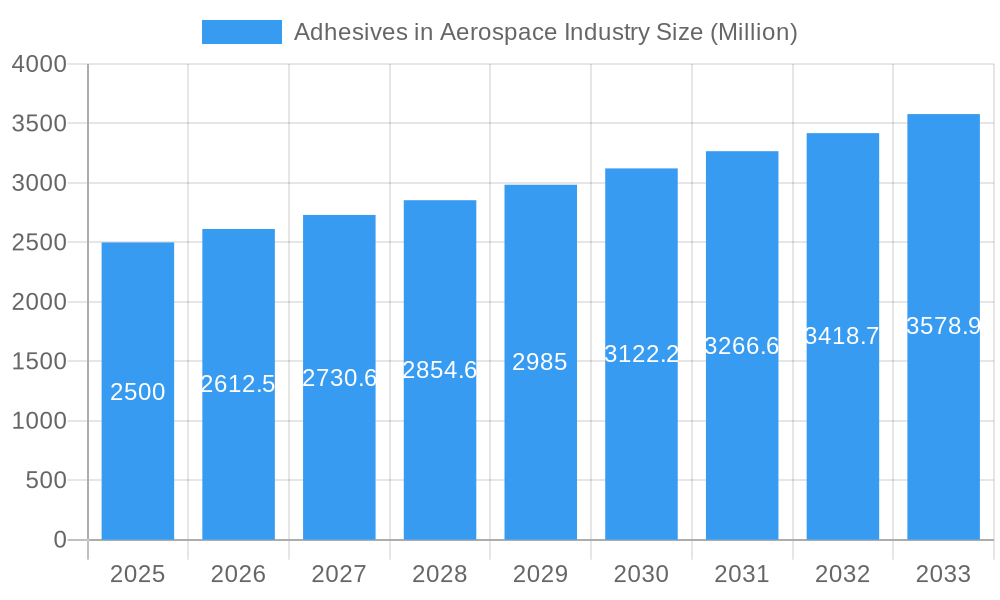
The global aerospace adhesives market, valued at approximately $2.5 billion in 2025, is projected to experience robust growth, exceeding a 4.5% CAGR through 2033. This expansion is driven by several key factors. The increasing demand for lightweight yet high-strength aircraft structures is fueling the adoption of advanced adhesive technologies, particularly in areas like bonding composite materials and replacing traditional mechanical fasteners. Furthermore, the growing focus on fuel efficiency and reduced emissions is driving innovation in adhesive formulations, leading to the development of eco-friendly, waterborne adhesives with superior performance characteristics. The rise of aerospace maintenance, repair, and operations (MRO) activities also contributes significantly to market growth, as adhesives play a crucial role in extending the lifespan of aircraft components. Key market segments include epoxy and polyurethane resin types, largely used in structural applications within both OEM and MRO segments. The Asia-Pacific region, driven by robust growth in the aviation industry within countries like China and India, is anticipated to hold a significant market share.
Adhesives in Aerospace Industry Market Size (In Billion)
However, certain market restraints exist. The high cost of specialized aerospace adhesives and stringent regulatory requirements concerning material certifications can pose challenges to market expansion. Furthermore, the cyclical nature of the aerospace industry, susceptible to economic downturns and geopolitical factors, introduces an element of uncertainty. Nevertheless, ongoing research and development efforts focused on improving adhesive performance, durability, and sustainability are expected to mitigate these challenges. The competitive landscape is characterized by a mix of multinational corporations and specialized adhesive manufacturers, leading to intense competition based on product innovation, cost-effectiveness, and reliability. This competitive environment fosters continuous improvement and drives the market's overall progress.
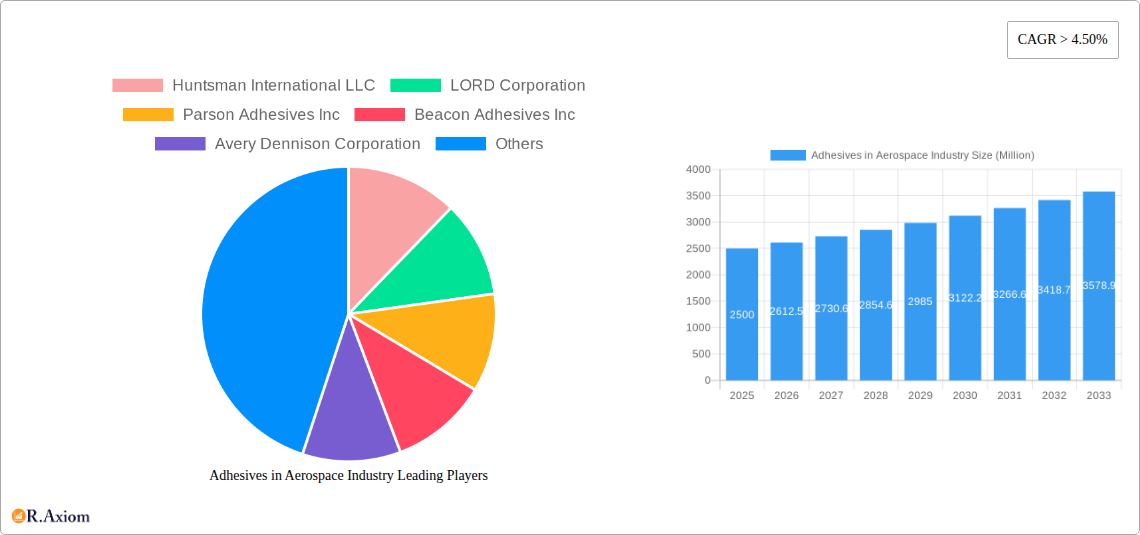
Adhesives in Aerospace Industry Company Market Share
Adhesives in Aerospace Industry: A Comprehensive Market Report (2019-2033)
This detailed report provides a comprehensive analysis of the Adhesives in Aerospace Industry market, offering actionable insights for industry stakeholders. Covering the period 2019-2033, with a focus on 2025, this report explores market dynamics, technological advancements, competitive landscapes, and future growth potential. The study period encompasses historical data (2019-2024), the base year (2025), and a forecast period (2025-2033). The report values are presented in Millions of USD.
Adhesives in Aerospace Industry Market Concentration & Innovation
The aerospace adhesives market exhibits a moderately concentrated structure, with a few major players holding significant market share. While precise figures are proprietary, estimates suggest that the top 10 companies control approximately xx% of the global market in 2025. This concentration is driven by substantial investments in R&D, extensive product portfolios, and strong distribution networks. Key innovation drivers include the increasing demand for lightweight, high-strength materials, the need for improved fuel efficiency, and stringent regulatory compliance.
The regulatory landscape significantly impacts market dynamics, with stringent safety and performance standards driving innovation. The emergence of bio-based and sustainable adhesives is a notable trend, spurred by environmental concerns and government regulations. Product substitutes, such as rivets and welding, remain relevant in niche applications, but adhesives continue to dominate due to their superior bonding capabilities and cost-effectiveness in many instances.
Mergers and acquisitions (M&A) activity is a prominent feature, reflecting consolidation and expansion strategies. While precise M&A deal values are confidential, major transactions in recent years have exceeded $xx Million, strengthening the position of major players and shaping the competitive landscape. End-user trends, particularly the preference for advanced materials and manufacturing processes, are driving demand for specialized adhesives with improved performance characteristics.
- Market Share (Estimated 2025): Top 10 players - xx%
- M&A Deal Values (Recent Years): > $xx Million
Adhesives in Aerospace Industry Industry Trends & Insights
The global aerospace adhesives market is experiencing robust growth, fueled by several key factors. The rising demand for commercial and military aircraft, coupled with the increasing adoption of advanced composite materials, is a major driver. Technological disruptions, such as the development of novel adhesive chemistries (e.g., bio-based adhesives) and improved curing processes, are significantly impacting market dynamics. Consumer preferences for lighter, safer, and more fuel-efficient aircraft directly translate into higher demand for advanced adhesives.
Competitive dynamics are characterized by intense innovation, strategic partnerships, and an increasing focus on sustainable solutions. The market exhibits a CAGR of xx% during the forecast period (2025-2033). Market penetration of advanced adhesive technologies, such as those used in structural bonding, is expected to increase significantly, reaching approximately xx% by 2033.
Dominant Markets & Segments in Adhesives in Aerospace Industry
The North American region currently dominates the aerospace adhesives market, followed by Europe and Asia-Pacific. This dominance is attributed to the high concentration of aerospace manufacturing facilities and robust R&D activities in these regions.
- Leading Region: North America
- Key Drivers:
- Strong presence of major OEMs
- Robust aerospace R&D infrastructure
- Favorable government policies
Segment Dominance:
- Technology: Reactive adhesives hold the largest market share, driven by their superior strength and durability.
- Resin Type: Epoxy resins dominate due to their excellent adhesion properties, high strength, and chemical resistance.
- Function Type: Structural adhesives comprise a significant portion of the market, owing to their critical role in aircraft assembly.
- End-Use: Original Equipment Manufacturers (OEMs) represent the largest segment, driven by high demand for new aircraft production.
Adhesives in Aerospace Industry Product Developments
Recent product innovations focus on enhancing performance characteristics such as increased strength, improved durability, and enhanced resistance to environmental factors. The development of lightweight, high-strength adhesives tailored for composite materials is a significant trend. These advancements are crucial for meeting the demands of the aerospace industry for lighter, more fuel-efficient aircraft. Competitive advantages are gained through proprietary formulations, superior performance characteristics, and streamlined manufacturing processes.
Report Scope & Segmentation Analysis
This report comprehensively segments the aerospace adhesives market based on technology (waterborne, solvent-borne, reactive), resin type (epoxy, polyurethane, silicone, others), function type (structural, non-structural), and end-use (OEM, MRO). Growth projections for each segment are provided, along with detailed market size estimations and a competitive landscape analysis. Each segment demonstrates a specific growth trajectory, influenced by factors such as technological advancements, material innovations, and industry trends. The market size for each segment varies considerably, with reactive adhesives, epoxy resins, structural adhesives, and OEM applications holding significant market share.
Key Drivers of Adhesives in Aerospace Industry Growth
Several factors are propelling the growth of the aerospace adhesives market. The increasing demand for commercial air travel and military aircraft is a significant driver. Technological advancements in adhesive formulations and application techniques are improving performance characteristics, leading to increased adoption. Stringent regulatory requirements for aircraft safety and fuel efficiency also drive innovation and adoption of advanced adhesive solutions.
Challenges in the Adhesives in Aerospace Industry Sector
The aerospace adhesives industry faces several challenges. Stringent regulatory approvals and certifications pose significant hurdles for new product introductions, adding to R&D costs and timelines. Supply chain disruptions can impact raw material availability and pricing. Intense competition among established players necessitates continuous innovation and cost optimization. The overall impact of these challenges can result in increased production costs and delays in project implementation.
Emerging Opportunities in Adhesives in Aerospace Industry
Emerging opportunities exist in the development of sustainable and bio-based adhesives, catering to growing environmental concerns. The increasing adoption of additive manufacturing (3D printing) offers potential for new applications and customized adhesive solutions. Expansion into emerging markets with growing aviation sectors presents significant growth prospects. Furthermore, the development of advanced adhesive systems for next-generation aircraft materials presents significant opportunities for technological leadership.
Leading Players in the Adhesives in Aerospace Industry Market
- Huntsman International LLC
- LORD Corporation
- Parson Adhesives Inc
- Beacon Adhesives Inc
- Avery Dennison Corporation
- Solvay
- L&L Products
- Hexcel Corporation
- Henkel AG & Company KGaA
- Hybond
- Hernon Manufacturing Inc
- Permabond LLC
- Arkema Group (Bostik SA)
- Dymax Corporation
- DELO Industrie Klebstoffe GmbH & Co KGaA
- PPG Industries Inc
- Royal Adhesives & Sealants
- Master Bond Inc
- Hylomar Group
- 3M Company
Key Developments in Adhesives in Aerospace Industry Industry
- July 2022: Hexcel Corporation and Spirit AeroSystems Europe collaborated to develop sustainable aircraft manufacturing technologies. This partnership accelerates the adoption of eco-friendly materials and processes within the aerospace sector.
- March 2022: Solvay partnered with Wichita State University's NIAR to conduct research and materials development for the aviation industry. This collaboration fosters innovation and strengthens the supply chain for advanced materials.
Strategic Outlook for Adhesives in Aerospace Industry Market
The aerospace adhesives market is poised for continued growth, driven by technological advancements, increasing aircraft production, and a rising focus on sustainability. The development of high-performance, lightweight, and environmentally friendly adhesives will be key to capturing market share. Strategic partnerships and collaborations will play a crucial role in driving innovation and expanding market reach. The future potential is considerable, with significant opportunities for companies that can effectively address the industry's evolving needs and challenges.
Adhesives in Aerospace Industry Segmentation
-
1. Technology
- 1.1. Waterborne
- 1.2. Solvent-borne
- 1.3. Reactive
-
2. Resin Type
- 2.1. Epoxy
- 2.2. Polyurethane
- 2.3. Silicone
- 2.4. Other Resin Types
-
3. Function type
- 3.1. Structural
- 3.2. Non-Structural
-
4. End-use
- 4.1. Original Equipment Manufacturer (OEM)
- 4.2. Maintenance Repair and Operations (MRO)
Adhesives in Aerospace Industry Segmentation By Geography
-
1. Asia Pacific
- 1.1. China
- 1.2. India
- 1.3. Japan
- 1.4. South Korea
- 1.5. Australia and New Zealand
- 1.6. Rest of Asia Pacific
-
2. North America
- 2.1. United States
- 2.2. Canada
- 2.3. Mexico
-
3. Europe
- 3.1. Germany
- 3.2. United Kingdom
- 3.3. Italy
- 3.4. France
- 3.5. Spain
- 3.6. Rest of Europe
-
4. South America
- 4.1. Brazil
- 4.2. Argentina
- 4.3. Rest of South America
-
5. Middle East and Africa
- 5.1. Saudi Arabia
- 5.2. South Africa
- 5.3. Rest of Middle East and Africa
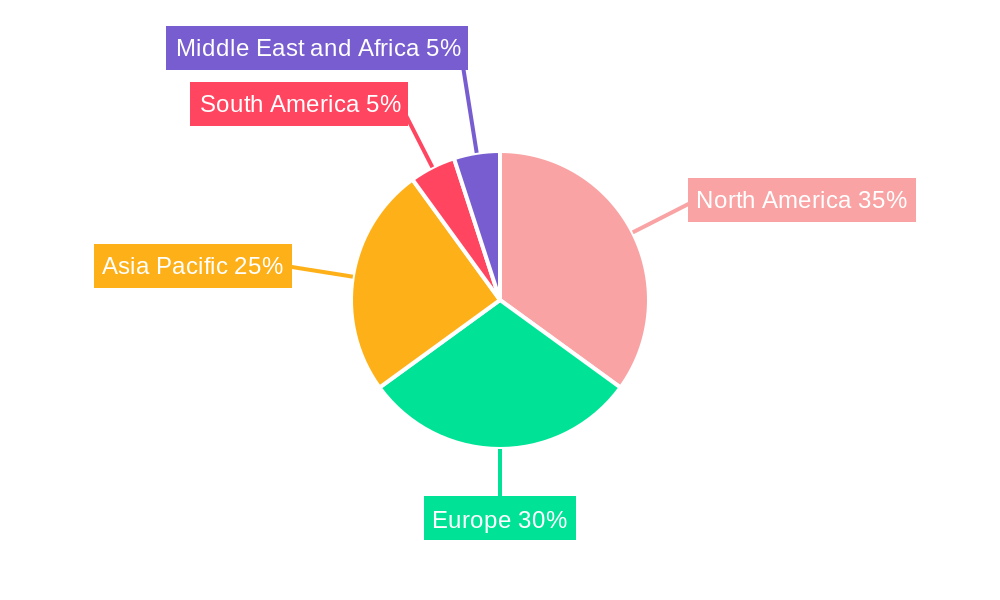
Adhesives in Aerospace Industry Regional Market Share
Geographic Coverage of Adhesives in Aerospace Industry
Adhesives in Aerospace Industry REPORT HIGHLIGHTS
| Aspects | Details |
|---|---|
| Study Period | 2020-2034 |
| Base Year | 2025 |
| Estimated Year | 2026 |
| Forecast Period | 2026-2034 |
| Historical Period | 2020-2025 |
| Growth Rate | CAGR of 4.6% from 2020-2034 |
| Segmentation |
|
Table of Contents
- 1. Introduction
- 1.1. Research Scope
- 1.2. Market Segmentation
- 1.3. Research Objective
- 1.4. Definitions and Assumptions
- 2. Executive Summary
- 2.1. Market Snapshot
- 3. Market Dynamics
- 3.1. Market Drivers
- 3.2. Market Restrains
- 3.3. Market Trends
- 3.4. Market Opportunities
- 4. Market Factor Analysis
- 4.1. Porters Five Forces
- 4.1.1. Bargaining Power of Suppliers
- 4.1.2. Bargaining Power of Buyers
- 4.1.3. Threat of New Entrants
- 4.1.4. Threat of Substitutes
- 4.1.5. Competitive Rivalry
- 4.2. PESTEL analysis
- 4.3. BCG Analysis
- 4.3.1. Stars (High Growth, High Market Share)
- 4.3.2. Cash Cows (Low Growth, High Market Share)
- 4.3.3. Question Mark (High Growth, Low Market Share)
- 4.3.4. Dogs (Low Growth, Low Market Share)
- 4.4. Ansoff Matrix Analysis
- 4.5. Supply Chain Analysis
- 4.6. Regulatory Landscape
- 4.7. Current Market Potential and Opportunity Assessment (TAM–SAM–SOM Framework)
- 4.8. RAX Analyst Note
- 4.1. Porters Five Forces
- 5. Market Analysis, Insights and Forecast 2021-2033
- 5.1. Market Analysis, Insights and Forecast - by Technology
- 5.1.1. Waterborne
- 5.1.2. Solvent-borne
- 5.1.3. Reactive
- 5.2. Market Analysis, Insights and Forecast - by Resin Type
- 5.2.1. Epoxy
- 5.2.2. Polyurethane
- 5.2.3. Silicone
- 5.2.4. Other Resin Types
- 5.3. Market Analysis, Insights and Forecast - by Function type
- 5.3.1. Structural
- 5.3.2. Non-Structural
- 5.4. Market Analysis, Insights and Forecast - by End-use
- 5.4.1. Original Equipment Manufacturer (OEM)
- 5.4.2. Maintenance Repair and Operations (MRO)
- 5.5. Market Analysis, Insights and Forecast - by Region
- 5.5.1. Asia Pacific
- 5.5.2. North America
- 5.5.3. Europe
- 5.5.4. South America
- 5.5.5. Middle East and Africa
- 5.1. Market Analysis, Insights and Forecast - by Technology
- 6. Global Adhesives in Aerospace Industry Analysis, Insights and Forecast, 2021-2033
- 6.1. Market Analysis, Insights and Forecast - by Technology
- 6.1.1. Waterborne
- 6.1.2. Solvent-borne
- 6.1.3. Reactive
- 6.2. Market Analysis, Insights and Forecast - by Resin Type
- 6.2.1. Epoxy
- 6.2.2. Polyurethane
- 6.2.3. Silicone
- 6.2.4. Other Resin Types
- 6.3. Market Analysis, Insights and Forecast - by Function type
- 6.3.1. Structural
- 6.3.2. Non-Structural
- 6.4. Market Analysis, Insights and Forecast - by End-use
- 6.4.1. Original Equipment Manufacturer (OEM)
- 6.4.2. Maintenance Repair and Operations (MRO)
- 6.1. Market Analysis, Insights and Forecast - by Technology
- 7. Asia Pacific Adhesives in Aerospace Industry Analysis, Insights and Forecast, 2020-2032
- 7.1. Market Analysis, Insights and Forecast - by Technology
- 7.1.1. Waterborne
- 7.1.2. Solvent-borne
- 7.1.3. Reactive
- 7.2. Market Analysis, Insights and Forecast - by Resin Type
- 7.2.1. Epoxy
- 7.2.2. Polyurethane
- 7.2.3. Silicone
- 7.2.4. Other Resin Types
- 7.3. Market Analysis, Insights and Forecast - by Function type
- 7.3.1. Structural
- 7.3.2. Non-Structural
- 7.4. Market Analysis, Insights and Forecast - by End-use
- 7.4.1. Original Equipment Manufacturer (OEM)
- 7.4.2. Maintenance Repair and Operations (MRO)
- 7.1. Market Analysis, Insights and Forecast - by Technology
- 8. North America Adhesives in Aerospace Industry Analysis, Insights and Forecast, 2020-2032
- 8.1. Market Analysis, Insights and Forecast - by Technology
- 8.1.1. Waterborne
- 8.1.2. Solvent-borne
- 8.1.3. Reactive
- 8.2. Market Analysis, Insights and Forecast - by Resin Type
- 8.2.1. Epoxy
- 8.2.2. Polyurethane
- 8.2.3. Silicone
- 8.2.4. Other Resin Types
- 8.3. Market Analysis, Insights and Forecast - by Function type
- 8.3.1. Structural
- 8.3.2. Non-Structural
- 8.4. Market Analysis, Insights and Forecast - by End-use
- 8.4.1. Original Equipment Manufacturer (OEM)
- 8.4.2. Maintenance Repair and Operations (MRO)
- 8.1. Market Analysis, Insights and Forecast - by Technology
- 9. Europe Adhesives in Aerospace Industry Analysis, Insights and Forecast, 2020-2032
- 9.1. Market Analysis, Insights and Forecast - by Technology
- 9.1.1. Waterborne
- 9.1.2. Solvent-borne
- 9.1.3. Reactive
- 9.2. Market Analysis, Insights and Forecast - by Resin Type
- 9.2.1. Epoxy
- 9.2.2. Polyurethane
- 9.2.3. Silicone
- 9.2.4. Other Resin Types
- 9.3. Market Analysis, Insights and Forecast - by Function type
- 9.3.1. Structural
- 9.3.2. Non-Structural
- 9.4. Market Analysis, Insights and Forecast - by End-use
- 9.4.1. Original Equipment Manufacturer (OEM)
- 9.4.2. Maintenance Repair and Operations (MRO)
- 9.1. Market Analysis, Insights and Forecast - by Technology
- 10. South America Adhesives in Aerospace Industry Analysis, Insights and Forecast, 2020-2032
- 10.1. Market Analysis, Insights and Forecast - by Technology
- 10.1.1. Waterborne
- 10.1.2. Solvent-borne
- 10.1.3. Reactive
- 10.2. Market Analysis, Insights and Forecast - by Resin Type
- 10.2.1. Epoxy
- 10.2.2. Polyurethane
- 10.2.3. Silicone
- 10.2.4. Other Resin Types
- 10.3. Market Analysis, Insights and Forecast - by Function type
- 10.3.1. Structural
- 10.3.2. Non-Structural
- 10.4. Market Analysis, Insights and Forecast - by End-use
- 10.4.1. Original Equipment Manufacturer (OEM)
- 10.4.2. Maintenance Repair and Operations (MRO)
- 10.1. Market Analysis, Insights and Forecast - by Technology
- 11. Middle East and Africa Adhesives in Aerospace Industry Analysis, Insights and Forecast, 2020-2032
- 11.1. Market Analysis, Insights and Forecast - by Technology
- 11.1.1. Waterborne
- 11.1.2. Solvent-borne
- 11.1.3. Reactive
- 11.2. Market Analysis, Insights and Forecast - by Resin Type
- 11.2.1. Epoxy
- 11.2.2. Polyurethane
- 11.2.3. Silicone
- 11.2.4. Other Resin Types
- 11.3. Market Analysis, Insights and Forecast - by Function type
- 11.3.1. Structural
- 11.3.2. Non-Structural
- 11.4. Market Analysis, Insights and Forecast - by End-use
- 11.4.1. Original Equipment Manufacturer (OEM)
- 11.4.2. Maintenance Repair and Operations (MRO)
- 11.1. Market Analysis, Insights and Forecast - by Technology
- 12. Competitive Analysis
- 12.1. Company Profiles
- 12.1.1 Huntsman International LLC
- 12.1.1.1. Company Overview
- 12.1.1.2. Products
- 12.1.1.3. Company Financials
- 12.1.1.4. SWOT Analysis
- 12.1.2 LORD Corporation
- 12.1.2.1. Company Overview
- 12.1.2.2. Products
- 12.1.2.3. Company Financials
- 12.1.2.4. SWOT Analysis
- 12.1.3 Parson Adhesives Inc
- 12.1.3.1. Company Overview
- 12.1.3.2. Products
- 12.1.3.3. Company Financials
- 12.1.3.4. SWOT Analysis
- 12.1.4 Beacon Adhesives Inc
- 12.1.4.1. Company Overview
- 12.1.4.2. Products
- 12.1.4.3. Company Financials
- 12.1.4.4. SWOT Analysis
- 12.1.5 Avery Dennison Corporation
- 12.1.5.1. Company Overview
- 12.1.5.2. Products
- 12.1.5.3. Company Financials
- 12.1.5.4. SWOT Analysis
- 12.1.6 Solvay
- 12.1.6.1. Company Overview
- 12.1.6.2. Products
- 12.1.6.3. Company Financials
- 12.1.6.4. SWOT Analysis
- 12.1.7 L&L Products
- 12.1.7.1. Company Overview
- 12.1.7.2. Products
- 12.1.7.3. Company Financials
- 12.1.7.4. SWOT Analysis
- 12.1.8 Hexcel Corporation
- 12.1.8.1. Company Overview
- 12.1.8.2. Products
- 12.1.8.3. Company Financials
- 12.1.8.4. SWOT Analysis
- 12.1.9 Henkel AG & Company KGaA
- 12.1.9.1. Company Overview
- 12.1.9.2. Products
- 12.1.9.3. Company Financials
- 12.1.9.4. SWOT Analysis
- 12.1.10 Hybond
- 12.1.10.1. Company Overview
- 12.1.10.2. Products
- 12.1.10.3. Company Financials
- 12.1.10.4. SWOT Analysis
- 12.1.11 Hernon Manufacturing Inc
- 12.1.11.1. Company Overview
- 12.1.11.2. Products
- 12.1.11.3. Company Financials
- 12.1.11.4. SWOT Analysis
- 12.1.12 Permabond LLC
- 12.1.12.1. Company Overview
- 12.1.12.2. Products
- 12.1.12.3. Company Financials
- 12.1.12.4. SWOT Analysis
- 12.1.13 Arkema Group (Bostik SA)
- 12.1.13.1. Company Overview
- 12.1.13.2. Products
- 12.1.13.3. Company Financials
- 12.1.13.4. SWOT Analysis
- 12.1.14 Dymax Corporation
- 12.1.14.1. Company Overview
- 12.1.14.2. Products
- 12.1.14.3. Company Financials
- 12.1.14.4. SWOT Analysis
- 12.1.15 DELO Industrie Klebstoffe GmbH & Co KGaA
- 12.1.15.1. Company Overview
- 12.1.15.2. Products
- 12.1.15.3. Company Financials
- 12.1.15.4. SWOT Analysis
- 12.1.16 PPG Industries Inc
- 12.1.16.1. Company Overview
- 12.1.16.2. Products
- 12.1.16.3. Company Financials
- 12.1.16.4. SWOT Analysis
- 12.1.17 Royal Adhesives & Sealants*List Not Exhaustive
- 12.1.17.1. Company Overview
- 12.1.17.2. Products
- 12.1.17.3. Company Financials
- 12.1.17.4. SWOT Analysis
- 12.1.18 Master Bond Inc
- 12.1.18.1. Company Overview
- 12.1.18.2. Products
- 12.1.18.3. Company Financials
- 12.1.18.4. SWOT Analysis
- 12.1.19 Hylomar Group
- 12.1.19.1. Company Overview
- 12.1.19.2. Products
- 12.1.19.3. Company Financials
- 12.1.19.4. SWOT Analysis
- 12.1.20 3M Company
- 12.1.20.1. Company Overview
- 12.1.20.2. Products
- 12.1.20.3. Company Financials
- 12.1.20.4. SWOT Analysis
- 12.1.1 Huntsman International LLC
- 12.2. Market Entropy
- 12.2.1 Company's Key Areas Served
- 12.2.2 Recent Developments
- 12.3. Company Market Share Analysis 2025
- 12.3.1 Top 5 Companies Market Share Analysis
- 12.3.2 Top 3 Companies Market Share Analysis
- 12.4. List of Potential Customers
- 13. Research Methodology
List of Figures
- Figure 1: Global Adhesives in Aerospace Industry Revenue Breakdown (billion, %) by Region 2025 & 2033
- Figure 2: Global Adhesives in Aerospace Industry Volume Breakdown (Kiloton, %) by Region 2025 & 2033
- Figure 3: Asia Pacific Adhesives in Aerospace Industry Revenue (billion), by Technology 2025 & 2033
- Figure 4: Asia Pacific Adhesives in Aerospace Industry Volume (Kiloton), by Technology 2025 & 2033
- Figure 5: Asia Pacific Adhesives in Aerospace Industry Revenue Share (%), by Technology 2025 & 2033
- Figure 6: Asia Pacific Adhesives in Aerospace Industry Volume Share (%), by Technology 2025 & 2033
- Figure 7: Asia Pacific Adhesives in Aerospace Industry Revenue (billion), by Resin Type 2025 & 2033
- Figure 8: Asia Pacific Adhesives in Aerospace Industry Volume (Kiloton), by Resin Type 2025 & 2033
- Figure 9: Asia Pacific Adhesives in Aerospace Industry Revenue Share (%), by Resin Type 2025 & 2033
- Figure 10: Asia Pacific Adhesives in Aerospace Industry Volume Share (%), by Resin Type 2025 & 2033
- Figure 11: Asia Pacific Adhesives in Aerospace Industry Revenue (billion), by Function type 2025 & 2033
- Figure 12: Asia Pacific Adhesives in Aerospace Industry Volume (Kiloton), by Function type 2025 & 2033
- Figure 13: Asia Pacific Adhesives in Aerospace Industry Revenue Share (%), by Function type 2025 & 2033
- Figure 14: Asia Pacific Adhesives in Aerospace Industry Volume Share (%), by Function type 2025 & 2033
- Figure 15: Asia Pacific Adhesives in Aerospace Industry Revenue (billion), by End-use 2025 & 2033
- Figure 16: Asia Pacific Adhesives in Aerospace Industry Volume (Kiloton), by End-use 2025 & 2033
- Figure 17: Asia Pacific Adhesives in Aerospace Industry Revenue Share (%), by End-use 2025 & 2033
- Figure 18: Asia Pacific Adhesives in Aerospace Industry Volume Share (%), by End-use 2025 & 2033
- Figure 19: Asia Pacific Adhesives in Aerospace Industry Revenue (billion), by Country 2025 & 2033
- Figure 20: Asia Pacific Adhesives in Aerospace Industry Volume (Kiloton), by Country 2025 & 2033
- Figure 21: Asia Pacific Adhesives in Aerospace Industry Revenue Share (%), by Country 2025 & 2033
- Figure 22: Asia Pacific Adhesives in Aerospace Industry Volume Share (%), by Country 2025 & 2033
- Figure 23: North America Adhesives in Aerospace Industry Revenue (billion), by Technology 2025 & 2033
- Figure 24: North America Adhesives in Aerospace Industry Volume (Kiloton), by Technology 2025 & 2033
- Figure 25: North America Adhesives in Aerospace Industry Revenue Share (%), by Technology 2025 & 2033
- Figure 26: North America Adhesives in Aerospace Industry Volume Share (%), by Technology 2025 & 2033
- Figure 27: North America Adhesives in Aerospace Industry Revenue (billion), by Resin Type 2025 & 2033
- Figure 28: North America Adhesives in Aerospace Industry Volume (Kiloton), by Resin Type 2025 & 2033
- Figure 29: North America Adhesives in Aerospace Industry Revenue Share (%), by Resin Type 2025 & 2033
- Figure 30: North America Adhesives in Aerospace Industry Volume Share (%), by Resin Type 2025 & 2033
- Figure 31: North America Adhesives in Aerospace Industry Revenue (billion), by Function type 2025 & 2033
- Figure 32: North America Adhesives in Aerospace Industry Volume (Kiloton), by Function type 2025 & 2033
- Figure 33: North America Adhesives in Aerospace Industry Revenue Share (%), by Function type 2025 & 2033
- Figure 34: North America Adhesives in Aerospace Industry Volume Share (%), by Function type 2025 & 2033
- Figure 35: North America Adhesives in Aerospace Industry Revenue (billion), by End-use 2025 & 2033
- Figure 36: North America Adhesives in Aerospace Industry Volume (Kiloton), by End-use 2025 & 2033
- Figure 37: North America Adhesives in Aerospace Industry Revenue Share (%), by End-use 2025 & 2033
- Figure 38: North America Adhesives in Aerospace Industry Volume Share (%), by End-use 2025 & 2033
- Figure 39: North America Adhesives in Aerospace Industry Revenue (billion), by Country 2025 & 2033
- Figure 40: North America Adhesives in Aerospace Industry Volume (Kiloton), by Country 2025 & 2033
- Figure 41: North America Adhesives in Aerospace Industry Revenue Share (%), by Country 2025 & 2033
- Figure 42: North America Adhesives in Aerospace Industry Volume Share (%), by Country 2025 & 2033
- Figure 43: Europe Adhesives in Aerospace Industry Revenue (billion), by Technology 2025 & 2033
- Figure 44: Europe Adhesives in Aerospace Industry Volume (Kiloton), by Technology 2025 & 2033
- Figure 45: Europe Adhesives in Aerospace Industry Revenue Share (%), by Technology 2025 & 2033
- Figure 46: Europe Adhesives in Aerospace Industry Volume Share (%), by Technology 2025 & 2033
- Figure 47: Europe Adhesives in Aerospace Industry Revenue (billion), by Resin Type 2025 & 2033
- Figure 48: Europe Adhesives in Aerospace Industry Volume (Kiloton), by Resin Type 2025 & 2033
- Figure 49: Europe Adhesives in Aerospace Industry Revenue Share (%), by Resin Type 2025 & 2033
- Figure 50: Europe Adhesives in Aerospace Industry Volume Share (%), by Resin Type 2025 & 2033
- Figure 51: Europe Adhesives in Aerospace Industry Revenue (billion), by Function type 2025 & 2033
- Figure 52: Europe Adhesives in Aerospace Industry Volume (Kiloton), by Function type 2025 & 2033
- Figure 53: Europe Adhesives in Aerospace Industry Revenue Share (%), by Function type 2025 & 2033
- Figure 54: Europe Adhesives in Aerospace Industry Volume Share (%), by Function type 2025 & 2033
- Figure 55: Europe Adhesives in Aerospace Industry Revenue (billion), by End-use 2025 & 2033
- Figure 56: Europe Adhesives in Aerospace Industry Volume (Kiloton), by End-use 2025 & 2033
- Figure 57: Europe Adhesives in Aerospace Industry Revenue Share (%), by End-use 2025 & 2033
- Figure 58: Europe Adhesives in Aerospace Industry Volume Share (%), by End-use 2025 & 2033
- Figure 59: Europe Adhesives in Aerospace Industry Revenue (billion), by Country 2025 & 2033
- Figure 60: Europe Adhesives in Aerospace Industry Volume (Kiloton), by Country 2025 & 2033
- Figure 61: Europe Adhesives in Aerospace Industry Revenue Share (%), by Country 2025 & 2033
- Figure 62: Europe Adhesives in Aerospace Industry Volume Share (%), by Country 2025 & 2033
- Figure 63: South America Adhesives in Aerospace Industry Revenue (billion), by Technology 2025 & 2033
- Figure 64: South America Adhesives in Aerospace Industry Volume (Kiloton), by Technology 2025 & 2033
- Figure 65: South America Adhesives in Aerospace Industry Revenue Share (%), by Technology 2025 & 2033
- Figure 66: South America Adhesives in Aerospace Industry Volume Share (%), by Technology 2025 & 2033
- Figure 67: South America Adhesives in Aerospace Industry Revenue (billion), by Resin Type 2025 & 2033
- Figure 68: South America Adhesives in Aerospace Industry Volume (Kiloton), by Resin Type 2025 & 2033
- Figure 69: South America Adhesives in Aerospace Industry Revenue Share (%), by Resin Type 2025 & 2033
- Figure 70: South America Adhesives in Aerospace Industry Volume Share (%), by Resin Type 2025 & 2033
- Figure 71: South America Adhesives in Aerospace Industry Revenue (billion), by Function type 2025 & 2033
- Figure 72: South America Adhesives in Aerospace Industry Volume (Kiloton), by Function type 2025 & 2033
- Figure 73: South America Adhesives in Aerospace Industry Revenue Share (%), by Function type 2025 & 2033
- Figure 74: South America Adhesives in Aerospace Industry Volume Share (%), by Function type 2025 & 2033
- Figure 75: South America Adhesives in Aerospace Industry Revenue (billion), by End-use 2025 & 2033
- Figure 76: South America Adhesives in Aerospace Industry Volume (Kiloton), by End-use 2025 & 2033
- Figure 77: South America Adhesives in Aerospace Industry Revenue Share (%), by End-use 2025 & 2033
- Figure 78: South America Adhesives in Aerospace Industry Volume Share (%), by End-use 2025 & 2033
- Figure 79: South America Adhesives in Aerospace Industry Revenue (billion), by Country 2025 & 2033
- Figure 80: South America Adhesives in Aerospace Industry Volume (Kiloton), by Country 2025 & 2033
- Figure 81: South America Adhesives in Aerospace Industry Revenue Share (%), by Country 2025 & 2033
- Figure 82: South America Adhesives in Aerospace Industry Volume Share (%), by Country 2025 & 2033
- Figure 83: Middle East and Africa Adhesives in Aerospace Industry Revenue (billion), by Technology 2025 & 2033
- Figure 84: Middle East and Africa Adhesives in Aerospace Industry Volume (Kiloton), by Technology 2025 & 2033
- Figure 85: Middle East and Africa Adhesives in Aerospace Industry Revenue Share (%), by Technology 2025 & 2033
- Figure 86: Middle East and Africa Adhesives in Aerospace Industry Volume Share (%), by Technology 2025 & 2033
- Figure 87: Middle East and Africa Adhesives in Aerospace Industry Revenue (billion), by Resin Type 2025 & 2033
- Figure 88: Middle East and Africa Adhesives in Aerospace Industry Volume (Kiloton), by Resin Type 2025 & 2033
- Figure 89: Middle East and Africa Adhesives in Aerospace Industry Revenue Share (%), by Resin Type 2025 & 2033
- Figure 90: Middle East and Africa Adhesives in Aerospace Industry Volume Share (%), by Resin Type 2025 & 2033
- Figure 91: Middle East and Africa Adhesives in Aerospace Industry Revenue (billion), by Function type 2025 & 2033
- Figure 92: Middle East and Africa Adhesives in Aerospace Industry Volume (Kiloton), by Function type 2025 & 2033
- Figure 93: Middle East and Africa Adhesives in Aerospace Industry Revenue Share (%), by Function type 2025 & 2033
- Figure 94: Middle East and Africa Adhesives in Aerospace Industry Volume Share (%), by Function type 2025 & 2033
- Figure 95: Middle East and Africa Adhesives in Aerospace Industry Revenue (billion), by End-use 2025 & 2033
- Figure 96: Middle East and Africa Adhesives in Aerospace Industry Volume (Kiloton), by End-use 2025 & 2033
- Figure 97: Middle East and Africa Adhesives in Aerospace Industry Revenue Share (%), by End-use 2025 & 2033
- Figure 98: Middle East and Africa Adhesives in Aerospace Industry Volume Share (%), by End-use 2025 & 2033
- Figure 99: Middle East and Africa Adhesives in Aerospace Industry Revenue (billion), by Country 2025 & 2033
- Figure 100: Middle East and Africa Adhesives in Aerospace Industry Volume (Kiloton), by Country 2025 & 2033
- Figure 101: Middle East and Africa Adhesives in Aerospace Industry Revenue Share (%), by Country 2025 & 2033
- Figure 102: Middle East and Africa Adhesives in Aerospace Industry Volume Share (%), by Country 2025 & 2033
List of Tables
- Table 1: Global Adhesives in Aerospace Industry Revenue billion Forecast, by Technology 2020 & 2033
- Table 2: Global Adhesives in Aerospace Industry Volume Kiloton Forecast, by Technology 2020 & 2033
- Table 3: Global Adhesives in Aerospace Industry Revenue billion Forecast, by Resin Type 2020 & 2033
- Table 4: Global Adhesives in Aerospace Industry Volume Kiloton Forecast, by Resin Type 2020 & 2033
- Table 5: Global Adhesives in Aerospace Industry Revenue billion Forecast, by Function type 2020 & 2033
- Table 6: Global Adhesives in Aerospace Industry Volume Kiloton Forecast, by Function type 2020 & 2033
- Table 7: Global Adhesives in Aerospace Industry Revenue billion Forecast, by End-use 2020 & 2033
- Table 8: Global Adhesives in Aerospace Industry Volume Kiloton Forecast, by End-use 2020 & 2033
- Table 9: Global Adhesives in Aerospace Industry Revenue billion Forecast, by Region 2020 & 2033
- Table 10: Global Adhesives in Aerospace Industry Volume Kiloton Forecast, by Region 2020 & 2033
- Table 11: Global Adhesives in Aerospace Industry Revenue billion Forecast, by Technology 2020 & 2033
- Table 12: Global Adhesives in Aerospace Industry Volume Kiloton Forecast, by Technology 2020 & 2033
- Table 13: Global Adhesives in Aerospace Industry Revenue billion Forecast, by Resin Type 2020 & 2033
- Table 14: Global Adhesives in Aerospace Industry Volume Kiloton Forecast, by Resin Type 2020 & 2033
- Table 15: Global Adhesives in Aerospace Industry Revenue billion Forecast, by Function type 2020 & 2033
- Table 16: Global Adhesives in Aerospace Industry Volume Kiloton Forecast, by Function type 2020 & 2033
- Table 17: Global Adhesives in Aerospace Industry Revenue billion Forecast, by End-use 2020 & 2033
- Table 18: Global Adhesives in Aerospace Industry Volume Kiloton Forecast, by End-use 2020 & 2033
- Table 19: Global Adhesives in Aerospace Industry Revenue billion Forecast, by Country 2020 & 2033
- Table 20: Global Adhesives in Aerospace Industry Volume Kiloton Forecast, by Country 2020 & 2033
- Table 21: China Adhesives in Aerospace Industry Revenue (billion) Forecast, by Application 2020 & 2033
- Table 22: China Adhesives in Aerospace Industry Volume (Kiloton) Forecast, by Application 2020 & 2033
- Table 23: India Adhesives in Aerospace Industry Revenue (billion) Forecast, by Application 2020 & 2033
- Table 24: India Adhesives in Aerospace Industry Volume (Kiloton) Forecast, by Application 2020 & 2033
- Table 25: Japan Adhesives in Aerospace Industry Revenue (billion) Forecast, by Application 2020 & 2033
- Table 26: Japan Adhesives in Aerospace Industry Volume (Kiloton) Forecast, by Application 2020 & 2033
- Table 27: South Korea Adhesives in Aerospace Industry Revenue (billion) Forecast, by Application 2020 & 2033
- Table 28: South Korea Adhesives in Aerospace Industry Volume (Kiloton) Forecast, by Application 2020 & 2033
- Table 29: Australia and New Zealand Adhesives in Aerospace Industry Revenue (billion) Forecast, by Application 2020 & 2033
- Table 30: Australia and New Zealand Adhesives in Aerospace Industry Volume (Kiloton) Forecast, by Application 2020 & 2033
- Table 31: Rest of Asia Pacific Adhesives in Aerospace Industry Revenue (billion) Forecast, by Application 2020 & 2033
- Table 32: Rest of Asia Pacific Adhesives in Aerospace Industry Volume (Kiloton) Forecast, by Application 2020 & 2033
- Table 33: Global Adhesives in Aerospace Industry Revenue billion Forecast, by Technology 2020 & 2033
- Table 34: Global Adhesives in Aerospace Industry Volume Kiloton Forecast, by Technology 2020 & 2033
- Table 35: Global Adhesives in Aerospace Industry Revenue billion Forecast, by Resin Type 2020 & 2033
- Table 36: Global Adhesives in Aerospace Industry Volume Kiloton Forecast, by Resin Type 2020 & 2033
- Table 37: Global Adhesives in Aerospace Industry Revenue billion Forecast, by Function type 2020 & 2033
- Table 38: Global Adhesives in Aerospace Industry Volume Kiloton Forecast, by Function type 2020 & 2033
- Table 39: Global Adhesives in Aerospace Industry Revenue billion Forecast, by End-use 2020 & 2033
- Table 40: Global Adhesives in Aerospace Industry Volume Kiloton Forecast, by End-use 2020 & 2033
- Table 41: Global Adhesives in Aerospace Industry Revenue billion Forecast, by Country 2020 & 2033
- Table 42: Global Adhesives in Aerospace Industry Volume Kiloton Forecast, by Country 2020 & 2033
- Table 43: United States Adhesives in Aerospace Industry Revenue (billion) Forecast, by Application 2020 & 2033
- Table 44: United States Adhesives in Aerospace Industry Volume (Kiloton) Forecast, by Application 2020 & 2033
- Table 45: Canada Adhesives in Aerospace Industry Revenue (billion) Forecast, by Application 2020 & 2033
- Table 46: Canada Adhesives in Aerospace Industry Volume (Kiloton) Forecast, by Application 2020 & 2033
- Table 47: Mexico Adhesives in Aerospace Industry Revenue (billion) Forecast, by Application 2020 & 2033
- Table 48: Mexico Adhesives in Aerospace Industry Volume (Kiloton) Forecast, by Application 2020 & 2033
- Table 49: Global Adhesives in Aerospace Industry Revenue billion Forecast, by Technology 2020 & 2033
- Table 50: Global Adhesives in Aerospace Industry Volume Kiloton Forecast, by Technology 2020 & 2033
- Table 51: Global Adhesives in Aerospace Industry Revenue billion Forecast, by Resin Type 2020 & 2033
- Table 52: Global Adhesives in Aerospace Industry Volume Kiloton Forecast, by Resin Type 2020 & 2033
- Table 53: Global Adhesives in Aerospace Industry Revenue billion Forecast, by Function type 2020 & 2033
- Table 54: Global Adhesives in Aerospace Industry Volume Kiloton Forecast, by Function type 2020 & 2033
- Table 55: Global Adhesives in Aerospace Industry Revenue billion Forecast, by End-use 2020 & 2033
- Table 56: Global Adhesives in Aerospace Industry Volume Kiloton Forecast, by End-use 2020 & 2033
- Table 57: Global Adhesives in Aerospace Industry Revenue billion Forecast, by Country 2020 & 2033
- Table 58: Global Adhesives in Aerospace Industry Volume Kiloton Forecast, by Country 2020 & 2033
- Table 59: Germany Adhesives in Aerospace Industry Revenue (billion) Forecast, by Application 2020 & 2033
- Table 60: Germany Adhesives in Aerospace Industry Volume (Kiloton) Forecast, by Application 2020 & 2033
- Table 61: United Kingdom Adhesives in Aerospace Industry Revenue (billion) Forecast, by Application 2020 & 2033
- Table 62: United Kingdom Adhesives in Aerospace Industry Volume (Kiloton) Forecast, by Application 2020 & 2033
- Table 63: Italy Adhesives in Aerospace Industry Revenue (billion) Forecast, by Application 2020 & 2033
- Table 64: Italy Adhesives in Aerospace Industry Volume (Kiloton) Forecast, by Application 2020 & 2033
- Table 65: France Adhesives in Aerospace Industry Revenue (billion) Forecast, by Application 2020 & 2033
- Table 66: France Adhesives in Aerospace Industry Volume (Kiloton) Forecast, by Application 2020 & 2033
- Table 67: Spain Adhesives in Aerospace Industry Revenue (billion) Forecast, by Application 2020 & 2033
- Table 68: Spain Adhesives in Aerospace Industry Volume (Kiloton) Forecast, by Application 2020 & 2033
- Table 69: Rest of Europe Adhesives in Aerospace Industry Revenue (billion) Forecast, by Application 2020 & 2033
- Table 70: Rest of Europe Adhesives in Aerospace Industry Volume (Kiloton) Forecast, by Application 2020 & 2033
- Table 71: Global Adhesives in Aerospace Industry Revenue billion Forecast, by Technology 2020 & 2033
- Table 72: Global Adhesives in Aerospace Industry Volume Kiloton Forecast, by Technology 2020 & 2033
- Table 73: Global Adhesives in Aerospace Industry Revenue billion Forecast, by Resin Type 2020 & 2033
- Table 74: Global Adhesives in Aerospace Industry Volume Kiloton Forecast, by Resin Type 2020 & 2033
- Table 75: Global Adhesives in Aerospace Industry Revenue billion Forecast, by Function type 2020 & 2033
- Table 76: Global Adhesives in Aerospace Industry Volume Kiloton Forecast, by Function type 2020 & 2033
- Table 77: Global Adhesives in Aerospace Industry Revenue billion Forecast, by End-use 2020 & 2033
- Table 78: Global Adhesives in Aerospace Industry Volume Kiloton Forecast, by End-use 2020 & 2033
- Table 79: Global Adhesives in Aerospace Industry Revenue billion Forecast, by Country 2020 & 2033
- Table 80: Global Adhesives in Aerospace Industry Volume Kiloton Forecast, by Country 2020 & 2033
- Table 81: Brazil Adhesives in Aerospace Industry Revenue (billion) Forecast, by Application 2020 & 2033
- Table 82: Brazil Adhesives in Aerospace Industry Volume (Kiloton) Forecast, by Application 2020 & 2033
- Table 83: Argentina Adhesives in Aerospace Industry Revenue (billion) Forecast, by Application 2020 & 2033
- Table 84: Argentina Adhesives in Aerospace Industry Volume (Kiloton) Forecast, by Application 2020 & 2033
- Table 85: Rest of South America Adhesives in Aerospace Industry Revenue (billion) Forecast, by Application 2020 & 2033
- Table 86: Rest of South America Adhesives in Aerospace Industry Volume (Kiloton) Forecast, by Application 2020 & 2033
- Table 87: Global Adhesives in Aerospace Industry Revenue billion Forecast, by Technology 2020 & 2033
- Table 88: Global Adhesives in Aerospace Industry Volume Kiloton Forecast, by Technology 2020 & 2033
- Table 89: Global Adhesives in Aerospace Industry Revenue billion Forecast, by Resin Type 2020 & 2033
- Table 90: Global Adhesives in Aerospace Industry Volume Kiloton Forecast, by Resin Type 2020 & 2033
- Table 91: Global Adhesives in Aerospace Industry Revenue billion Forecast, by Function type 2020 & 2033
- Table 92: Global Adhesives in Aerospace Industry Volume Kiloton Forecast, by Function type 2020 & 2033
- Table 93: Global Adhesives in Aerospace Industry Revenue billion Forecast, by End-use 2020 & 2033
- Table 94: Global Adhesives in Aerospace Industry Volume Kiloton Forecast, by End-use 2020 & 2033
- Table 95: Global Adhesives in Aerospace Industry Revenue billion Forecast, by Country 2020 & 2033
- Table 96: Global Adhesives in Aerospace Industry Volume Kiloton Forecast, by Country 2020 & 2033
- Table 97: Saudi Arabia Adhesives in Aerospace Industry Revenue (billion) Forecast, by Application 2020 & 2033
- Table 98: Saudi Arabia Adhesives in Aerospace Industry Volume (Kiloton) Forecast, by Application 2020 & 2033
- Table 99: South Africa Adhesives in Aerospace Industry Revenue (billion) Forecast, by Application 2020 & 2033
- Table 100: South Africa Adhesives in Aerospace Industry Volume (Kiloton) Forecast, by Application 2020 & 2033
- Table 101: Rest of Middle East and Africa Adhesives in Aerospace Industry Revenue (billion) Forecast, by Application 2020 & 2033
- Table 102: Rest of Middle East and Africa Adhesives in Aerospace Industry Volume (Kiloton) Forecast, by Application 2020 & 2033
Frequently Asked Questions
1. What is the projected Compound Annual Growth Rate (CAGR) of the Adhesives in Aerospace Industry?
The projected CAGR is approximately 4.6%.
2. Which companies are prominent players in the Adhesives in Aerospace Industry?
Key companies in the market include Huntsman International LLC, LORD Corporation, Parson Adhesives Inc, Beacon Adhesives Inc, Avery Dennison Corporation, Solvay, L&L Products, Hexcel Corporation, Henkel AG & Company KGaA, Hybond, Hernon Manufacturing Inc, Permabond LLC, Arkema Group (Bostik SA), Dymax Corporation, DELO Industrie Klebstoffe GmbH & Co KGaA, PPG Industries Inc, Royal Adhesives & Sealants*List Not Exhaustive, Master Bond Inc, Hylomar Group, 3M Company.
3. What are the main segments of the Adhesives in Aerospace Industry?
The market segments include Technology, Resin Type, Function type, End-use.
4. Can you provide details about the market size?
The market size is estimated to be USD 86.62 billion as of 2022.
5. What are some drivers contributing to market growth?
Increasing Penetration of Composites in Aircraft Manufacturing; Increasing Government Spending On Defense in the United States; Rising Demand for Aircraft in Asia-Pacific and Middle-East.
6. What are the notable trends driving market growth?
OEM End-User Industry to Dominate the Market.
7. Are there any restraints impacting market growth?
Poor Performance in Extremely Low Temperature and High Vacuum Environment.
8. Can you provide examples of recent developments in the market?
July 2022: Hexcel Corporation joined Spirit AeroSystems Europe in a strategic collaboration at its Aerospace Innovation Centre (AIC) to develop more sustainable aircraft manufacturing technologies for future aircraft production.
9. What pricing options are available for accessing the report?
Pricing options include single-user, multi-user, and enterprise licenses priced at USD 4750, USD 5250, and USD 8750 respectively.
10. Is the market size provided in terms of value or volume?
The market size is provided in terms of value, measured in billion and volume, measured in Kiloton.
11. Are there any specific market keywords associated with the report?
Yes, the market keyword associated with the report is "Adhesives in Aerospace Industry," which aids in identifying and referencing the specific market segment covered.
12. How do I determine which pricing option suits my needs best?
The pricing options vary based on user requirements and access needs. Individual users may opt for single-user licenses, while businesses requiring broader access may choose multi-user or enterprise licenses for cost-effective access to the report.
13. Are there any additional resources or data provided in the Adhesives in Aerospace Industry report?
While the report offers comprehensive insights, it's advisable to review the specific contents or supplementary materials provided to ascertain if additional resources or data are available.
14. How can I stay updated on further developments or reports in the Adhesives in Aerospace Industry?
To stay informed about further developments, trends, and reports in the Adhesives in Aerospace Industry, consider subscribing to industry newsletters, following relevant companies and organizations, or regularly checking reputable industry news sources and publications.
Methodology
Step 1 - Identification of Relevant Samples Size from Population Database


Step 2 - Approaches for Defining Global Market Size (Value, Volume* & Price*)

Note*: In applicable scenarios
Step 3 - Data Sources
Primary Research
- Web Analytics
- Survey Reports
- Research Institute
- Latest Research Reports
- Opinion Leaders
Secondary Research
- Annual Reports
- White Paper
- Latest Press Release
- Industry Association
- Paid Database
- Investor Presentations

Step 4 - Data Triangulation
Involves using different sources of information in order to increase the validity of a study
These sources are likely to be stakeholders in a program - participants, other researchers, program staff, other community members, and so on.
Then we put all data in single framework & apply various statistical tools to find out the dynamic on the market.
During the analysis stage, feedback from the stakeholder groups would be compared to determine areas of agreement as well as areas of divergence