
Key Insights
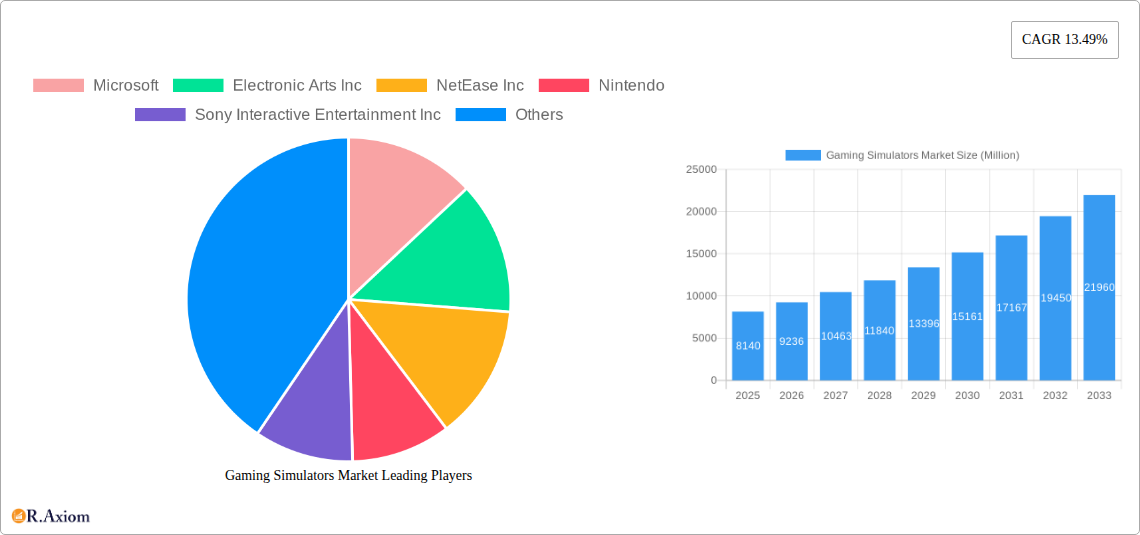
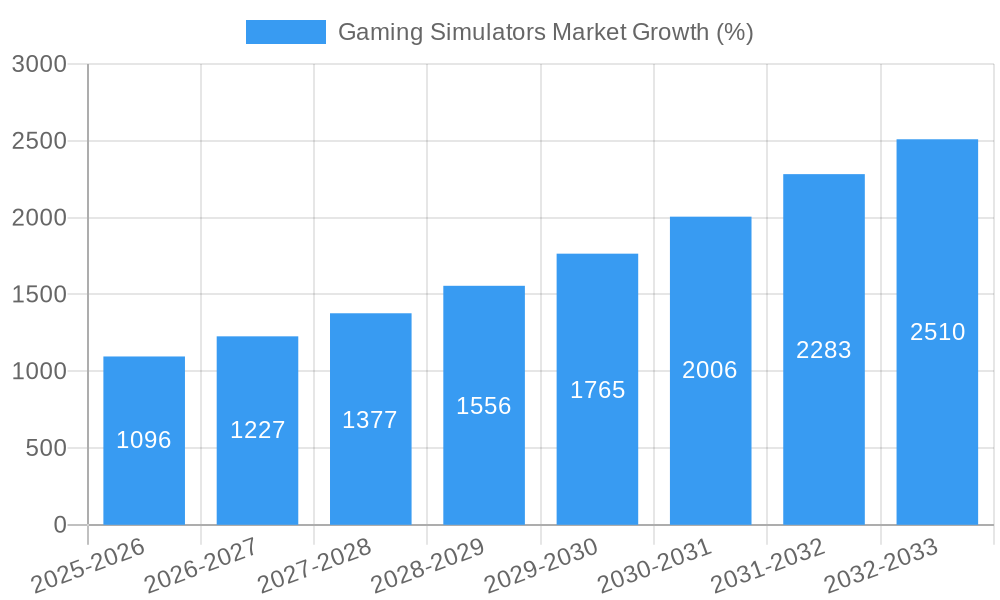
The global gaming simulators market, currently valued at $8.14 billion (2025), is projected to experience robust growth, exhibiting a Compound Annual Growth Rate (CAGR) of 13.49% from 2025 to 2033. This expansion is fueled by several key factors. The increasing popularity of esports and competitive gaming is driving demand for realistic and immersive simulation experiences. Technological advancements, such as improved graphics processing units (GPUs) and virtual reality (VR) headsets, are enhancing the realism and appeal of gaming simulators. Furthermore, the rising adoption of cloud gaming platforms is expanding accessibility, enabling users with lower-spec hardware to participate in high-fidelity simulations. The market is segmented by type (advertising-supported, in-app purchases, and paid apps), providing diverse revenue streams and catering to various consumer preferences. Leading industry players like Microsoft, Electronic Arts, and Tencent are continuously investing in research and development, releasing innovative titles and expanding their market presence. This competitive landscape further fuels innovation and drives market growth.
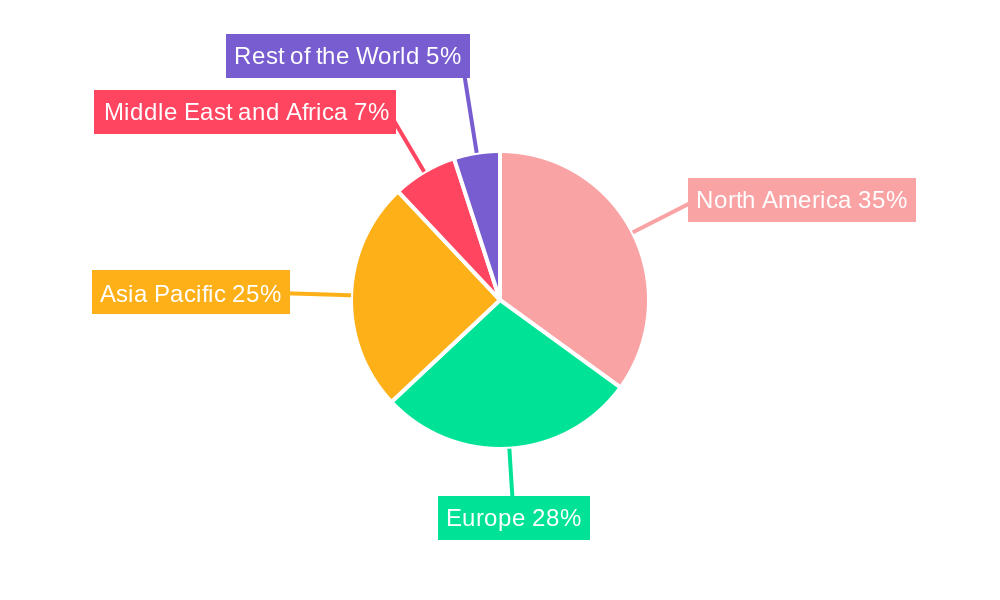
The geographic distribution of the market reveals significant regional variations. North America and Europe currently hold substantial market shares, driven by strong gaming cultures and high disposable incomes. However, the Asia-Pacific region is expected to witness the fastest growth during the forecast period (2025-2033), fueled by increasing smartphone penetration, rising internet access, and a burgeoning young population eager to embrace new gaming technologies. While challenges such as the high initial investment costs for advanced simulators and potential regulatory hurdles exist, the overall market outlook remains optimistic, projecting significant expansion throughout the forecast period. The continued development of engaging content, improved accessibility, and technological advancements will collectively solidify the gaming simulator market's position as a key segment within the broader gaming industry.
Gaming Simulators Market: A Comprehensive Report (2019-2033)
This comprehensive report provides an in-depth analysis of the Gaming Simulators Market, offering valuable insights for industry stakeholders, investors, and businesses seeking to understand this dynamic sector. The study period covers 2019-2033, with a base year of 2025 and a forecast period of 2025-2033. The historical period analyzed is 2019-2024. The market is segmented by type: Advertising, In-App Purchase, and Paid App. Key players include Microsoft, Electronic Arts Inc, NetEase Inc, Nintendo, Sony Interactive Entertainment Inc, Activision Blizzard Inc, Tencent, Square Enix Co Ltd, Take-Two Interactive Software Inc, and Bandai Namco Entertainment Inc. The report projects a xx Million market value by 2033, exhibiting a CAGR of xx% during the forecast period.
Gaming Simulators Market Concentration & Innovation
The Gaming Simulators market exhibits a moderately concentrated landscape, with a few dominant players holding significant market share. However, the market is also characterized by continuous innovation, driven by advancements in graphics processing, AI integration, and virtual reality (VR)/augmented reality (AR) technologies. The market share of the top 5 players is estimated at xx%, with Microsoft, Sony Interactive Entertainment, and Electronic Arts holding the largest shares. Regulatory frameworks, particularly concerning data privacy and content moderation, play a significant role. Substitutes, such as traditional video games and other forms of entertainment, pose a competitive threat. End-user trends, including the increasing demand for immersive experiences and cross-platform compatibility, are shaping product development. M&A activity in the sector has been robust, with several significant deals valued at over xx Million in the last five years. This activity reflects the consolidation efforts by major players and a keen interest in developing new technologies and acquiring promising studios and intellectual properties. For example, the recent acquisition of x company by y company demonstrates the trend toward consolidation and expanding market reach.
- Market Share: Top 5 players hold xx% of the market.
- M&A Activity: Total deal value exceeding xx Million in the last 5 years.
- Innovation Drivers: Advancements in VR/AR, AI, and graphics processing.
- Regulatory Landscape: Data privacy and content moderation are key considerations.
Gaming Simulators Market Industry Trends & Insights
The Gaming Simulators market is experiencing robust growth, driven by several key factors. The increasing affordability and accessibility of high-performance gaming hardware and the widespread adoption of smartphones have significantly expanded the market's reach. Technological disruptions, particularly the integration of AI and cloud gaming, are transforming the gaming experience. Consumer preferences are shifting towards immersive and realistic simulations, demanding higher fidelity graphics and advanced physics engines. The competitive dynamics are intense, with established players and emerging companies vying for market share through product innovation, strategic partnerships, and aggressive marketing campaigns. The market penetration of gaming simulators is expected to increase significantly, driven by the rising adoption of esports and the increasing demand for realistic training simulations in various industries. The market is predicted to reach xx Million by 2033, exhibiting a CAGR of xx% from 2025 to 2033.
Dominant Markets & Segments in Gaming Simulators Market
The North American region currently holds the largest market share in the gaming simulators market, driven by strong consumer demand, a robust gaming infrastructure, and the presence of major gaming companies. Within North America, the United States displays exceptional dominance owing to its strong economy, established gaming culture, and early adoption of new technologies. This dominance is further fueled by favorable economic policies that support technological advancements and a highly developed gaming ecosystem. The "Paid App" segment currently holds the largest share of the market, followed by In-App Purchase and Advertising.
- Key Drivers for North American Dominance:
- Strong consumer spending on gaming.
- Well-established gaming infrastructure.
- High concentration of major gaming companies.
- Early adoption of new gaming technologies.
- Key Drivers for Paid App Segment Dominance:
- High-quality gaming experience.
- Enhanced features and functionalities.
- Lack of interruptions from advertising.
Gaming Simulators Market Product Developments
Recent product innovations in the gaming simulator market have focused on enhanced realism, immersion, and cross-platform compatibility. Technological advancements, such as improved haptic feedback systems, realistic graphics rendering, and AI-powered opponents, are shaping the competitive landscape. The market is seeing a rise in products that offer seamless integration with VR and AR technologies, enhancing the overall gaming experience and creating new avenues for engagement. The key competitive advantage lies in offering a unique and immersive gaming experience that caters to the evolving preferences of gamers.
Report Scope & Segmentation Analysis
The report comprehensively analyzes the Gaming Simulators Market across three key segments:
Advertising: This segment is characterized by a freemium model, where users can access the basic gaming features for free, with revenue generated through advertisements. The market size for this segment is projected to reach xx Million by 2033, with a CAGR of xx%. Competitive dynamics are driven by attracting users and optimizing ad revenue.
In-App Purchase: In this segment, users pay for additional content, features, or virtual goods within the game. The market size is expected to reach xx Million by 2033, exhibiting a CAGR of xx%. Competition centers around providing attractive in-app purchases and optimizing monetization strategies.
Paid App: This segment comprises games that require an upfront payment to access the full gaming experience. The market size for paid apps is anticipated to reach xx Million by 2033, growing at a CAGR of xx%. Competitive dynamics revolve around delivering high-quality gameplay and offering unique features to justify the purchase price.
Key Drivers of Gaming Simulators Market Growth
Several factors fuel the growth of the Gaming Simulators market. Technological advancements, particularly in graphics rendering, AI integration, and VR/AR technologies, are enhancing the realism and immersiveness of gaming experiences. The rising disposable incomes in developing economies are expanding the consumer base. Favorable regulatory policies in several regions are promoting the growth of the gaming industry. Furthermore, the increasing popularity of esports and the demand for professional training simulations in various industries are creating new market opportunities.
Challenges in the Gaming Simulators Market Sector
The Gaming Simulators market faces challenges, including stringent regulatory hurdles in certain regions concerning data privacy and content, leading to increased compliance costs. Supply chain disruptions can impact the availability of essential components, potentially affecting production and market supply. Intense competition from established players and emerging companies puts pressure on profit margins and necessitates constant innovation. The high development costs of advanced gaming simulators also pose a significant challenge for smaller companies.
Emerging Opportunities in Gaming Simulators Market
Emerging opportunities include the expansion into new markets, particularly in developing economies with a growing gaming population. The integration of cloud gaming technologies offers the potential to reach wider audiences and reduce hardware limitations. The increasing demand for realistic simulations in fields such as aviation, automotive, and healthcare creates new application areas for gaming simulators. Furthermore, the convergence of VR/AR with gaming simulators can unlock new levels of immersion and create innovative gaming experiences.
Leading Players in the Gaming Simulators Market Market
- Microsoft
- Electronic Arts Inc
- NetEase Inc
- Nintendo
- Sony Interactive Entertainment Inc
- Activision Blizzard Inc
- Tencent
- Square Enix Co Ltd
- Take-Two Interactive Software Inc
- Bandai Namco Entertainment Inc
Key Developments in Gaming Simulators Market Industry
- February 2022: Gran Turismo SophyTM, a superhuman AI agent, was announced, enhancing AI-powered gaming experiences. This showcases advancements in AI integration within gaming simulators, pushing the boundaries of realism and competition.
- February 2022: Nautilus Mobile secured a USD 5.4 Million investment from Krafton, focusing on developing new sports gaming environments in India. This highlights the growing interest in mobile gaming and regional market expansion, particularly in high-growth regions.
Strategic Outlook for Gaming Simulators Market Market
The Gaming Simulators market exhibits significant future potential, driven by continuous technological advancements and expanding consumer demand. The convergence of gaming with other sectors, such as healthcare, education, and professional training, will create new opportunities. Strategic partnerships and acquisitions will play a critical role in shaping the market landscape. Companies that successfully adapt to evolving consumer preferences and embrace technological innovation will be well-positioned for growth in this dynamic sector.
Gaming Simulators Market Segmentation
-
1. Type
- 1.1. Advertising
- 1.2. In-App Purchase
- 1.3. Paid App
Gaming Simulators Market Segmentation By Geography
- 1. North America
- 2. Europe
- 3. Asia
- 4. Middle East and Africa
- 5. Latin America
Gaming Simulators Market REPORT HIGHLIGHTS
| Aspects | Details |
|---|---|
| Study Period | 2019-2033 |
| Base Year | 2024 |
| Estimated Year | 2025 |
| Forecast Period | 2025-2033 |
| Historical Period | 2019-2024 |
| Growth Rate | CAGR of 13.49% from 2019-2033 |
| Segmentation |
|
Table of Contents
- 1. Introduction
- 1.1. Research Scope
- 1.2. Market Segmentation
- 1.3. Research Methodology
- 1.4. Definitions and Assumptions
- 2. Executive Summary
- 2.1. Introduction
- 3. Market Dynamics
- 3.1. Introduction
- 3.2. Market Drivers
- 3.2.1. Increased Adoption of Smartphones; Increased Utilization of Gaming Simulation for Training and Analysis Across a Variety of Fields; Growing Demand for VR Headsets
- 3.3. Market Restrains
- 3.3.1. Need for Expensive Graphic Cards
- 3.4. Market Trends
- 3.4.1. Increased Adoption of Smartphones is Expected to Drive the Market Growth
- 4. Market Factor Analysis
- 4.1. Porters Five Forces
- 4.2. Supply/Value Chain
- 4.3. PESTEL analysis
- 4.4. Market Entropy
- 4.5. Patent/Trademark Analysis
- 5. Global Gaming Simulators Market Analysis, Insights and Forecast, 2019-2031
- 5.1. Market Analysis, Insights and Forecast - by Type
- 5.1.1. Advertising
- 5.1.2. In-App Purchase
- 5.1.3. Paid App
- 5.2. Market Analysis, Insights and Forecast - by Region
- 5.2.1. North America
- 5.2.2. Europe
- 5.2.3. Asia
- 5.2.4. Middle East and Africa
- 5.2.5. Latin America
- 5.1. Market Analysis, Insights and Forecast - by Type
- 6. North America Gaming Simulators Market Analysis, Insights and Forecast, 2019-2031
- 6.1. Market Analysis, Insights and Forecast - by Type
- 6.1.1. Advertising
- 6.1.2. In-App Purchase
- 6.1.3. Paid App
- 6.1. Market Analysis, Insights and Forecast - by Type
- 7. Europe Gaming Simulators Market Analysis, Insights and Forecast, 2019-2031
- 7.1. Market Analysis, Insights and Forecast - by Type
- 7.1.1. Advertising
- 7.1.2. In-App Purchase
- 7.1.3. Paid App
- 7.1. Market Analysis, Insights and Forecast - by Type
- 8. Asia Gaming Simulators Market Analysis, Insights and Forecast, 2019-2031
- 8.1. Market Analysis, Insights and Forecast - by Type
- 8.1.1. Advertising
- 8.1.2. In-App Purchase
- 8.1.3. Paid App
- 8.1. Market Analysis, Insights and Forecast - by Type
- 9. Middle East and Africa Gaming Simulators Market Analysis, Insights and Forecast, 2019-2031
- 9.1. Market Analysis, Insights and Forecast - by Type
- 9.1.1. Advertising
- 9.1.2. In-App Purchase
- 9.1.3. Paid App
- 9.1. Market Analysis, Insights and Forecast - by Type
- 10. Latin America Gaming Simulators Market Analysis, Insights and Forecast, 2019-2031
- 10.1. Market Analysis, Insights and Forecast - by Type
- 10.1.1. Advertising
- 10.1.2. In-App Purchase
- 10.1.3. Paid App
- 10.1. Market Analysis, Insights and Forecast - by Type
- 11. North America Gaming Simulators Market Analysis, Insights and Forecast, 2019-2031
- 11.1. Market Analysis, Insights and Forecast - By Country/Sub-region
- 11.1.1.
- 12. Europe Gaming Simulators Market Analysis, Insights and Forecast, 2019-2031
- 12.1. Market Analysis, Insights and Forecast - By Country/Sub-region
- 12.1.1.
- 13. Asia Pacific Gaming Simulators Market Analysis, Insights and Forecast, 2019-2031
- 13.1. Market Analysis, Insights and Forecast - By Country/Sub-region
- 13.1.1.
- 14. Middle East and Africa Gaming Simulators Market Analysis, Insights and Forecast, 2019-2031
- 14.1. Market Analysis, Insights and Forecast - By Country/Sub-region
- 14.1.1.
- 15. Rest of the World Gaming Simulators Market Analysis, Insights and Forecast, 2019-2031
- 15.1. Market Analysis, Insights and Forecast - By Country/Sub-region
- 15.1.1.
- 16. Competitive Analysis
- 16.1. Global Market Share Analysis 2024
- 16.2. Company Profiles
- 16.2.1 Microsoft
- 16.2.1.1. Overview
- 16.2.1.2. Products
- 16.2.1.3. SWOT Analysis
- 16.2.1.4. Recent Developments
- 16.2.1.5. Financials (Based on Availability)
- 16.2.2 Electronic Arts Inc
- 16.2.2.1. Overview
- 16.2.2.2. Products
- 16.2.2.3. SWOT Analysis
- 16.2.2.4. Recent Developments
- 16.2.2.5. Financials (Based on Availability)
- 16.2.3 NetEase Inc
- 16.2.3.1. Overview
- 16.2.3.2. Products
- 16.2.3.3. SWOT Analysis
- 16.2.3.4. Recent Developments
- 16.2.3.5. Financials (Based on Availability)
- 16.2.4 Nintendo
- 16.2.4.1. Overview
- 16.2.4.2. Products
- 16.2.4.3. SWOT Analysis
- 16.2.4.4. Recent Developments
- 16.2.4.5. Financials (Based on Availability)
- 16.2.5 Sony Interactive Entertainment Inc
- 16.2.5.1. Overview
- 16.2.5.2. Products
- 16.2.5.3. SWOT Analysis
- 16.2.5.4. Recent Developments
- 16.2.5.5. Financials (Based on Availability)
- 16.2.6 Activision Blizzard Inc
- 16.2.6.1. Overview
- 16.2.6.2. Products
- 16.2.6.3. SWOT Analysis
- 16.2.6.4. Recent Developments
- 16.2.6.5. Financials (Based on Availability)
- 16.2.7 Tencent
- 16.2.7.1. Overview
- 16.2.7.2. Products
- 16.2.7.3. SWOT Analysis
- 16.2.7.4. Recent Developments
- 16.2.7.5. Financials (Based on Availability)
- 16.2.8 Square Enix Co Ltd *List Not Exhaustive
- 16.2.8.1. Overview
- 16.2.8.2. Products
- 16.2.8.3. SWOT Analysis
- 16.2.8.4. Recent Developments
- 16.2.8.5. Financials (Based on Availability)
- 16.2.9 Take-Two Interactive Software Inc
- 16.2.9.1. Overview
- 16.2.9.2. Products
- 16.2.9.3. SWOT Analysis
- 16.2.9.4. Recent Developments
- 16.2.9.5. Financials (Based on Availability)
- 16.2.10 Bandai Namco Entertainment Inc
- 16.2.10.1. Overview
- 16.2.10.2. Products
- 16.2.10.3. SWOT Analysis
- 16.2.10.4. Recent Developments
- 16.2.10.5. Financials (Based on Availability)
- 16.2.1 Microsoft
List of Figures
- Figure 1: Global Gaming Simulators Market Revenue Breakdown (Million, %) by Region 2024 & 2032
- Figure 2: North America Gaming Simulators Market Revenue (Million), by Country 2024 & 2032
- Figure 3: North America Gaming Simulators Market Revenue Share (%), by Country 2024 & 2032
- Figure 4: Europe Gaming Simulators Market Revenue (Million), by Country 2024 & 2032
- Figure 5: Europe Gaming Simulators Market Revenue Share (%), by Country 2024 & 2032
- Figure 6: Asia Pacific Gaming Simulators Market Revenue (Million), by Country 2024 & 2032
- Figure 7: Asia Pacific Gaming Simulators Market Revenue Share (%), by Country 2024 & 2032
- Figure 8: Middle East and Africa Gaming Simulators Market Revenue (Million), by Country 2024 & 2032
- Figure 9: Middle East and Africa Gaming Simulators Market Revenue Share (%), by Country 2024 & 2032
- Figure 10: Rest of the World Gaming Simulators Market Revenue (Million), by Country 2024 & 2032
- Figure 11: Rest of the World Gaming Simulators Market Revenue Share (%), by Country 2024 & 2032
- Figure 12: North America Gaming Simulators Market Revenue (Million), by Type 2024 & 2032
- Figure 13: North America Gaming Simulators Market Revenue Share (%), by Type 2024 & 2032
- Figure 14: North America Gaming Simulators Market Revenue (Million), by Country 2024 & 2032
- Figure 15: North America Gaming Simulators Market Revenue Share (%), by Country 2024 & 2032
- Figure 16: Europe Gaming Simulators Market Revenue (Million), by Type 2024 & 2032
- Figure 17: Europe Gaming Simulators Market Revenue Share (%), by Type 2024 & 2032
- Figure 18: Europe Gaming Simulators Market Revenue (Million), by Country 2024 & 2032
- Figure 19: Europe Gaming Simulators Market Revenue Share (%), by Country 2024 & 2032
- Figure 20: Asia Gaming Simulators Market Revenue (Million), by Type 2024 & 2032
- Figure 21: Asia Gaming Simulators Market Revenue Share (%), by Type 2024 & 2032
- Figure 22: Asia Gaming Simulators Market Revenue (Million), by Country 2024 & 2032
- Figure 23: Asia Gaming Simulators Market Revenue Share (%), by Country 2024 & 2032
- Figure 24: Middle East and Africa Gaming Simulators Market Revenue (Million), by Type 2024 & 2032
- Figure 25: Middle East and Africa Gaming Simulators Market Revenue Share (%), by Type 2024 & 2032
- Figure 26: Middle East and Africa Gaming Simulators Market Revenue (Million), by Country 2024 & 2032
- Figure 27: Middle East and Africa Gaming Simulators Market Revenue Share (%), by Country 2024 & 2032
- Figure 28: Latin America Gaming Simulators Market Revenue (Million), by Type 2024 & 2032
- Figure 29: Latin America Gaming Simulators Market Revenue Share (%), by Type 2024 & 2032
- Figure 30: Latin America Gaming Simulators Market Revenue (Million), by Country 2024 & 2032
- Figure 31: Latin America Gaming Simulators Market Revenue Share (%), by Country 2024 & 2032
List of Tables
- Table 1: Global Gaming Simulators Market Revenue Million Forecast, by Region 2019 & 2032
- Table 2: Global Gaming Simulators Market Revenue Million Forecast, by Type 2019 & 2032
- Table 3: Global Gaming Simulators Market Revenue Million Forecast, by Region 2019 & 2032
- Table 4: Global Gaming Simulators Market Revenue Million Forecast, by Country 2019 & 2032
- Table 5: Gaming Simulators Market Revenue (Million) Forecast, by Application 2019 & 2032
- Table 6: Global Gaming Simulators Market Revenue Million Forecast, by Country 2019 & 2032
- Table 7: Gaming Simulators Market Revenue (Million) Forecast, by Application 2019 & 2032
- Table 8: Global Gaming Simulators Market Revenue Million Forecast, by Country 2019 & 2032
- Table 9: Gaming Simulators Market Revenue (Million) Forecast, by Application 2019 & 2032
- Table 10: Global Gaming Simulators Market Revenue Million Forecast, by Country 2019 & 2032
- Table 11: Gaming Simulators Market Revenue (Million) Forecast, by Application 2019 & 2032
- Table 12: Global Gaming Simulators Market Revenue Million Forecast, by Country 2019 & 2032
- Table 13: Gaming Simulators Market Revenue (Million) Forecast, by Application 2019 & 2032
- Table 14: Global Gaming Simulators Market Revenue Million Forecast, by Type 2019 & 2032
- Table 15: Global Gaming Simulators Market Revenue Million Forecast, by Country 2019 & 2032
- Table 16: Global Gaming Simulators Market Revenue Million Forecast, by Type 2019 & 2032
- Table 17: Global Gaming Simulators Market Revenue Million Forecast, by Country 2019 & 2032
- Table 18: Global Gaming Simulators Market Revenue Million Forecast, by Type 2019 & 2032
- Table 19: Global Gaming Simulators Market Revenue Million Forecast, by Country 2019 & 2032
- Table 20: Global Gaming Simulators Market Revenue Million Forecast, by Type 2019 & 2032
- Table 21: Global Gaming Simulators Market Revenue Million Forecast, by Country 2019 & 2032
- Table 22: Global Gaming Simulators Market Revenue Million Forecast, by Type 2019 & 2032
- Table 23: Global Gaming Simulators Market Revenue Million Forecast, by Country 2019 & 2032
Frequently Asked Questions
1. What is the projected Compound Annual Growth Rate (CAGR) of the Gaming Simulators Market?
The projected CAGR is approximately 13.49%.
2. Which companies are prominent players in the Gaming Simulators Market?
Key companies in the market include Microsoft, Electronic Arts Inc, NetEase Inc, Nintendo, Sony Interactive Entertainment Inc, Activision Blizzard Inc, Tencent, Square Enix Co Ltd *List Not Exhaustive, Take-Two Interactive Software Inc, Bandai Namco Entertainment Inc.
3. What are the main segments of the Gaming Simulators Market?
The market segments include Type.
4. Can you provide details about the market size?
The market size is estimated to be USD 8.14 Million as of 2022.
5. What are some drivers contributing to market growth?
Increased Adoption of Smartphones; Increased Utilization of Gaming Simulation for Training and Analysis Across a Variety of Fields; Growing Demand for VR Headsets.
6. What are the notable trends driving market growth?
Increased Adoption of Smartphones is Expected to Drive the Market Growth.
7. Are there any restraints impacting market growth?
Need for Expensive Graphic Cards.
8. Can you provide examples of recent developments in the market?
February 2022 - Gran Turismo SophyTM, the first superhuman AI agent to exceed the world's prominent drivers in the realistic PlayStation 4 racing simulation game Gran Turismo Sport, was announced by Polyphony Digital Inc. (PDI), and Sony Interactive Entertainment (SIE). Gamers all across the world will be able to access AI-powered gaming experiences delivered by GT Sophy.
9. What pricing options are available for accessing the report?
Pricing options include single-user, multi-user, and enterprise licenses priced at USD 4750, USD 5250, and USD 8750 respectively.
10. Is the market size provided in terms of value or volume?
The market size is provided in terms of value, measured in Million.
11. Are there any specific market keywords associated with the report?
Yes, the market keyword associated with the report is "Gaming Simulators Market," which aids in identifying and referencing the specific market segment covered.
12. How do I determine which pricing option suits my needs best?
The pricing options vary based on user requirements and access needs. Individual users may opt for single-user licenses, while businesses requiring broader access may choose multi-user or enterprise licenses for cost-effective access to the report.
13. Are there any additional resources or data provided in the Gaming Simulators Market report?
While the report offers comprehensive insights, it's advisable to review the specific contents or supplementary materials provided to ascertain if additional resources or data are available.
14. How can I stay updated on further developments or reports in the Gaming Simulators Market?
To stay informed about further developments, trends, and reports in the Gaming Simulators Market, consider subscribing to industry newsletters, following relevant companies and organizations, or regularly checking reputable industry news sources and publications.
Methodology
Step 1 - Identification of Relevant Samples Size from Population Database


Step 2 - Approaches for Defining Global Market Size (Value, Volume* & Price*)

Note*: In applicable scenarios
Step 3 - Data Sources
Primary Research
- Web Analytics
- Survey Reports
- Research Institute
- Latest Research Reports
- Opinion Leaders
Secondary Research
- Annual Reports
- White Paper
- Latest Press Release
- Industry Association
- Paid Database
- Investor Presentations

Step 4 - Data Triangulation
Involves using different sources of information in order to increase the validity of a study
These sources are likely to be stakeholders in a program - participants, other researchers, program staff, other community members, and so on.
Then we put all data in single framework & apply various statistical tools to find out the dynamic on the market.
During the analysis stage, feedback from the stakeholder groups would be compared to determine areas of agreement as well as areas of divergence


