
Key Insights
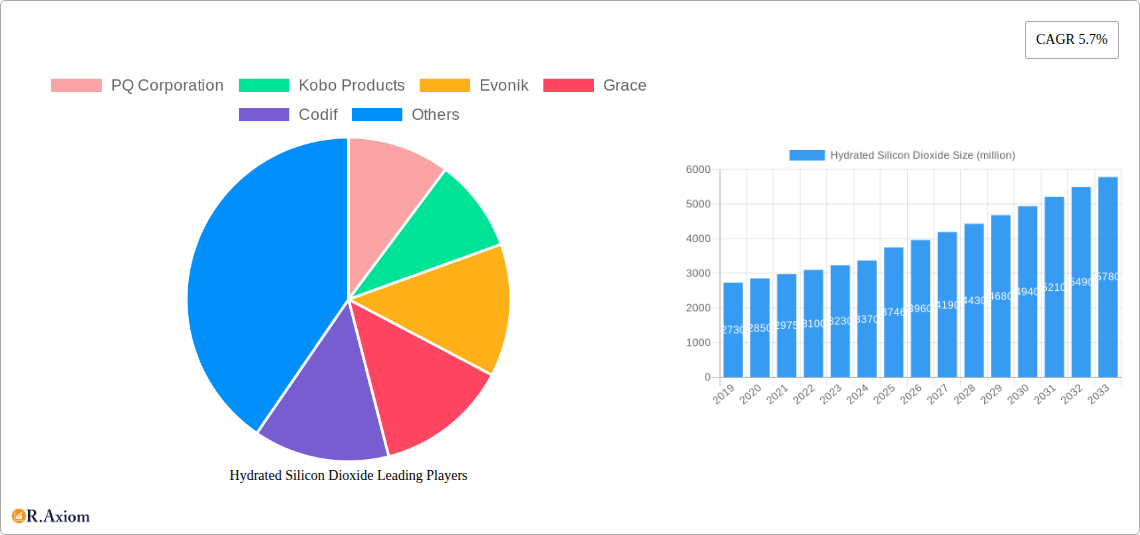
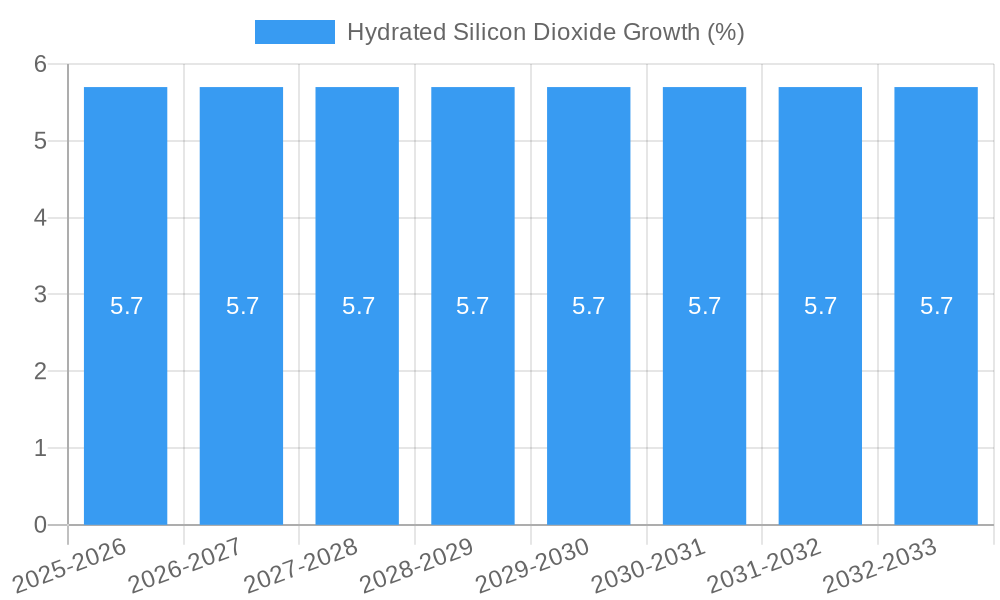
The global Hydrated Silicon Dioxide market is poised for robust expansion, projected to reach an estimated value of \$3,746 million by 2025, with a compelling Compound Annual Growth Rate (CAGR) of 5.7% during the forecast period of 2025-2033. This growth is fueled by a confluence of increasing demand across diverse industrial applications, including its pivotal role as revitalizing and exfoliating agents in the personal care sector, and its essential function as anti-caking agents in food and pharmaceuticals. The rising consumer consciousness towards efficacy and safety in cosmetic and personal care products further propels the adoption of high-quality hydrated silicon dioxide for its superior performance characteristics. Additionally, its utility in improving the texture, stability, and flow properties of various products ensures sustained demand.
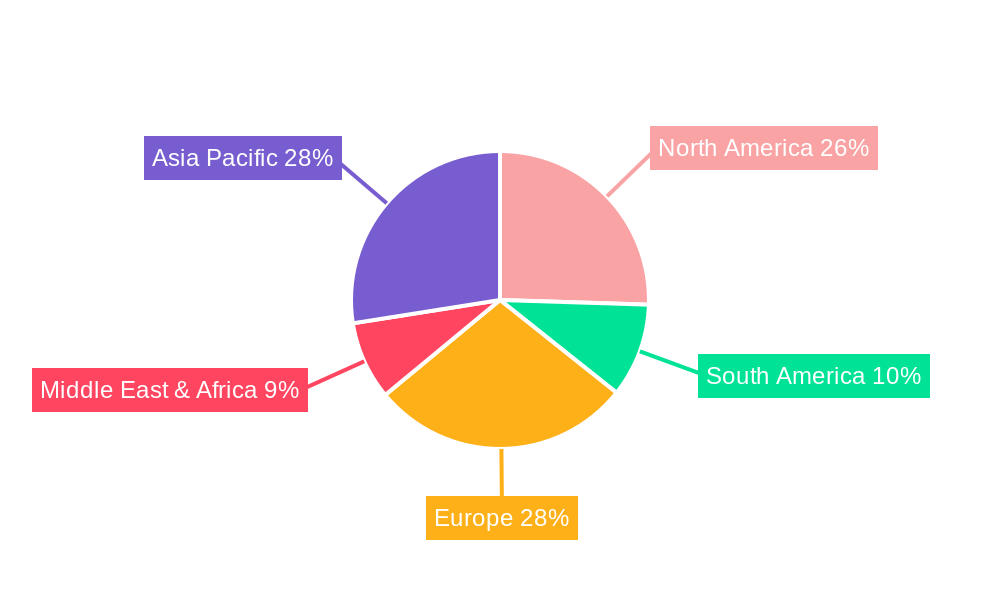
The market's trajectory is significantly influenced by key drivers such as advancements in manufacturing technologies that enhance the purity and performance of hydrated silicon dioxide, alongside its growing application in emerging industries like advanced materials and high-performance coatings. The trend towards sustainable and eco-friendly formulations in consumer goods also benefits hydrated silicon dioxide due to its natural origin and biodegradability. While the market presents significant opportunities, it also faces certain restraints, including the fluctuating prices of raw materials and the development of alternative materials. However, strategic innovations and a focus on specialized applications are expected to mitigate these challenges. Geographically, the Asia Pacific region is anticipated to lead market growth due to rapid industrialization and escalating consumer demand, followed closely by North America and Europe, underscoring the global significance and dynamic nature of the hydrated silicon dioxide market.
Hydrated Silicon Dioxide Market Concentration & Innovation
The global hydrated silicon dioxide market exhibits a moderate concentration, with a few key players holding significant market share, estimated at over 30% combined. PQ Corporation, Evonik, and Grace are recognized leaders, their market dominance fueled by extensive research and development investments, focusing on enhancing particle size control, porosity, and surface area for specialized applications. Innovation drivers are primarily centered around developing advanced grades for high-performance formulations in cosmetics, pharmaceuticals, and specialty coatings. For instance, the development of micronized hydrated silicon dioxide has opened new avenues in personal care products as effective exfoliants and mattifying agents. Regulatory frameworks, particularly REACH in Europe and TSCA in the United States, are influencing product development, mandating stringent purity standards and safety assessments, thus creating barriers to entry for smaller manufacturers. Product substitutes, while present in some applications like traditional abrasives, struggle to match the versatile performance characteristics of hydrated silicon dioxide, such as its high absorbency and rheological properties, which are crucial for many end-user segments. End-user trends showcase a growing demand for natural and sustainable ingredients in cosmetics, pushing manufacturers to explore eco-friendly production methods for hydrated silicon dioxide. Mergers and acquisitions (M&A) activities have been relatively subdued in recent years, with reported M&A deal values in the low millions, primarily focused on consolidating market positions or acquiring niche technologies rather than broad market expansion. The overall trend suggests a strategic consolidation around innovation and specialization.
Hydrated Silicon Dioxide Industry Trends & Insights
The hydrated silicon dioxide market is poised for robust growth, projected to expand at a Compound Annual Growth Rate (CAGR) of approximately 6.5% during the forecast period of 2025–2033. This steady expansion is driven by a confluence of factors, including burgeoning demand from the personal care industry, where its use as a revitalizing agent, exfoliant, and mattifying agent is increasingly favored. The pharmaceutical sector also contributes significantly, utilizing hydrated silicon dioxide as a high-performance excipient and anti-caking agent in solid dosage forms. Technological disruptions are playing a pivotal role, with advancements in synthesis and purification techniques enabling the production of precisely engineered hydrated silicon dioxide grades tailored for specific functionalities. For example, sol-gel methods are yielding highly porous and surface-functionalized particles with superior absorbency and binding capabilities, thereby enhancing drug delivery systems and cosmetic formulations. Consumer preferences are shifting towards natural ingredients and enhanced product efficacy. Hydrated silicon dioxide, derived from silica, aligns well with the demand for naturally sourced materials, particularly in cosmetics. Its ability to absorb oils and provide a smooth texture makes it a sought-after ingredient in skincare and makeup. The competitive dynamics within the industry are characterized by a focus on product differentiation through particle morphology, surface modification, and purity levels. Companies are investing heavily in R&D to develop proprietary technologies that offer unique performance benefits. Market penetration is expanding across emerging economies in Asia-Pacific and Latin America, where rising disposable incomes and increasing awareness of personal grooming are fueling demand for premium cosmetic and pharmaceutical products. The global market size for hydrated silicon dioxide was estimated to be around 1.2 billion in the base year 2025 and is projected to reach over 2.0 billion by 2033. The historical period from 2019–2024 witnessed a steady growth trajectory, with the market size reaching approximately 1.1 billion by the end of 2024. This sustained upward momentum is indicative of the material's enduring utility and adaptability across diverse industrial applications, making it a vital component in the manufacturing landscape.
Dominant Markets & Segments in Hydrated Silicon Dioxide
The global hydrated silicon dioxide market is characterized by distinct regional and application dominance. North America and Europe currently hold the largest market share, driven by established industries in cosmetics, pharmaceuticals, and food & beverage. However, the Asia-Pacific region is experiencing the most rapid growth, with countries like China and India emerging as significant consumers and producers, fueled by expanding manufacturing bases and increasing disposable incomes.
Application Dominance:
Revitalizing Agents: This segment, particularly within the personal care industry, is a major growth driver. The demand for advanced skincare formulations that offer skin renewal and improved texture is high.
- Key Drivers: Growing consumer focus on anti-aging products, increased disposable income, and the trend towards natural ingredients in cosmetics.
- Detailed Dominance: In this segment, hydrated silicon dioxide's fine particle size and abrasive properties make it an excellent choice for gentle yet effective skin exfoliation, promoting cell turnover and a brighter complexion. Leading companies are investing in micronization and surface treatments to optimize its performance in creams, serums, and masks. The market size for this application alone is projected to reach over 500 million by 2033.
Exfoliants Agents: Closely linked to revitalizing agents, the role of hydrated silicon dioxide as a physical exfoliant is paramount in both skincare and body care products.
- Key Drivers: Popularity of physical exfoliants over chemical ones due to perceived gentleness, demand for multi-functional ingredients.
- Detailed Dominance: Its spherical morphology and controlled particle size distribution allow for consistent and effective removal of dead skin cells without causing micro-tears, contributing to smoother and more radiant skin. The market penetration in this sub-segment is significant, with consumers actively seeking products that deliver visible results.
Whitening: While not a primary application, hydrated silicon dioxide plays a supportive role in certain industrial coatings and materials where opacity and brightness are desired.
- Key Drivers: Demand in specialized industrial applications requiring enhanced brightness.
- Detailed Dominance: In specific industrial settings, its inherent opacity can contribute to the whitening effect of paints, paper, and plastics, though this is a niche area compared to its cosmetic and pharmaceutical uses.
Anti-Caking Agents: This is a crucial application in the food and pharmaceutical industries, preventing clumping and ensuring product flowability.
- Key Drivers: Strict quality control in food and pharmaceutical manufacturing, demand for stable and free-flowing powders.
- Detailed Dominance: Its porous structure effectively absorbs moisture, preventing agglomeration of particles in powdered food products, medications, and industrial powders. The stringent regulatory requirements for food-grade and pharmaceutical-grade hydrated silicon dioxide necessitate high purity and well-defined properties, leading to premium pricing for these grades. The global market for anti-caking agents is substantial, with hydrated silicon dioxide holding a significant share estimated at over 300 million.
Other: This broad category encompasses diverse applications such as matting agents in paints and coatings, carriers for active ingredients, and reinforcing fillers in rubber and plastics.
- Key Drivers: Versatility in industrial applications, performance enhancement in composite materials.
- Detailed Dominance: The unique surface chemistry and particle structure of hydrated silicon dioxide allow it to impart desirable properties like improved tensile strength, abrasion resistance, and controlled gloss reduction in various materials.
Type Dominance:
Powder: This is the most prevalent form of hydrated silicon dioxide due to its ease of handling, incorporation into formulations, and versatility across applications.
- Key Drivers: Ease of use in manufacturing, broad applicability across segments.
- Detailed Dominance: Powdered hydrated silicon dioxide offers excellent dispersibility and can be readily incorporated into liquid or solid matrices. Its particle size can be precisely controlled, allowing for tailored functionalities in fine powders for cosmetics and free-flowing powders for industrial use. The market for powdered hydrated silicon dioxide is expected to account for over 80% of the total market value.
Granules: While less common, granular forms are utilized in specific applications where controlled release or larger particle size is advantageous, such as in certain agricultural or specialized industrial processes.
- Key Drivers: Niche applications requiring controlled dissolution or larger particle sizes.
- Detailed Dominance: Granular forms are typically employed in applications where dust generation needs to be minimized or where a slower dissolution rate is desired. This segment represents a smaller but stable portion of the market.
Hydrated Silicon Dioxide Product Developments
Revitalizing Agents: This segment, particularly within the personal care industry, is a major growth driver. The demand for advanced skincare formulations that offer skin renewal and improved texture is high.
- Key Drivers: Growing consumer focus on anti-aging products, increased disposable income, and the trend towards natural ingredients in cosmetics.
- Detailed Dominance: In this segment, hydrated silicon dioxide's fine particle size and abrasive properties make it an excellent choice for gentle yet effective skin exfoliation, promoting cell turnover and a brighter complexion. Leading companies are investing in micronization and surface treatments to optimize its performance in creams, serums, and masks. The market size for this application alone is projected to reach over 500 million by 2033.
Exfoliants Agents: Closely linked to revitalizing agents, the role of hydrated silicon dioxide as a physical exfoliant is paramount in both skincare and body care products.
- Key Drivers: Popularity of physical exfoliants over chemical ones due to perceived gentleness, demand for multi-functional ingredients.
- Detailed Dominance: Its spherical morphology and controlled particle size distribution allow for consistent and effective removal of dead skin cells without causing micro-tears, contributing to smoother and more radiant skin. The market penetration in this sub-segment is significant, with consumers actively seeking products that deliver visible results.
Whitening: While not a primary application, hydrated silicon dioxide plays a supportive role in certain industrial coatings and materials where opacity and brightness are desired.
- Key Drivers: Demand in specialized industrial applications requiring enhanced brightness.
- Detailed Dominance: In specific industrial settings, its inherent opacity can contribute to the whitening effect of paints, paper, and plastics, though this is a niche area compared to its cosmetic and pharmaceutical uses.
Anti-Caking Agents: This is a crucial application in the food and pharmaceutical industries, preventing clumping and ensuring product flowability.
- Key Drivers: Strict quality control in food and pharmaceutical manufacturing, demand for stable and free-flowing powders.
- Detailed Dominance: Its porous structure effectively absorbs moisture, preventing agglomeration of particles in powdered food products, medications, and industrial powders. The stringent regulatory requirements for food-grade and pharmaceutical-grade hydrated silicon dioxide necessitate high purity and well-defined properties, leading to premium pricing for these grades. The global market for anti-caking agents is substantial, with hydrated silicon dioxide holding a significant share estimated at over 300 million.
Other: This broad category encompasses diverse applications such as matting agents in paints and coatings, carriers for active ingredients, and reinforcing fillers in rubber and plastics.
- Key Drivers: Versatility in industrial applications, performance enhancement in composite materials.
- Detailed Dominance: The unique surface chemistry and particle structure of hydrated silicon dioxide allow it to impart desirable properties like improved tensile strength, abrasion resistance, and controlled gloss reduction in various materials.
Powder: This is the most prevalent form of hydrated silicon dioxide due to its ease of handling, incorporation into formulations, and versatility across applications.
- Key Drivers: Ease of use in manufacturing, broad applicability across segments.
- Detailed Dominance: Powdered hydrated silicon dioxide offers excellent dispersibility and can be readily incorporated into liquid or solid matrices. Its particle size can be precisely controlled, allowing for tailored functionalities in fine powders for cosmetics and free-flowing powders for industrial use. The market for powdered hydrated silicon dioxide is expected to account for over 80% of the total market value.
Granules: While less common, granular forms are utilized in specific applications where controlled release or larger particle size is advantageous, such as in certain agricultural or specialized industrial processes.
- Key Drivers: Niche applications requiring controlled dissolution or larger particle sizes.
- Detailed Dominance: Granular forms are typically employed in applications where dust generation needs to be minimized or where a slower dissolution rate is desired. This segment represents a smaller but stable portion of the market.
Hydrated Silicon Dioxide Product Developments
Recent product developments in hydrated silicon dioxide focus on enhancing its functionality for advanced applications. Companies are innovating in particle size reduction, surface modification, and porosity control to create highly specialized grades. For instance, developments include ultra-fine micronized powders for superior skin feel in cosmetics and high-purity grades for pharmaceutical excipients with optimized flow properties. The creation of amorphous silica particles with specific surface chemistries allows for improved compatibility with different matrices and enhanced performance as reinforcing agents in elastomers. These innovations aim to provide manufacturers with solutions that offer superior efficacy, improved formulation stability, and unique sensory attributes, thereby securing a competitive advantage in their respective end markets.
Report Scope & Segmentation Analysis
This report meticulously analyzes the global hydrated silicon dioxide market, segmenting it across key applications and product types. The application segmentation includes Revitalizing Agents, Exfoliants Agents, Whitening, Anti-Caking Agents, and Other. The product type segmentation encompasses Granules and Powder. For Revitalizing Agents, growth is projected at a CAGR of 7.0%, with a market size estimated at 500 million in 2025, driven by the cosmetics industry. Exfoliants Agents are expected to grow at a CAGR of 6.8%, contributing 450 million. Whitening, a smaller segment, is forecast to grow at 5.5%. Anti-Caking Agents, crucial for food and pharmaceuticals, show a stable CAGR of 6.0%, with a market size of 300 million. The Other segment, encompassing industrial uses, is projected to grow at 6.2%. In terms of product types, Powdered hydrated silicon dioxide dominates, projected to reach 1.8 billion by 2033 with a CAGR of 6.6%, owing to its widespread use. Granules, a niche segment, are expected to grow at a CAGR of 5.8%.
Key Drivers of Hydrated Silicon Dioxide Growth
The growth of the hydrated silicon dioxide market is propelled by several key drivers. Firstly, the burgeoning demand from the personal care and cosmetics industry, driven by consumer preference for advanced skincare formulations, revitalizing agents, and gentle exfoliants, is a primary catalyst. Secondly, the pharmaceutical sector's increasing reliance on hydrated silicon dioxide as a high-performance excipient and anti-caking agent in solid dosage forms, ensuring product stability and flowability, significantly contributes to market expansion. Thirdly, technological advancements in synthesis and processing, leading to the development of specialized grades with tailored particle sizes, surface chemistries, and porosity, enable enhanced performance across diverse applications. Furthermore, the global trend towards natural and sustainable ingredients favors hydrated silicon dioxide, derived from abundant silica.
Challenges in the Hydrated Silicon Dioxide Sector
Despite the positive growth trajectory, the hydrated silicon dioxide sector faces several challenges. Stringent regulatory approvals and evolving compliance standards, particularly for food-grade and pharmaceutical-grade materials, can lead to extended development timelines and increased costs. Fluctuations in raw material prices, primarily silica, can impact production costs and profit margins. Intense competition among established players and emerging manufacturers, especially in the commoditized segments, exerts downward pressure on pricing. Supply chain disruptions, as witnessed globally, can affect the availability and timely delivery of essential raw materials, potentially hindering production schedules and market responsiveness. The need for specialized manufacturing expertise and equipment to produce high-purity and precisely engineered grades also presents a barrier to entry for new players.
Emerging Opportunities in Hydrated Silicon Dioxide
Emerging opportunities for hydrated silicon dioxide lie in the development of novel applications and the expansion into underserved markets. The increasing focus on sustainable and biodegradable materials in various industries presents an opportunity for hydrated silicon dioxide as an eco-friendly additive. Advancements in nanotechnology are paving the way for its use in advanced drug delivery systems, targeted therapies, and nano-composite materials with enhanced properties. The growing demand for functional food ingredients that offer health benefits and improve texture presents another avenue for growth. Furthermore, the expanding middle class in emerging economies, particularly in Asia-Pacific and Africa, offers significant untapped potential for personal care and pharmaceutical products, thereby driving demand for hydrated silicon dioxide. Exploring partnerships for localized production and distribution in these regions can unlock substantial market share.
Leading Players in the Hydrated Silicon Dioxide Market
PQ Corporation Kobo Products Evonik Grace Codif BASF Alban Muller International Uniproma Chemical Solvay Kowa American Corporation (Kowa Group)
Key Developments in Hydrated Silicon Dioxide Industry
- 2023 July: Evonik launches new high-purity hydrated silica for pharmaceutical applications, focusing on improved compressibility and flowability.
- 2022 December: Grace announces expansion of its hydrated silicon dioxide production capacity to meet growing demand from the personal care sector.
- 2021 September: Kobo Products introduces a novel surface-modified hydrated silicon dioxide for enhanced mattifying effects in cosmetic formulations.
- 2020 March: BASF showcases its latest advancements in using hydrated silicon dioxide as a rheology modifier in industrial coatings.
- 2019 August: PQ Corporation acquires a specialist producer of precipitated silica, strengthening its portfolio in anti-caking applications.
Strategic Outlook for Hydrated Silicon Dioxide Market
The strategic outlook for the hydrated silicon dioxide market remains highly positive, characterized by sustained growth driven by innovation and expanding application frontiers. Key growth catalysts include the continuous development of advanced grades tailored for high-value applications in personal care and pharmaceuticals, coupled with a strong emphasis on sustainability and natural ingredients. Strategic investments in R&D to unlock new functionalities and optimize production processes will be crucial for market leaders. Furthermore, expanding geographical reach, particularly in high-growth emerging markets, and forging strategic alliances to leverage local expertise and distribution networks will be vital for capturing market share. The ability to adapt to evolving regulatory landscapes and consumer preferences will ultimately define long-term success in this dynamic sector.
Hydrated Silicon Dioxide Segmentation
-
1. Application
- 1.1. Revitalizing Agents
- 1.2. Exfoliants Agents
- 1.3. Whitening
- 1.4. Anti-Caking Agents
- 1.5. Other
-
2. Types
- 2.1. Granules
- 2.2. Powder
Hydrated Silicon Dioxide Segmentation By Geography
-
1. North America
- 1.1. United States
- 1.2. Canada
- 1.3. Mexico
-
2. South America
- 2.1. Brazil
- 2.2. Argentina
- 2.3. Rest of South America
-
3. Europe
- 3.1. United Kingdom
- 3.2. Germany
- 3.3. France
- 3.4. Italy
- 3.5. Spain
- 3.6. Russia
- 3.7. Benelux
- 3.8. Nordics
- 3.9. Rest of Europe
-
4. Middle East & Africa
- 4.1. Turkey
- 4.2. Israel
- 4.3. GCC
- 4.4. North Africa
- 4.5. South Africa
- 4.6. Rest of Middle East & Africa
-
5. Asia Pacific
- 5.1. China
- 5.2. India
- 5.3. Japan
- 5.4. South Korea
- 5.5. ASEAN
- 5.6. Oceania
- 5.7. Rest of Asia Pacific
Hydrated Silicon Dioxide REPORT HIGHLIGHTS
| Aspects | Details |
|---|---|
| Study Period | 2019-2033 |
| Base Year | 2024 |
| Estimated Year | 2025 |
| Forecast Period | 2025-2033 |
| Historical Period | 2019-2024 |
| Growth Rate | CAGR of 5.7% from 2019-2033 |
| Segmentation |
|
Table of Contents
- 1. Introduction
- 1.1. Research Scope
- 1.2. Market Segmentation
- 1.3. Research Methodology
- 1.4. Definitions and Assumptions
- 2. Executive Summary
- 2.1. Introduction
- 3. Market Dynamics
- 3.1. Introduction
- 3.2. Market Drivers
- 3.3. Market Restrains
- 3.4. Market Trends
- 4. Market Factor Analysis
- 4.1. Porters Five Forces
- 4.2. Supply/Value Chain
- 4.3. PESTEL analysis
- 4.4. Market Entropy
- 4.5. Patent/Trademark Analysis
- 5. Global Hydrated Silicon Dioxide Analysis, Insights and Forecast, 2019-2031
- 5.1. Market Analysis, Insights and Forecast - by Application
- 5.1.1. Revitalizing Agents
- 5.1.2. Exfoliants Agents
- 5.1.3. Whitening
- 5.1.4. Anti-Caking Agents
- 5.1.5. Other
- 5.2. Market Analysis, Insights and Forecast - by Types
- 5.2.1. Granules
- 5.2.2. Powder
- 5.3. Market Analysis, Insights and Forecast - by Region
- 5.3.1. North America
- 5.3.2. South America
- 5.3.3. Europe
- 5.3.4. Middle East & Africa
- 5.3.5. Asia Pacific
- 5.1. Market Analysis, Insights and Forecast - by Application
- 6. North America Hydrated Silicon Dioxide Analysis, Insights and Forecast, 2019-2031
- 6.1. Market Analysis, Insights and Forecast - by Application
- 6.1.1. Revitalizing Agents
- 6.1.2. Exfoliants Agents
- 6.1.3. Whitening
- 6.1.4. Anti-Caking Agents
- 6.1.5. Other
- 6.2. Market Analysis, Insights and Forecast - by Types
- 6.2.1. Granules
- 6.2.2. Powder
- 6.1. Market Analysis, Insights and Forecast - by Application
- 7. South America Hydrated Silicon Dioxide Analysis, Insights and Forecast, 2019-2031
- 7.1. Market Analysis, Insights and Forecast - by Application
- 7.1.1. Revitalizing Agents
- 7.1.2. Exfoliants Agents
- 7.1.3. Whitening
- 7.1.4. Anti-Caking Agents
- 7.1.5. Other
- 7.2. Market Analysis, Insights and Forecast - by Types
- 7.2.1. Granules
- 7.2.2. Powder
- 7.1. Market Analysis, Insights and Forecast - by Application
- 8. Europe Hydrated Silicon Dioxide Analysis, Insights and Forecast, 2019-2031
- 8.1. Market Analysis, Insights and Forecast - by Application
- 8.1.1. Revitalizing Agents
- 8.1.2. Exfoliants Agents
- 8.1.3. Whitening
- 8.1.4. Anti-Caking Agents
- 8.1.5. Other
- 8.2. Market Analysis, Insights and Forecast - by Types
- 8.2.1. Granules
- 8.2.2. Powder
- 8.1. Market Analysis, Insights and Forecast - by Application
- 9. Middle East & Africa Hydrated Silicon Dioxide Analysis, Insights and Forecast, 2019-2031
- 9.1. Market Analysis, Insights and Forecast - by Application
- 9.1.1. Revitalizing Agents
- 9.1.2. Exfoliants Agents
- 9.1.3. Whitening
- 9.1.4. Anti-Caking Agents
- 9.1.5. Other
- 9.2. Market Analysis, Insights and Forecast - by Types
- 9.2.1. Granules
- 9.2.2. Powder
- 9.1. Market Analysis, Insights and Forecast - by Application
- 10. Asia Pacific Hydrated Silicon Dioxide Analysis, Insights and Forecast, 2019-2031
- 10.1. Market Analysis, Insights and Forecast - by Application
- 10.1.1. Revitalizing Agents
- 10.1.2. Exfoliants Agents
- 10.1.3. Whitening
- 10.1.4. Anti-Caking Agents
- 10.1.5. Other
- 10.2. Market Analysis, Insights and Forecast - by Types
- 10.2.1. Granules
- 10.2.2. Powder
- 10.1. Market Analysis, Insights and Forecast - by Application
- 11. Competitive Analysis
- 11.1. Global Market Share Analysis 2024
- 11.2. Company Profiles
- 11.2.1 PQ Corporation
- 11.2.1.1. Overview
- 11.2.1.2. Products
- 11.2.1.3. SWOT Analysis
- 11.2.1.4. Recent Developments
- 11.2.1.5. Financials (Based on Availability)
- 11.2.2 Kobo Products
- 11.2.2.1. Overview
- 11.2.2.2. Products
- 11.2.2.3. SWOT Analysis
- 11.2.2.4. Recent Developments
- 11.2.2.5. Financials (Based on Availability)
- 11.2.3 Evonik
- 11.2.3.1. Overview
- 11.2.3.2. Products
- 11.2.3.3. SWOT Analysis
- 11.2.3.4. Recent Developments
- 11.2.3.5. Financials (Based on Availability)
- 11.2.4 Grace
- 11.2.4.1. Overview
- 11.2.4.2. Products
- 11.2.4.3. SWOT Analysis
- 11.2.4.4. Recent Developments
- 11.2.4.5. Financials (Based on Availability)
- 11.2.5 Codif
- 11.2.5.1. Overview
- 11.2.5.2. Products
- 11.2.5.3. SWOT Analysis
- 11.2.5.4. Recent Developments
- 11.2.5.5. Financials (Based on Availability)
- 11.2.6 BASF
- 11.2.6.1. Overview
- 11.2.6.2. Products
- 11.2.6.3. SWOT Analysis
- 11.2.6.4. Recent Developments
- 11.2.6.5. Financials (Based on Availability)
- 11.2.7 Alban Muller International
- 11.2.7.1. Overview
- 11.2.7.2. Products
- 11.2.7.3. SWOT Analysis
- 11.2.7.4. Recent Developments
- 11.2.7.5. Financials (Based on Availability)
- 11.2.8 Uniproma Chemical
- 11.2.8.1. Overview
- 11.2.8.2. Products
- 11.2.8.3. SWOT Analysis
- 11.2.8.4. Recent Developments
- 11.2.8.5. Financials (Based on Availability)
- 11.2.9 Solvay
- 11.2.9.1. Overview
- 11.2.9.2. Products
- 11.2.9.3. SWOT Analysis
- 11.2.9.4. Recent Developments
- 11.2.9.5. Financials (Based on Availability)
- 11.2.10 Kowa American Corporation (Kowa Group)
- 11.2.10.1. Overview
- 11.2.10.2. Products
- 11.2.10.3. SWOT Analysis
- 11.2.10.4. Recent Developments
- 11.2.10.5. Financials (Based on Availability)
- 11.2.1 PQ Corporation
List of Figures
- Figure 1: Global Hydrated Silicon Dioxide Revenue Breakdown (million, %) by Region 2024 & 2032
- Figure 2: Global Hydrated Silicon Dioxide Volume Breakdown (K, %) by Region 2024 & 2032
- Figure 3: North America Hydrated Silicon Dioxide Revenue (million), by Application 2024 & 2032
- Figure 4: North America Hydrated Silicon Dioxide Volume (K), by Application 2024 & 2032
- Figure 5: North America Hydrated Silicon Dioxide Revenue Share (%), by Application 2024 & 2032
- Figure 6: North America Hydrated Silicon Dioxide Volume Share (%), by Application 2024 & 2032
- Figure 7: North America Hydrated Silicon Dioxide Revenue (million), by Types 2024 & 2032
- Figure 8: North America Hydrated Silicon Dioxide Volume (K), by Types 2024 & 2032
- Figure 9: North America Hydrated Silicon Dioxide Revenue Share (%), by Types 2024 & 2032
- Figure 10: North America Hydrated Silicon Dioxide Volume Share (%), by Types 2024 & 2032
- Figure 11: North America Hydrated Silicon Dioxide Revenue (million), by Country 2024 & 2032
- Figure 12: North America Hydrated Silicon Dioxide Volume (K), by Country 2024 & 2032
- Figure 13: North America Hydrated Silicon Dioxide Revenue Share (%), by Country 2024 & 2032
- Figure 14: North America Hydrated Silicon Dioxide Volume Share (%), by Country 2024 & 2032
- Figure 15: South America Hydrated Silicon Dioxide Revenue (million), by Application 2024 & 2032
- Figure 16: South America Hydrated Silicon Dioxide Volume (K), by Application 2024 & 2032
- Figure 17: South America Hydrated Silicon Dioxide Revenue Share (%), by Application 2024 & 2032
- Figure 18: South America Hydrated Silicon Dioxide Volume Share (%), by Application 2024 & 2032
- Figure 19: South America Hydrated Silicon Dioxide Revenue (million), by Types 2024 & 2032
- Figure 20: South America Hydrated Silicon Dioxide Volume (K), by Types 2024 & 2032
- Figure 21: South America Hydrated Silicon Dioxide Revenue Share (%), by Types 2024 & 2032
- Figure 22: South America Hydrated Silicon Dioxide Volume Share (%), by Types 2024 & 2032
- Figure 23: South America Hydrated Silicon Dioxide Revenue (million), by Country 2024 & 2032
- Figure 24: South America Hydrated Silicon Dioxide Volume (K), by Country 2024 & 2032
- Figure 25: South America Hydrated Silicon Dioxide Revenue Share (%), by Country 2024 & 2032
- Figure 26: South America Hydrated Silicon Dioxide Volume Share (%), by Country 2024 & 2032
- Figure 27: Europe Hydrated Silicon Dioxide Revenue (million), by Application 2024 & 2032
- Figure 28: Europe Hydrated Silicon Dioxide Volume (K), by Application 2024 & 2032
- Figure 29: Europe Hydrated Silicon Dioxide Revenue Share (%), by Application 2024 & 2032
- Figure 30: Europe Hydrated Silicon Dioxide Volume Share (%), by Application 2024 & 2032
- Figure 31: Europe Hydrated Silicon Dioxide Revenue (million), by Types 2024 & 2032
- Figure 32: Europe Hydrated Silicon Dioxide Volume (K), by Types 2024 & 2032
- Figure 33: Europe Hydrated Silicon Dioxide Revenue Share (%), by Types 2024 & 2032
- Figure 34: Europe Hydrated Silicon Dioxide Volume Share (%), by Types 2024 & 2032
- Figure 35: Europe Hydrated Silicon Dioxide Revenue (million), by Country 2024 & 2032
- Figure 36: Europe Hydrated Silicon Dioxide Volume (K), by Country 2024 & 2032
- Figure 37: Europe Hydrated Silicon Dioxide Revenue Share (%), by Country 2024 & 2032
- Figure 38: Europe Hydrated Silicon Dioxide Volume Share (%), by Country 2024 & 2032
- Figure 39: Middle East & Africa Hydrated Silicon Dioxide Revenue (million), by Application 2024 & 2032
- Figure 40: Middle East & Africa Hydrated Silicon Dioxide Volume (K), by Application 2024 & 2032
- Figure 41: Middle East & Africa Hydrated Silicon Dioxide Revenue Share (%), by Application 2024 & 2032
- Figure 42: Middle East & Africa Hydrated Silicon Dioxide Volume Share (%), by Application 2024 & 2032
- Figure 43: Middle East & Africa Hydrated Silicon Dioxide Revenue (million), by Types 2024 & 2032
- Figure 44: Middle East & Africa Hydrated Silicon Dioxide Volume (K), by Types 2024 & 2032
- Figure 45: Middle East & Africa Hydrated Silicon Dioxide Revenue Share (%), by Types 2024 & 2032
- Figure 46: Middle East & Africa Hydrated Silicon Dioxide Volume Share (%), by Types 2024 & 2032
- Figure 47: Middle East & Africa Hydrated Silicon Dioxide Revenue (million), by Country 2024 & 2032
- Figure 48: Middle East & Africa Hydrated Silicon Dioxide Volume (K), by Country 2024 & 2032
- Figure 49: Middle East & Africa Hydrated Silicon Dioxide Revenue Share (%), by Country 2024 & 2032
- Figure 50: Middle East & Africa Hydrated Silicon Dioxide Volume Share (%), by Country 2024 & 2032
- Figure 51: Asia Pacific Hydrated Silicon Dioxide Revenue (million), by Application 2024 & 2032
- Figure 52: Asia Pacific Hydrated Silicon Dioxide Volume (K), by Application 2024 & 2032
- Figure 53: Asia Pacific Hydrated Silicon Dioxide Revenue Share (%), by Application 2024 & 2032
- Figure 54: Asia Pacific Hydrated Silicon Dioxide Volume Share (%), by Application 2024 & 2032
- Figure 55: Asia Pacific Hydrated Silicon Dioxide Revenue (million), by Types 2024 & 2032
- Figure 56: Asia Pacific Hydrated Silicon Dioxide Volume (K), by Types 2024 & 2032
- Figure 57: Asia Pacific Hydrated Silicon Dioxide Revenue Share (%), by Types 2024 & 2032
- Figure 58: Asia Pacific Hydrated Silicon Dioxide Volume Share (%), by Types 2024 & 2032
- Figure 59: Asia Pacific Hydrated Silicon Dioxide Revenue (million), by Country 2024 & 2032
- Figure 60: Asia Pacific Hydrated Silicon Dioxide Volume (K), by Country 2024 & 2032
- Figure 61: Asia Pacific Hydrated Silicon Dioxide Revenue Share (%), by Country 2024 & 2032
- Figure 62: Asia Pacific Hydrated Silicon Dioxide Volume Share (%), by Country 2024 & 2032
List of Tables
- Table 1: Global Hydrated Silicon Dioxide Revenue million Forecast, by Region 2019 & 2032
- Table 2: Global Hydrated Silicon Dioxide Volume K Forecast, by Region 2019 & 2032
- Table 3: Global Hydrated Silicon Dioxide Revenue million Forecast, by Application 2019 & 2032
- Table 4: Global Hydrated Silicon Dioxide Volume K Forecast, by Application 2019 & 2032
- Table 5: Global Hydrated Silicon Dioxide Revenue million Forecast, by Types 2019 & 2032
- Table 6: Global Hydrated Silicon Dioxide Volume K Forecast, by Types 2019 & 2032
- Table 7: Global Hydrated Silicon Dioxide Revenue million Forecast, by Region 2019 & 2032
- Table 8: Global Hydrated Silicon Dioxide Volume K Forecast, by Region 2019 & 2032
- Table 9: Global Hydrated Silicon Dioxide Revenue million Forecast, by Application 2019 & 2032
- Table 10: Global Hydrated Silicon Dioxide Volume K Forecast, by Application 2019 & 2032
- Table 11: Global Hydrated Silicon Dioxide Revenue million Forecast, by Types 2019 & 2032
- Table 12: Global Hydrated Silicon Dioxide Volume K Forecast, by Types 2019 & 2032
- Table 13: Global Hydrated Silicon Dioxide Revenue million Forecast, by Country 2019 & 2032
- Table 14: Global Hydrated Silicon Dioxide Volume K Forecast, by Country 2019 & 2032
- Table 15: United States Hydrated Silicon Dioxide Revenue (million) Forecast, by Application 2019 & 2032
- Table 16: United States Hydrated Silicon Dioxide Volume (K) Forecast, by Application 2019 & 2032
- Table 17: Canada Hydrated Silicon Dioxide Revenue (million) Forecast, by Application 2019 & 2032
- Table 18: Canada Hydrated Silicon Dioxide Volume (K) Forecast, by Application 2019 & 2032
- Table 19: Mexico Hydrated Silicon Dioxide Revenue (million) Forecast, by Application 2019 & 2032
- Table 20: Mexico Hydrated Silicon Dioxide Volume (K) Forecast, by Application 2019 & 2032
- Table 21: Global Hydrated Silicon Dioxide Revenue million Forecast, by Application 2019 & 2032
- Table 22: Global Hydrated Silicon Dioxide Volume K Forecast, by Application 2019 & 2032
- Table 23: Global Hydrated Silicon Dioxide Revenue million Forecast, by Types 2019 & 2032
- Table 24: Global Hydrated Silicon Dioxide Volume K Forecast, by Types 2019 & 2032
- Table 25: Global Hydrated Silicon Dioxide Revenue million Forecast, by Country 2019 & 2032
- Table 26: Global Hydrated Silicon Dioxide Volume K Forecast, by Country 2019 & 2032
- Table 27: Brazil Hydrated Silicon Dioxide Revenue (million) Forecast, by Application 2019 & 2032
- Table 28: Brazil Hydrated Silicon Dioxide Volume (K) Forecast, by Application 2019 & 2032
- Table 29: Argentina Hydrated Silicon Dioxide Revenue (million) Forecast, by Application 2019 & 2032
- Table 30: Argentina Hydrated Silicon Dioxide Volume (K) Forecast, by Application 2019 & 2032
- Table 31: Rest of South America Hydrated Silicon Dioxide Revenue (million) Forecast, by Application 2019 & 2032
- Table 32: Rest of South America Hydrated Silicon Dioxide Volume (K) Forecast, by Application 2019 & 2032
- Table 33: Global Hydrated Silicon Dioxide Revenue million Forecast, by Application 2019 & 2032
- Table 34: Global Hydrated Silicon Dioxide Volume K Forecast, by Application 2019 & 2032
- Table 35: Global Hydrated Silicon Dioxide Revenue million Forecast, by Types 2019 & 2032
- Table 36: Global Hydrated Silicon Dioxide Volume K Forecast, by Types 2019 & 2032
- Table 37: Global Hydrated Silicon Dioxide Revenue million Forecast, by Country 2019 & 2032
- Table 38: Global Hydrated Silicon Dioxide Volume K Forecast, by Country 2019 & 2032
- Table 39: United Kingdom Hydrated Silicon Dioxide Revenue (million) Forecast, by Application 2019 & 2032
- Table 40: United Kingdom Hydrated Silicon Dioxide Volume (K) Forecast, by Application 2019 & 2032
- Table 41: Germany Hydrated Silicon Dioxide Revenue (million) Forecast, by Application 2019 & 2032
- Table 42: Germany Hydrated Silicon Dioxide Volume (K) Forecast, by Application 2019 & 2032
- Table 43: France Hydrated Silicon Dioxide Revenue (million) Forecast, by Application 2019 & 2032
- Table 44: France Hydrated Silicon Dioxide Volume (K) Forecast, by Application 2019 & 2032
- Table 45: Italy Hydrated Silicon Dioxide Revenue (million) Forecast, by Application 2019 & 2032
- Table 46: Italy Hydrated Silicon Dioxide Volume (K) Forecast, by Application 2019 & 2032
- Table 47: Spain Hydrated Silicon Dioxide Revenue (million) Forecast, by Application 2019 & 2032
- Table 48: Spain Hydrated Silicon Dioxide Volume (K) Forecast, by Application 2019 & 2032
- Table 49: Russia Hydrated Silicon Dioxide Revenue (million) Forecast, by Application 2019 & 2032
- Table 50: Russia Hydrated Silicon Dioxide Volume (K) Forecast, by Application 2019 & 2032
- Table 51: Benelux Hydrated Silicon Dioxide Revenue (million) Forecast, by Application 2019 & 2032
- Table 52: Benelux Hydrated Silicon Dioxide Volume (K) Forecast, by Application 2019 & 2032
- Table 53: Nordics Hydrated Silicon Dioxide Revenue (million) Forecast, by Application 2019 & 2032
- Table 54: Nordics Hydrated Silicon Dioxide Volume (K) Forecast, by Application 2019 & 2032
- Table 55: Rest of Europe Hydrated Silicon Dioxide Revenue (million) Forecast, by Application 2019 & 2032
- Table 56: Rest of Europe Hydrated Silicon Dioxide Volume (K) Forecast, by Application 2019 & 2032
- Table 57: Global Hydrated Silicon Dioxide Revenue million Forecast, by Application 2019 & 2032
- Table 58: Global Hydrated Silicon Dioxide Volume K Forecast, by Application 2019 & 2032
- Table 59: Global Hydrated Silicon Dioxide Revenue million Forecast, by Types 2019 & 2032
- Table 60: Global Hydrated Silicon Dioxide Volume K Forecast, by Types 2019 & 2032
- Table 61: Global Hydrated Silicon Dioxide Revenue million Forecast, by Country 2019 & 2032
- Table 62: Global Hydrated Silicon Dioxide Volume K Forecast, by Country 2019 & 2032
- Table 63: Turkey Hydrated Silicon Dioxide Revenue (million) Forecast, by Application 2019 & 2032
- Table 64: Turkey Hydrated Silicon Dioxide Volume (K) Forecast, by Application 2019 & 2032
- Table 65: Israel Hydrated Silicon Dioxide Revenue (million) Forecast, by Application 2019 & 2032
- Table 66: Israel Hydrated Silicon Dioxide Volume (K) Forecast, by Application 2019 & 2032
- Table 67: GCC Hydrated Silicon Dioxide Revenue (million) Forecast, by Application 2019 & 2032
- Table 68: GCC Hydrated Silicon Dioxide Volume (K) Forecast, by Application 2019 & 2032
- Table 69: North Africa Hydrated Silicon Dioxide Revenue (million) Forecast, by Application 2019 & 2032
- Table 70: North Africa Hydrated Silicon Dioxide Volume (K) Forecast, by Application 2019 & 2032
- Table 71: South Africa Hydrated Silicon Dioxide Revenue (million) Forecast, by Application 2019 & 2032
- Table 72: South Africa Hydrated Silicon Dioxide Volume (K) Forecast, by Application 2019 & 2032
- Table 73: Rest of Middle East & Africa Hydrated Silicon Dioxide Revenue (million) Forecast, by Application 2019 & 2032
- Table 74: Rest of Middle East & Africa Hydrated Silicon Dioxide Volume (K) Forecast, by Application 2019 & 2032
- Table 75: Global Hydrated Silicon Dioxide Revenue million Forecast, by Application 2019 & 2032
- Table 76: Global Hydrated Silicon Dioxide Volume K Forecast, by Application 2019 & 2032
- Table 77: Global Hydrated Silicon Dioxide Revenue million Forecast, by Types 2019 & 2032
- Table 78: Global Hydrated Silicon Dioxide Volume K Forecast, by Types 2019 & 2032
- Table 79: Global Hydrated Silicon Dioxide Revenue million Forecast, by Country 2019 & 2032
- Table 80: Global Hydrated Silicon Dioxide Volume K Forecast, by Country 2019 & 2032
- Table 81: China Hydrated Silicon Dioxide Revenue (million) Forecast, by Application 2019 & 2032
- Table 82: China Hydrated Silicon Dioxide Volume (K) Forecast, by Application 2019 & 2032
- Table 83: India Hydrated Silicon Dioxide Revenue (million) Forecast, by Application 2019 & 2032
- Table 84: India Hydrated Silicon Dioxide Volume (K) Forecast, by Application 2019 & 2032
- Table 85: Japan Hydrated Silicon Dioxide Revenue (million) Forecast, by Application 2019 & 2032
- Table 86: Japan Hydrated Silicon Dioxide Volume (K) Forecast, by Application 2019 & 2032
- Table 87: South Korea Hydrated Silicon Dioxide Revenue (million) Forecast, by Application 2019 & 2032
- Table 88: South Korea Hydrated Silicon Dioxide Volume (K) Forecast, by Application 2019 & 2032
- Table 89: ASEAN Hydrated Silicon Dioxide Revenue (million) Forecast, by Application 2019 & 2032
- Table 90: ASEAN Hydrated Silicon Dioxide Volume (K) Forecast, by Application 2019 & 2032
- Table 91: Oceania Hydrated Silicon Dioxide Revenue (million) Forecast, by Application 2019 & 2032
- Table 92: Oceania Hydrated Silicon Dioxide Volume (K) Forecast, by Application 2019 & 2032
- Table 93: Rest of Asia Pacific Hydrated Silicon Dioxide Revenue (million) Forecast, by Application 2019 & 2032
- Table 94: Rest of Asia Pacific Hydrated Silicon Dioxide Volume (K) Forecast, by Application 2019 & 2032
Frequently Asked Questions
1. What is the projected Compound Annual Growth Rate (CAGR) of the Hydrated Silicon Dioxide?
The projected CAGR is approximately 5.7%.
2. Which companies are prominent players in the Hydrated Silicon Dioxide?
Key companies in the market include PQ Corporation, Kobo Products, Evonik, Grace, Codif, BASF, Alban Muller International, Uniproma Chemical, Solvay, Kowa American Corporation (Kowa Group).
3. What are the main segments of the Hydrated Silicon Dioxide?
The market segments include Application, Types.
4. Can you provide details about the market size?
The market size is estimated to be USD 3746 million as of 2022.
5. What are some drivers contributing to market growth?
N/A
6. What are the notable trends driving market growth?
N/A
7. Are there any restraints impacting market growth?
N/A
8. Can you provide examples of recent developments in the market?
N/A
9. What pricing options are available for accessing the report?
Pricing options include single-user, multi-user, and enterprise licenses priced at USD 3950.00, USD 5925.00, and USD 7900.00 respectively.
10. Is the market size provided in terms of value or volume?
The market size is provided in terms of value, measured in million and volume, measured in K.
11. Are there any specific market keywords associated with the report?
Yes, the market keyword associated with the report is "Hydrated Silicon Dioxide," which aids in identifying and referencing the specific market segment covered.
12. How do I determine which pricing option suits my needs best?
The pricing options vary based on user requirements and access needs. Individual users may opt for single-user licenses, while businesses requiring broader access may choose multi-user or enterprise licenses for cost-effective access to the report.
13. Are there any additional resources or data provided in the Hydrated Silicon Dioxide report?
While the report offers comprehensive insights, it's advisable to review the specific contents or supplementary materials provided to ascertain if additional resources or data are available.
14. How can I stay updated on further developments or reports in the Hydrated Silicon Dioxide?
To stay informed about further developments, trends, and reports in the Hydrated Silicon Dioxide, consider subscribing to industry newsletters, following relevant companies and organizations, or regularly checking reputable industry news sources and publications.
Methodology
Step 1 - Identification of Relevant Samples Size from Population Database


Step 2 - Approaches for Defining Global Market Size (Value, Volume* & Price*)

Note*: In applicable scenarios
Step 3 - Data Sources
Primary Research
- Web Analytics
- Survey Reports
- Research Institute
- Latest Research Reports
- Opinion Leaders
Secondary Research
- Annual Reports
- White Paper
- Latest Press Release
- Industry Association
- Paid Database
- Investor Presentations

Step 4 - Data Triangulation
Involves using different sources of information in order to increase the validity of a study
These sources are likely to be stakeholders in a program - participants, other researchers, program staff, other community members, and so on.
Then we put all data in single framework & apply various statistical tools to find out the dynamic on the market.
During the analysis stage, feedback from the stakeholder groups would be compared to determine areas of agreement as well as areas of divergence


