

Key Insights
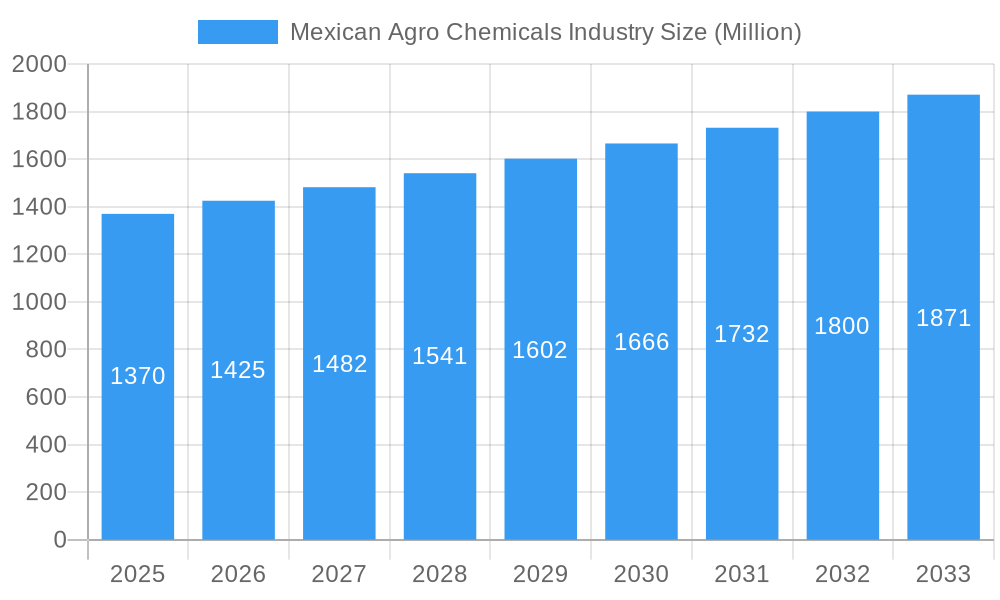
The Mexican agrochemicals market, valued at $1.37 billion in 2025, is projected to experience robust growth, driven by the increasing demand for higher crop yields to meet the nation's food security needs and growing export demands. The market's Compound Annual Growth Rate (CAGR) of 4.10% from 2025-2033 indicates a steady expansion, fueled by factors such as government initiatives promoting agricultural modernization, increasing adoption of advanced farming techniques, and a rising awareness among farmers about the benefits of efficient pest and disease management. Key segments driving growth include fertilizers, pesticides, and plant growth regulators applied to grains and cereals, pulses and oilseeds, and fruits and vegetables. While the market faces constraints like fluctuating raw material prices and stringent environmental regulations, the overall outlook remains positive. Major players like FMC Corporation, Adama, Bayer AG, and Syngenta are actively investing in research and development, introducing innovative and sustainable agrochemical solutions catering to the evolving needs of Mexican farmers. The growing turf and ornamentals segment also contributes to the overall market expansion, reflecting the increasing emphasis on landscaping and green spaces. Competition is expected to intensify as both domestic and international companies strive to capture market share.
Mexican Agro Chemicals Industry Market Size (In Billion)
The regional distribution within Mexico will likely see variations based on agricultural concentration. States with significant agricultural activity, such as Sinaloa, Sonora, and Jalisco, will contribute significantly to the market. While precise regional data is unavailable, it is reasonable to assume that these key agricultural regions will account for a substantial portion of the overall market. The forecast period of 2025-2033 presents opportunities for strategic investments and collaborations within the value chain. This includes investments in sustainable agrochemical solutions, tailored technical support for farmers, and the development of efficient distribution networks. Continued government support for agricultural research and development will be critical in sustaining this growth trajectory. The market's success will hinge on striking a balance between boosting agricultural productivity and mitigating environmental risks.
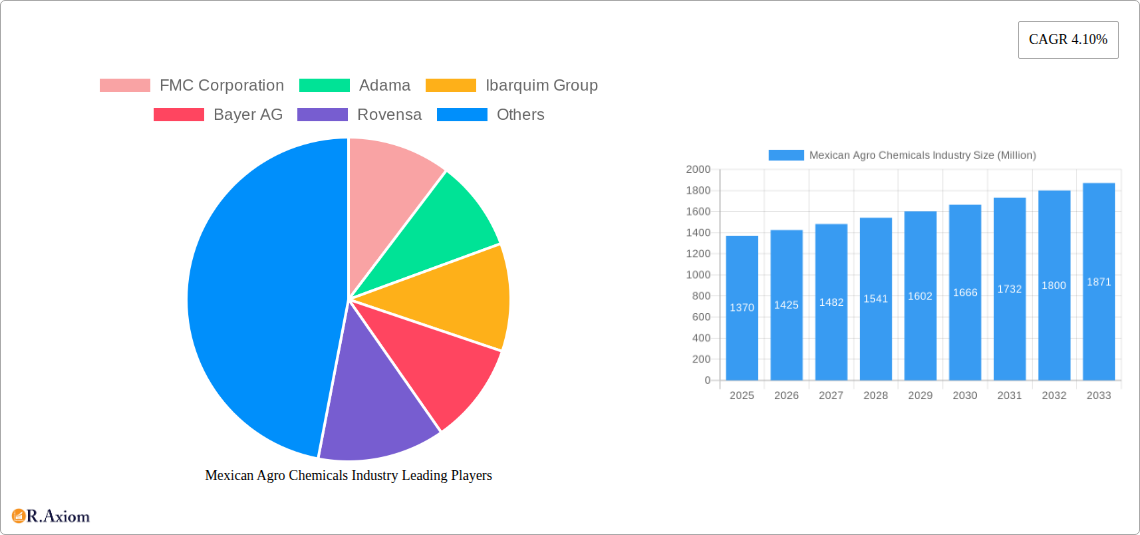
Mexican Agro Chemicals Industry Company Market Share
Mexican Agro Chemicals Industry: A Comprehensive Market Report (2019-2033)
This detailed report provides a comprehensive analysis of the Mexican agrochemicals industry, covering market size, segmentation, key players, growth drivers, challenges, and future outlook. The study period spans from 2019 to 2033, with 2025 serving as the base and estimated year. The report is invaluable for industry stakeholders, investors, and businesses seeking to understand and capitalize on the opportunities within this dynamic market. The market is valued at xx Million in 2025 and is projected to reach xx Million by 2033.
Mexican Agro Chemicals Industry Market Concentration & Innovation
This section analyzes the competitive landscape of the Mexican agrochemicals market, examining market concentration, innovation drivers, regulatory influences, product substitution trends, end-user behavior, and merger & acquisition (M&A) activity.
Market Concentration: The Mexican agrochemicals market exhibits a moderately concentrated structure, with a handful of multinational corporations holding significant market share. While precise figures require proprietary data, estimates suggest that the top 5 players control approximately xx% of the market in 2025. Smaller domestic and regional players also contribute significantly.
Innovation Drivers: Innovation is driven by the need for higher crop yields, enhanced pest and disease management, and sustainable agricultural practices. This leads to the development of novel formulations, targeted delivery systems, and environmentally friendly products. Biopesticides and biofertilizers are experiencing increased adoption due to growing environmental concerns.
Regulatory Framework: The Mexican government's regulatory framework significantly impacts the industry. Recent legislative efforts, such as the proposed ban on nearly 200 pesticide chemicals (November 2022), introduce both challenges and opportunities for market players. This necessitates adaptation to new regulations and the development of compliant products.
Product Substitutes: Biopesticides and biofertilizers are emerging as important substitutes for traditional chemical products. Their market penetration is growing gradually due to environmental considerations and consumer demand for organic products.
End-User Trends: Mexican farmers are increasingly adopting precision agriculture techniques, necessitating agrochemical products tailored for specific applications and optimized for efficiency. Demand for customized solutions and advisory services is rising.
M&A Activities: The Mexican agrochemicals sector has witnessed several M&A deals in recent years, primarily driven by the pursuit of market expansion, technology acquisition, and portfolio diversification. The total value of these deals during the historical period (2019-2024) is estimated at xx Million. Future M&A activity is expected to remain strong.
Mexican Agro Chemicals Industry Industry Trends & Insights
The Mexican agrochemicals market is experiencing robust growth, driven by factors like increasing agricultural production, rising demand for food, and government initiatives supporting agricultural modernization. The market's Compound Annual Growth Rate (CAGR) is projected to be xx% during the forecast period (2025-2033). Market penetration of advanced technologies, such as precision agriculture and drone-based application, remains relatively low but is expected to grow considerably, with a projected xx% increase by 2033.
Technological disruptions, including the adoption of digital agriculture and data analytics, are transforming industry practices. Consumer preferences towards organic and sustainably produced food are influencing the demand for bio-based agrochemicals. Intense competition among established multinational players and smaller, specialized firms characterizes the market dynamics. The ongoing debate over pesticide regulations and potential bans creates both uncertainty and impetus for innovation in sustainable agricultural solutions.
Dominant Markets & Segments in Mexican Agro Chemicals Industry
This section identifies the leading segments within the Mexican agrochemicals market based on application and product type.
Application:
- Grains and Cereals: This segment holds the largest market share due to the significant acreage under grains and cereals cultivation in Mexico. Key drivers include government support for staple crop production and consistent demand.
- Fruits and Vegetables: The high-value fruit and vegetable sector shows strong growth driven by export demand and rising domestic consumption. This segment is characterized by a preference for higher-quality, safer products.
- Pulses and Oilseeds: This segment exhibits moderate growth, influenced by fluctuating prices and global market dynamics.
Type:
- Fertilizers: The fertilizers segment is experiencing growth linked to the expansion of the National Programme of Fertilizers (March 2022). However, challenges related to domestic production capacity and the need for increased efficiency remain.
- Pesticides: This segment is the largest by value, driven by the need to control pests and diseases affecting various crops. The proposed pesticide ban (November 2022) is a key factor impacting this segment.
Geographic dominance is primarily concentrated in major agricultural regions across Mexico, including regions known for corn, fruit, and vegetable cultivation. Key drivers influencing segment dominance include government policies supporting specific crops, irrigation infrastructure, and the availability of credit to farmers.
Mexican Agro Chemicals Industry Product Developments
Recent product innovations focus on biopesticides, biofertilizers, and formulations offering enhanced efficacy and reduced environmental impact. These developments aim to satisfy the increasing demand for sustainable agricultural practices and to comply with tightening regulations. Companies are also focusing on developing products tailored to specific crops and pest profiles, leading to improved target specificity and reduced off-target effects. The market fit for these innovations is strong, driven by both regulatory pressure and consumer preference for more environmentally friendly agricultural practices.
Report Scope & Segmentation Analysis
This report segments the Mexican agrochemicals market based on application (Grains and Cereals, Pulses and Oilseeds, Fruits and Vegetables, Turf and Ornamentals, Other Applications) and type (Fertilizers, Pesticides, Adjuvants, Plant Growth Regulators). Each segment's growth projections, market sizes, and competitive dynamics are analyzed. For instance, the Pesticides segment, while dominant, faces challenges due to regulatory scrutiny. The Fertilizers segment, fueled by government initiatives, presents significant growth potential, while the Biopesticides sector is experiencing a surge in interest, demonstrating the shifting landscape towards sustainability. Detailed projections for each segment are provided in the full report.
Key Drivers of Mexican Agro Chemicals Industry Growth
Several factors drive growth in the Mexican agrochemicals industry. These include:
- Growing agricultural production: Increased demand for food is driving expansion in agricultural acreage and intensity.
- Government support: Initiatives to modernize agriculture and boost productivity create opportunities for agrochemical companies.
- Technological advancements: Precision agriculture techniques and the use of data analytics improve efficiency and yield.
- Rising consumer demand: The increasing population fuels demand for food, increasing the market for agrochemicals.
Challenges in the Mexican Agro Chemicals Industry Sector
Several challenges affect the Mexican agrochemicals industry:
- Stringent regulations: The tightening regulatory environment and potential bans on certain chemicals introduce uncertainty and increase compliance costs. This represents a substantial impact, estimated to cost the industry xx Million annually.
- Supply chain disruptions: Global supply chain disruptions can impact the availability of raw materials and finished products.
- Price volatility: Fluctuations in raw material prices and currency exchange rates affect profitability.
- Competition: Intense competition from both domestic and international players requires continuous innovation and cost optimization.
Emerging Opportunities in Mexican Agro Chemicals Industry
The Mexican agrochemicals industry presents several emerging opportunities:
- Biopesticides and biofertilizers: Growing demand for sustainable solutions creates a significant opportunity for bio-based products.
- Precision agriculture: Adoption of advanced technologies like drones and sensor-based systems offers efficiency gains.
- Data analytics and digital agriculture: Using data to improve decision-making and optimize resource allocation.
- Export markets: Increasing exports of agricultural products create demand for higher-quality agrochemicals.
Leading Players in the Mexican Agro Chemicals Industry Market
- FMC Corporation
- Adama
- Ibarquim Group
- Bayer AG
- Rovensa
- Summit Agro México
- UPL Ltd
- International Chemical Copper SA de CV
- Velsimex
- Yara International ASA
- Syngenta
- BASF SE
Key Developments in Mexican Agro Chemicals Industry Industry
- November 2022: A proposed ban on nearly 200 pesticide chemicals raises concerns about food production and agrochemical prices. This development significantly impacts the market, creating uncertainty and driving demand for alternative solutions.
- August 2022: Futureco Bioscience partners with Innovak Global to distribute BESTCURE, a biopesticide, in Mexico. This highlights the growing interest in sustainable agricultural solutions.
- March 2022: The expansion of the National Programme of Fertilizers aims to boost domestic fertilizer production, impacting import reliance and market dynamics.
Strategic Outlook for Mexican Agro Chemicals Industry Market
The Mexican agrochemicals market is poised for continued growth, driven by increasing agricultural production, technological advancements, and government support. Opportunities lie in sustainable solutions, precision agriculture, and data-driven decision-making. Navigating regulatory challenges and adapting to consumer preferences will be crucial for success. The market is expected to witness a significant shift towards bio-based products and sustainable agricultural practices in the coming years.
Mexican Agro Chemicals Industry Segmentation
- 1. Production Analysis
- 2. Consumption Analysis
- 3. Import Market Analysis (Value & Volume)
- 4. Export Market Analysis (Value & Volume)
- 5. Price Trend Analysis
Mexican Agro Chemicals Industry Segmentation By Geography
-
1. North America
- 1.1. United States
- 1.2. Canada
- 1.3. Mexico
-
2. South America
- 2.1. Brazil
- 2.2. Argentina
- 2.3. Rest of South America
-
3. Europe
- 3.1. United Kingdom
- 3.2. Germany
- 3.3. France
- 3.4. Italy
- 3.5. Spain
- 3.6. Russia
- 3.7. Benelux
- 3.8. Nordics
- 3.9. Rest of Europe
-
4. Middle East & Africa
- 4.1. Turkey
- 4.2. Israel
- 4.3. GCC
- 4.4. North Africa
- 4.5. South Africa
- 4.6. Rest of Middle East & Africa
-
5. Asia Pacific
- 5.1. China
- 5.2. India
- 5.3. Japan
- 5.4. South Korea
- 5.5. ASEAN
- 5.6. Oceania
- 5.7. Rest of Asia Pacific
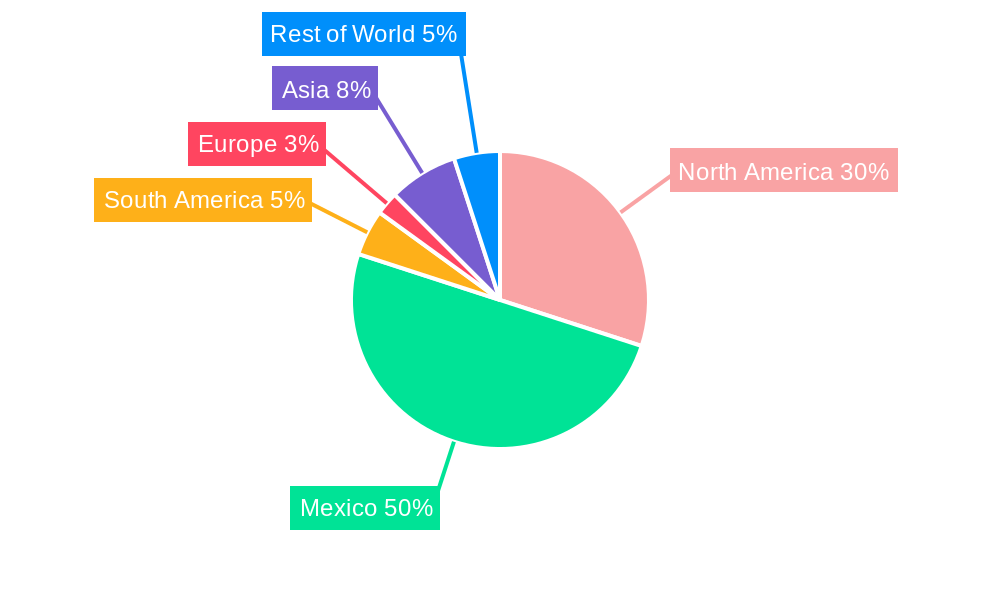
Mexican Agro Chemicals Industry Regional Market Share
Geographic Coverage of Mexican Agro Chemicals Industry
Mexican Agro Chemicals Industry REPORT HIGHLIGHTS
| Aspects | Details |
|---|---|
| Study Period | 2020-2034 |
| Base Year | 2025 |
| Estimated Year | 2026 |
| Forecast Period | 2026-2034 |
| Historical Period | 2020-2025 |
| Growth Rate | CAGR of 4.10% from 2020-2034 |
| Segmentation |
|
Table of Contents
- 1. Introduction
- 1.1. Research Scope
- 1.2. Market Segmentation
- 1.3. Research Objective
- 1.4. Definitions and Assumptions
- 2. Executive Summary
- 2.1. Market Snapshot
- 3. Market Dynamics
- 3.1. Market Drivers
- 3.2. Market Restrains
- 3.3. Market Trends
- 3.4. Market Opportunities
- 4. Market Factor Analysis
- 4.1. Porters Five Forces
- 4.1.1. Bargaining Power of Suppliers
- 4.1.2. Bargaining Power of Buyers
- 4.1.3. Threat of New Entrants
- 4.1.4. Threat of Substitutes
- 4.1.5. Competitive Rivalry
- 4.2. PESTEL analysis
- 4.3. BCG Analysis
- 4.3.1. Stars (High Growth, High Market Share)
- 4.3.2. Cash Cows (Low Growth, High Market Share)
- 4.3.3. Question Mark (High Growth, Low Market Share)
- 4.3.4. Dogs (Low Growth, Low Market Share)
- 4.4. Ansoff Matrix Analysis
- 4.5. Supply Chain Analysis
- 4.6. Regulatory Landscape
- 4.7. Current Market Potential and Opportunity Assessment (TAM–SAM–SOM Framework)
- 4.8. RAX Analyst Note
- 4.1. Porters Five Forces
- 5. Market Analysis, Insights and Forecast 2021-2033
- 5.1. Market Analysis, Insights and Forecast - by Production Analysis
- 5.2. Market Analysis, Insights and Forecast - by Consumption Analysis
- 5.3. Market Analysis, Insights and Forecast - by Import Market Analysis (Value & Volume)
- 5.4. Market Analysis, Insights and Forecast - by Export Market Analysis (Value & Volume)
- 5.5. Market Analysis, Insights and Forecast - by Price Trend Analysis
- 5.6. Market Analysis, Insights and Forecast - by Region
- 5.6.1. North America
- 5.6.2. South America
- 5.6.3. Europe
- 5.6.4. Middle East & Africa
- 5.6.5. Asia Pacific
- 6. Global Mexican Agro Chemicals Industry Analysis, Insights and Forecast, 2021-2033
- 6.1. Market Analysis, Insights and Forecast - by Production Analysis
- 6.2. Market Analysis, Insights and Forecast - by Consumption Analysis
- 6.3. Market Analysis, Insights and Forecast - by Import Market Analysis (Value & Volume)
- 6.4. Market Analysis, Insights and Forecast - by Export Market Analysis (Value & Volume)
- 6.5. Market Analysis, Insights and Forecast - by Price Trend Analysis
- 7. North America Mexican Agro Chemicals Industry Analysis, Insights and Forecast, 2020-2032
- 7.1. Market Analysis, Insights and Forecast - by Production Analysis
- 7.2. Market Analysis, Insights and Forecast - by Consumption Analysis
- 7.3. Market Analysis, Insights and Forecast - by Import Market Analysis (Value & Volume)
- 7.4. Market Analysis, Insights and Forecast - by Export Market Analysis (Value & Volume)
- 7.5. Market Analysis, Insights and Forecast - by Price Trend Analysis
- 8. South America Mexican Agro Chemicals Industry Analysis, Insights and Forecast, 2020-2032
- 8.1. Market Analysis, Insights and Forecast - by Production Analysis
- 8.2. Market Analysis, Insights and Forecast - by Consumption Analysis
- 8.3. Market Analysis, Insights and Forecast - by Import Market Analysis (Value & Volume)
- 8.4. Market Analysis, Insights and Forecast - by Export Market Analysis (Value & Volume)
- 8.5. Market Analysis, Insights and Forecast - by Price Trend Analysis
- 9. Europe Mexican Agro Chemicals Industry Analysis, Insights and Forecast, 2020-2032
- 9.1. Market Analysis, Insights and Forecast - by Production Analysis
- 9.2. Market Analysis, Insights and Forecast - by Consumption Analysis
- 9.3. Market Analysis, Insights and Forecast - by Import Market Analysis (Value & Volume)
- 9.4. Market Analysis, Insights and Forecast - by Export Market Analysis (Value & Volume)
- 9.5. Market Analysis, Insights and Forecast - by Price Trend Analysis
- 10. Middle East & Africa Mexican Agro Chemicals Industry Analysis, Insights and Forecast, 2020-2032
- 10.1. Market Analysis, Insights and Forecast - by Production Analysis
- 10.2. Market Analysis, Insights and Forecast - by Consumption Analysis
- 10.3. Market Analysis, Insights and Forecast - by Import Market Analysis (Value & Volume)
- 10.4. Market Analysis, Insights and Forecast - by Export Market Analysis (Value & Volume)
- 10.5. Market Analysis, Insights and Forecast - by Price Trend Analysis
- 11. Asia Pacific Mexican Agro Chemicals Industry Analysis, Insights and Forecast, 2020-2032
- 11.1. Market Analysis, Insights and Forecast - by Production Analysis
- 11.2. Market Analysis, Insights and Forecast - by Consumption Analysis
- 11.3. Market Analysis, Insights and Forecast - by Import Market Analysis (Value & Volume)
- 11.4. Market Analysis, Insights and Forecast - by Export Market Analysis (Value & Volume)
- 11.5. Market Analysis, Insights and Forecast - by Price Trend Analysis
- 12. Competitive Analysis
- 12.1. Company Profiles
- 12.1.1 FMC Corporation
- 12.1.1.1. Company Overview
- 12.1.1.2. Products
- 12.1.1.3. Company Financials
- 12.1.1.4. SWOT Analysis
- 12.1.2 Adama
- 12.1.2.1. Company Overview
- 12.1.2.2. Products
- 12.1.2.3. Company Financials
- 12.1.2.4. SWOT Analysis
- 12.1.3 Ibarquim Group
- 12.1.3.1. Company Overview
- 12.1.3.2. Products
- 12.1.3.3. Company Financials
- 12.1.3.4. SWOT Analysis
- 12.1.4 Bayer AG
- 12.1.4.1. Company Overview
- 12.1.4.2. Products
- 12.1.4.3. Company Financials
- 12.1.4.4. SWOT Analysis
- 12.1.5 Rovensa
- 12.1.5.1. Company Overview
- 12.1.5.2. Products
- 12.1.5.3. Company Financials
- 12.1.5.4. SWOT Analysis
- 12.1.6 Summit Agro México
- 12.1.6.1. Company Overview
- 12.1.6.2. Products
- 12.1.6.3. Company Financials
- 12.1.6.4. SWOT Analysis
- 12.1.7 UPL Ltd
- 12.1.7.1. Company Overview
- 12.1.7.2. Products
- 12.1.7.3. Company Financials
- 12.1.7.4. SWOT Analysis
- 12.1.8 International Chemical Copper SA de CV
- 12.1.8.1. Company Overview
- 12.1.8.2. Products
- 12.1.8.3. Company Financials
- 12.1.8.4. SWOT Analysis
- 12.1.9 Velsimex
- 12.1.9.1. Company Overview
- 12.1.9.2. Products
- 12.1.9.3. Company Financials
- 12.1.9.4. SWOT Analysis
- 12.1.10 Yara International ASA
- 12.1.10.1. Company Overview
- 12.1.10.2. Products
- 12.1.10.3. Company Financials
- 12.1.10.4. SWOT Analysis
- 12.1.11 Syngenta
- 12.1.11.1. Company Overview
- 12.1.11.2. Products
- 12.1.11.3. Company Financials
- 12.1.11.4. SWOT Analysis
- 12.1.12 BASF SE
- 12.1.12.1. Company Overview
- 12.1.12.2. Products
- 12.1.12.3. Company Financials
- 12.1.12.4. SWOT Analysis
- 12.1.1 FMC Corporation
- 12.2. Market Entropy
- 12.2.1 Company's Key Areas Served
- 12.2.2 Recent Developments
- 12.3. Company Market Share Analysis 2025
- 12.3.1 Top 5 Companies Market Share Analysis
- 12.3.2 Top 3 Companies Market Share Analysis
- 12.4. List of Potential Customers
- 13. Research Methodology
List of Figures
- Figure 1: Global Mexican Agro Chemicals Industry Revenue Breakdown (Million, %) by Region 2025 & 2033
- Figure 2: North America Mexican Agro Chemicals Industry Revenue (Million), by Production Analysis 2025 & 2033
- Figure 3: North America Mexican Agro Chemicals Industry Revenue Share (%), by Production Analysis 2025 & 2033
- Figure 4: North America Mexican Agro Chemicals Industry Revenue (Million), by Consumption Analysis 2025 & 2033
- Figure 5: North America Mexican Agro Chemicals Industry Revenue Share (%), by Consumption Analysis 2025 & 2033
- Figure 6: North America Mexican Agro Chemicals Industry Revenue (Million), by Import Market Analysis (Value & Volume) 2025 & 2033
- Figure 7: North America Mexican Agro Chemicals Industry Revenue Share (%), by Import Market Analysis (Value & Volume) 2025 & 2033
- Figure 8: North America Mexican Agro Chemicals Industry Revenue (Million), by Export Market Analysis (Value & Volume) 2025 & 2033
- Figure 9: North America Mexican Agro Chemicals Industry Revenue Share (%), by Export Market Analysis (Value & Volume) 2025 & 2033
- Figure 10: North America Mexican Agro Chemicals Industry Revenue (Million), by Price Trend Analysis 2025 & 2033
- Figure 11: North America Mexican Agro Chemicals Industry Revenue Share (%), by Price Trend Analysis 2025 & 2033
- Figure 12: North America Mexican Agro Chemicals Industry Revenue (Million), by Country 2025 & 2033
- Figure 13: North America Mexican Agro Chemicals Industry Revenue Share (%), by Country 2025 & 2033
- Figure 14: South America Mexican Agro Chemicals Industry Revenue (Million), by Production Analysis 2025 & 2033
- Figure 15: South America Mexican Agro Chemicals Industry Revenue Share (%), by Production Analysis 2025 & 2033
- Figure 16: South America Mexican Agro Chemicals Industry Revenue (Million), by Consumption Analysis 2025 & 2033
- Figure 17: South America Mexican Agro Chemicals Industry Revenue Share (%), by Consumption Analysis 2025 & 2033
- Figure 18: South America Mexican Agro Chemicals Industry Revenue (Million), by Import Market Analysis (Value & Volume) 2025 & 2033
- Figure 19: South America Mexican Agro Chemicals Industry Revenue Share (%), by Import Market Analysis (Value & Volume) 2025 & 2033
- Figure 20: South America Mexican Agro Chemicals Industry Revenue (Million), by Export Market Analysis (Value & Volume) 2025 & 2033
- Figure 21: South America Mexican Agro Chemicals Industry Revenue Share (%), by Export Market Analysis (Value & Volume) 2025 & 2033
- Figure 22: South America Mexican Agro Chemicals Industry Revenue (Million), by Price Trend Analysis 2025 & 2033
- Figure 23: South America Mexican Agro Chemicals Industry Revenue Share (%), by Price Trend Analysis 2025 & 2033
- Figure 24: South America Mexican Agro Chemicals Industry Revenue (Million), by Country 2025 & 2033
- Figure 25: South America Mexican Agro Chemicals Industry Revenue Share (%), by Country 2025 & 2033
- Figure 26: Europe Mexican Agro Chemicals Industry Revenue (Million), by Production Analysis 2025 & 2033
- Figure 27: Europe Mexican Agro Chemicals Industry Revenue Share (%), by Production Analysis 2025 & 2033
- Figure 28: Europe Mexican Agro Chemicals Industry Revenue (Million), by Consumption Analysis 2025 & 2033
- Figure 29: Europe Mexican Agro Chemicals Industry Revenue Share (%), by Consumption Analysis 2025 & 2033
- Figure 30: Europe Mexican Agro Chemicals Industry Revenue (Million), by Import Market Analysis (Value & Volume) 2025 & 2033
- Figure 31: Europe Mexican Agro Chemicals Industry Revenue Share (%), by Import Market Analysis (Value & Volume) 2025 & 2033
- Figure 32: Europe Mexican Agro Chemicals Industry Revenue (Million), by Export Market Analysis (Value & Volume) 2025 & 2033
- Figure 33: Europe Mexican Agro Chemicals Industry Revenue Share (%), by Export Market Analysis (Value & Volume) 2025 & 2033
- Figure 34: Europe Mexican Agro Chemicals Industry Revenue (Million), by Price Trend Analysis 2025 & 2033
- Figure 35: Europe Mexican Agro Chemicals Industry Revenue Share (%), by Price Trend Analysis 2025 & 2033
- Figure 36: Europe Mexican Agro Chemicals Industry Revenue (Million), by Country 2025 & 2033
- Figure 37: Europe Mexican Agro Chemicals Industry Revenue Share (%), by Country 2025 & 2033
- Figure 38: Middle East & Africa Mexican Agro Chemicals Industry Revenue (Million), by Production Analysis 2025 & 2033
- Figure 39: Middle East & Africa Mexican Agro Chemicals Industry Revenue Share (%), by Production Analysis 2025 & 2033
- Figure 40: Middle East & Africa Mexican Agro Chemicals Industry Revenue (Million), by Consumption Analysis 2025 & 2033
- Figure 41: Middle East & Africa Mexican Agro Chemicals Industry Revenue Share (%), by Consumption Analysis 2025 & 2033
- Figure 42: Middle East & Africa Mexican Agro Chemicals Industry Revenue (Million), by Import Market Analysis (Value & Volume) 2025 & 2033
- Figure 43: Middle East & Africa Mexican Agro Chemicals Industry Revenue Share (%), by Import Market Analysis (Value & Volume) 2025 & 2033
- Figure 44: Middle East & Africa Mexican Agro Chemicals Industry Revenue (Million), by Export Market Analysis (Value & Volume) 2025 & 2033
- Figure 45: Middle East & Africa Mexican Agro Chemicals Industry Revenue Share (%), by Export Market Analysis (Value & Volume) 2025 & 2033
- Figure 46: Middle East & Africa Mexican Agro Chemicals Industry Revenue (Million), by Price Trend Analysis 2025 & 2033
- Figure 47: Middle East & Africa Mexican Agro Chemicals Industry Revenue Share (%), by Price Trend Analysis 2025 & 2033
- Figure 48: Middle East & Africa Mexican Agro Chemicals Industry Revenue (Million), by Country 2025 & 2033
- Figure 49: Middle East & Africa Mexican Agro Chemicals Industry Revenue Share (%), by Country 2025 & 2033
- Figure 50: Asia Pacific Mexican Agro Chemicals Industry Revenue (Million), by Production Analysis 2025 & 2033
- Figure 51: Asia Pacific Mexican Agro Chemicals Industry Revenue Share (%), by Production Analysis 2025 & 2033
- Figure 52: Asia Pacific Mexican Agro Chemicals Industry Revenue (Million), by Consumption Analysis 2025 & 2033
- Figure 53: Asia Pacific Mexican Agro Chemicals Industry Revenue Share (%), by Consumption Analysis 2025 & 2033
- Figure 54: Asia Pacific Mexican Agro Chemicals Industry Revenue (Million), by Import Market Analysis (Value & Volume) 2025 & 2033
- Figure 55: Asia Pacific Mexican Agro Chemicals Industry Revenue Share (%), by Import Market Analysis (Value & Volume) 2025 & 2033
- Figure 56: Asia Pacific Mexican Agro Chemicals Industry Revenue (Million), by Export Market Analysis (Value & Volume) 2025 & 2033
- Figure 57: Asia Pacific Mexican Agro Chemicals Industry Revenue Share (%), by Export Market Analysis (Value & Volume) 2025 & 2033
- Figure 58: Asia Pacific Mexican Agro Chemicals Industry Revenue (Million), by Price Trend Analysis 2025 & 2033
- Figure 59: Asia Pacific Mexican Agro Chemicals Industry Revenue Share (%), by Price Trend Analysis 2025 & 2033
- Figure 60: Asia Pacific Mexican Agro Chemicals Industry Revenue (Million), by Country 2025 & 2033
- Figure 61: Asia Pacific Mexican Agro Chemicals Industry Revenue Share (%), by Country 2025 & 2033
List of Tables
- Table 1: Global Mexican Agro Chemicals Industry Revenue Million Forecast, by Production Analysis 2020 & 2033
- Table 2: Global Mexican Agro Chemicals Industry Revenue Million Forecast, by Consumption Analysis 2020 & 2033
- Table 3: Global Mexican Agro Chemicals Industry Revenue Million Forecast, by Import Market Analysis (Value & Volume) 2020 & 2033
- Table 4: Global Mexican Agro Chemicals Industry Revenue Million Forecast, by Export Market Analysis (Value & Volume) 2020 & 2033
- Table 5: Global Mexican Agro Chemicals Industry Revenue Million Forecast, by Price Trend Analysis 2020 & 2033
- Table 6: Global Mexican Agro Chemicals Industry Revenue Million Forecast, by Region 2020 & 2033
- Table 7: Global Mexican Agro Chemicals Industry Revenue Million Forecast, by Production Analysis 2020 & 2033
- Table 8: Global Mexican Agro Chemicals Industry Revenue Million Forecast, by Consumption Analysis 2020 & 2033
- Table 9: Global Mexican Agro Chemicals Industry Revenue Million Forecast, by Import Market Analysis (Value & Volume) 2020 & 2033
- Table 10: Global Mexican Agro Chemicals Industry Revenue Million Forecast, by Export Market Analysis (Value & Volume) 2020 & 2033
- Table 11: Global Mexican Agro Chemicals Industry Revenue Million Forecast, by Price Trend Analysis 2020 & 2033
- Table 12: Global Mexican Agro Chemicals Industry Revenue Million Forecast, by Country 2020 & 2033
- Table 13: United States Mexican Agro Chemicals Industry Revenue (Million) Forecast, by Application 2020 & 2033
- Table 14: Canada Mexican Agro Chemicals Industry Revenue (Million) Forecast, by Application 2020 & 2033
- Table 15: Mexico Mexican Agro Chemicals Industry Revenue (Million) Forecast, by Application 2020 & 2033
- Table 16: Global Mexican Agro Chemicals Industry Revenue Million Forecast, by Production Analysis 2020 & 2033
- Table 17: Global Mexican Agro Chemicals Industry Revenue Million Forecast, by Consumption Analysis 2020 & 2033
- Table 18: Global Mexican Agro Chemicals Industry Revenue Million Forecast, by Import Market Analysis (Value & Volume) 2020 & 2033
- Table 19: Global Mexican Agro Chemicals Industry Revenue Million Forecast, by Export Market Analysis (Value & Volume) 2020 & 2033
- Table 20: Global Mexican Agro Chemicals Industry Revenue Million Forecast, by Price Trend Analysis 2020 & 2033
- Table 21: Global Mexican Agro Chemicals Industry Revenue Million Forecast, by Country 2020 & 2033
- Table 22: Brazil Mexican Agro Chemicals Industry Revenue (Million) Forecast, by Application 2020 & 2033
- Table 23: Argentina Mexican Agro Chemicals Industry Revenue (Million) Forecast, by Application 2020 & 2033
- Table 24: Rest of South America Mexican Agro Chemicals Industry Revenue (Million) Forecast, by Application 2020 & 2033
- Table 25: Global Mexican Agro Chemicals Industry Revenue Million Forecast, by Production Analysis 2020 & 2033
- Table 26: Global Mexican Agro Chemicals Industry Revenue Million Forecast, by Consumption Analysis 2020 & 2033
- Table 27: Global Mexican Agro Chemicals Industry Revenue Million Forecast, by Import Market Analysis (Value & Volume) 2020 & 2033
- Table 28: Global Mexican Agro Chemicals Industry Revenue Million Forecast, by Export Market Analysis (Value & Volume) 2020 & 2033
- Table 29: Global Mexican Agro Chemicals Industry Revenue Million Forecast, by Price Trend Analysis 2020 & 2033
- Table 30: Global Mexican Agro Chemicals Industry Revenue Million Forecast, by Country 2020 & 2033
- Table 31: United Kingdom Mexican Agro Chemicals Industry Revenue (Million) Forecast, by Application 2020 & 2033
- Table 32: Germany Mexican Agro Chemicals Industry Revenue (Million) Forecast, by Application 2020 & 2033
- Table 33: France Mexican Agro Chemicals Industry Revenue (Million) Forecast, by Application 2020 & 2033
- Table 34: Italy Mexican Agro Chemicals Industry Revenue (Million) Forecast, by Application 2020 & 2033
- Table 35: Spain Mexican Agro Chemicals Industry Revenue (Million) Forecast, by Application 2020 & 2033
- Table 36: Russia Mexican Agro Chemicals Industry Revenue (Million) Forecast, by Application 2020 & 2033
- Table 37: Benelux Mexican Agro Chemicals Industry Revenue (Million) Forecast, by Application 2020 & 2033
- Table 38: Nordics Mexican Agro Chemicals Industry Revenue (Million) Forecast, by Application 2020 & 2033
- Table 39: Rest of Europe Mexican Agro Chemicals Industry Revenue (Million) Forecast, by Application 2020 & 2033
- Table 40: Global Mexican Agro Chemicals Industry Revenue Million Forecast, by Production Analysis 2020 & 2033
- Table 41: Global Mexican Agro Chemicals Industry Revenue Million Forecast, by Consumption Analysis 2020 & 2033
- Table 42: Global Mexican Agro Chemicals Industry Revenue Million Forecast, by Import Market Analysis (Value & Volume) 2020 & 2033
- Table 43: Global Mexican Agro Chemicals Industry Revenue Million Forecast, by Export Market Analysis (Value & Volume) 2020 & 2033
- Table 44: Global Mexican Agro Chemicals Industry Revenue Million Forecast, by Price Trend Analysis 2020 & 2033
- Table 45: Global Mexican Agro Chemicals Industry Revenue Million Forecast, by Country 2020 & 2033
- Table 46: Turkey Mexican Agro Chemicals Industry Revenue (Million) Forecast, by Application 2020 & 2033
- Table 47: Israel Mexican Agro Chemicals Industry Revenue (Million) Forecast, by Application 2020 & 2033
- Table 48: GCC Mexican Agro Chemicals Industry Revenue (Million) Forecast, by Application 2020 & 2033
- Table 49: North Africa Mexican Agro Chemicals Industry Revenue (Million) Forecast, by Application 2020 & 2033
- Table 50: South Africa Mexican Agro Chemicals Industry Revenue (Million) Forecast, by Application 2020 & 2033
- Table 51: Rest of Middle East & Africa Mexican Agro Chemicals Industry Revenue (Million) Forecast, by Application 2020 & 2033
- Table 52: Global Mexican Agro Chemicals Industry Revenue Million Forecast, by Production Analysis 2020 & 2033
- Table 53: Global Mexican Agro Chemicals Industry Revenue Million Forecast, by Consumption Analysis 2020 & 2033
- Table 54: Global Mexican Agro Chemicals Industry Revenue Million Forecast, by Import Market Analysis (Value & Volume) 2020 & 2033
- Table 55: Global Mexican Agro Chemicals Industry Revenue Million Forecast, by Export Market Analysis (Value & Volume) 2020 & 2033
- Table 56: Global Mexican Agro Chemicals Industry Revenue Million Forecast, by Price Trend Analysis 2020 & 2033
- Table 57: Global Mexican Agro Chemicals Industry Revenue Million Forecast, by Country 2020 & 2033
- Table 58: China Mexican Agro Chemicals Industry Revenue (Million) Forecast, by Application 2020 & 2033
- Table 59: India Mexican Agro Chemicals Industry Revenue (Million) Forecast, by Application 2020 & 2033
- Table 60: Japan Mexican Agro Chemicals Industry Revenue (Million) Forecast, by Application 2020 & 2033
- Table 61: South Korea Mexican Agro Chemicals Industry Revenue (Million) Forecast, by Application 2020 & 2033
- Table 62: ASEAN Mexican Agro Chemicals Industry Revenue (Million) Forecast, by Application 2020 & 2033
- Table 63: Oceania Mexican Agro Chemicals Industry Revenue (Million) Forecast, by Application 2020 & 2033
- Table 64: Rest of Asia Pacific Mexican Agro Chemicals Industry Revenue (Million) Forecast, by Application 2020 & 2033
Frequently Asked Questions
1. What is the projected Compound Annual Growth Rate (CAGR) of the Mexican Agro Chemicals Industry?
The projected CAGR is approximately 4.10%.
2. Which companies are prominent players in the Mexican Agro Chemicals Industry?
Key companies in the market include FMC Corporation, Adama, Ibarquim Group, Bayer AG, Rovensa, Summit Agro México, UPL Ltd, International Chemical Copper SA de CV, Velsimex, Yara International ASA, Syngenta, BASF SE.
3. What are the main segments of the Mexican Agro Chemicals Industry?
The market segments include Production Analysis, Consumption Analysis, Import Market Analysis (Value & Volume), Export Market Analysis (Value & Volume), Price Trend Analysis.
4. Can you provide details about the market size?
The market size is estimated to be USD 1.37 Million as of 2022.
5. What are some drivers contributing to market growth?
Adoption of Organic and Eco-friendly Farming Practices; Declining Area of Arable Land and Rising Food Security Concerns.
6. What are the notable trends driving market growth?
Need for Increased Land Productivity.
7. Are there any restraints impacting market growth?
High Demand for Conventional and Synthetic Products; Lack of Awareness and Other Factors Limiting the Adoption of Agricultural Inoculants.
8. Can you provide examples of recent developments in the market?
November 2022; In Mexico, a broad coalition of Mexican lawmakers is pushing the government to ban nearly 200 chemicals used in pesticides, showing that they are harmful to humans. This plan has already alarmed farmers as it will affect food production and agrochemical prices.
9. What pricing options are available for accessing the report?
Pricing options include single-user, multi-user, and enterprise licenses priced at USD 3800, USD 4500, and USD 5800 respectively.
10. Is the market size provided in terms of value or volume?
The market size is provided in terms of value, measured in Million.
11. Are there any specific market keywords associated with the report?
Yes, the market keyword associated with the report is "Mexican Agro Chemicals Industry," which aids in identifying and referencing the specific market segment covered.
12. How do I determine which pricing option suits my needs best?
The pricing options vary based on user requirements and access needs. Individual users may opt for single-user licenses, while businesses requiring broader access may choose multi-user or enterprise licenses for cost-effective access to the report.
13. Are there any additional resources or data provided in the Mexican Agro Chemicals Industry report?
While the report offers comprehensive insights, it's advisable to review the specific contents or supplementary materials provided to ascertain if additional resources or data are available.
14. How can I stay updated on further developments or reports in the Mexican Agro Chemicals Industry?
To stay informed about further developments, trends, and reports in the Mexican Agro Chemicals Industry, consider subscribing to industry newsletters, following relevant companies and organizations, or regularly checking reputable industry news sources and publications.
Methodology
Step 1 - Identification of Relevant Samples Size from Population Database


Step 2 - Approaches for Defining Global Market Size (Value, Volume* & Price*)

Note*: In applicable scenarios
Step 3 - Data Sources
Primary Research
- Web Analytics
- Survey Reports
- Research Institute
- Latest Research Reports
- Opinion Leaders
Secondary Research
- Annual Reports
- White Paper
- Latest Press Release
- Industry Association
- Paid Database
- Investor Presentations

Step 4 - Data Triangulation
Involves using different sources of information in order to increase the validity of a study
These sources are likely to be stakeholders in a program - participants, other researchers, program staff, other community members, and so on.
Then we put all data in single framework & apply various statistical tools to find out the dynamic on the market.
During the analysis stage, feedback from the stakeholder groups would be compared to determine areas of agreement as well as areas of divergence