
Key Insights
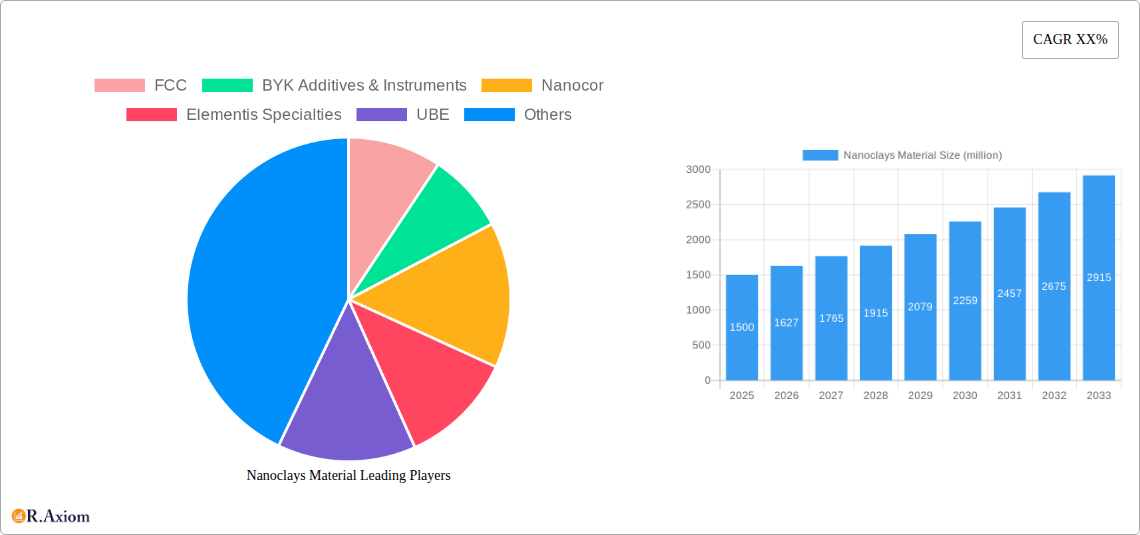
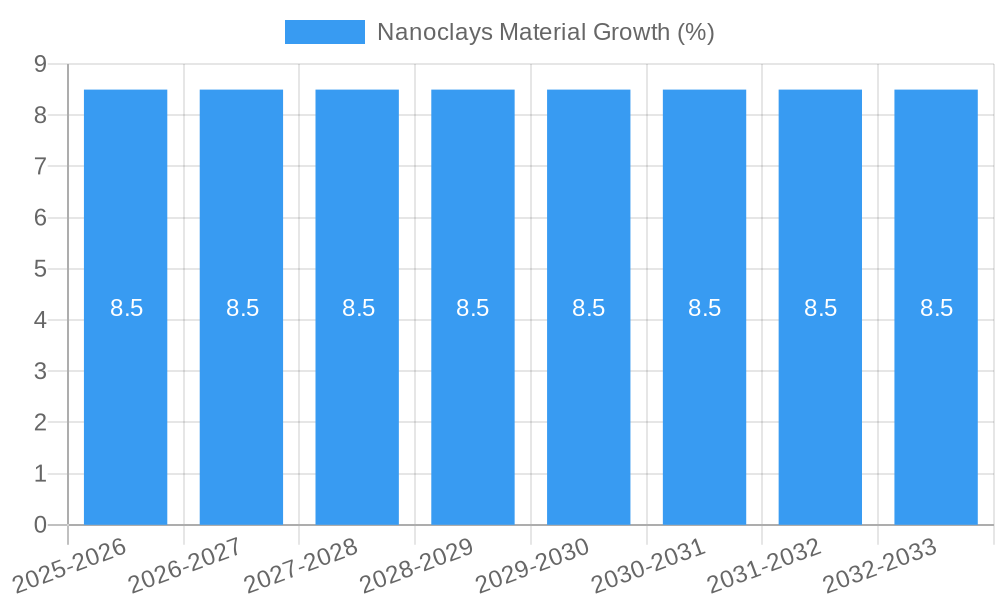
The global Nanoclays Material market is poised for substantial growth, projected to reach an estimated market size of $1,500 million by 2025, with a robust Compound Annual Growth Rate (CAGR) of 8.5% anticipated through 2033. This expansion is primarily fueled by the increasing demand across diverse applications, most notably in polymer composites where nanoclays significantly enhance mechanical properties, thermal stability, and barrier performance. The water treatment sector also presents a significant opportunity, driven by the need for advanced filtration and purification technologies that nanoclays can effectively support. While Kaolinite and Smectite represent the dominant clay types due to their widespread availability and established efficacy, ongoing research into novel clay modifications and sourcing will likely foster diversification within the material segments.
The market's upward trajectory is further supported by evolving industrial trends, including the push for lightweight and durable materials in automotive and aerospace, and the growing emphasis on sustainable solutions in packaging and construction. Innovations in nanocomposite formulations are continuously unlocking new possibilities for these versatile materials. However, certain restraints, such as the initial high cost of production and processing, and the need for specialized expertise in handling and dispersion, may temper the pace of widespread adoption in some segments. Despite these challenges, strategic investments in research and development, coupled with a growing awareness of nanoclays' superior performance characteristics, are expected to propel the market forward, with strong contributions anticipated from key regions like Asia Pacific and North America.
Nanoclays Material Market Concentration & Innovation
The nanoclays material market is characterized by a moderate to high level of concentration, with key players like BYK Additives & Instruments, Elementis Specialties, and UBE holding significant market share, estimated to be in the range of 20-30 million for top players. Innovation is a primary driver, with ongoing research and development focused on enhancing the performance characteristics of nanoclays for diverse applications, particularly in polymer composites and advanced materials. Regulatory frameworks are evolving, with an increasing emphasis on environmental sustainability and safety standards impacting production and application processes. Product substitutes, such as other nanofillers like carbon nanotubes and graphene, present a competitive challenge, though nanoclays offer distinct advantages in terms of cost-effectiveness and ease of dispersion in certain matrices. End-user trends indicate a growing demand for lightweight, high-strength, and environmentally friendly materials, directly benefiting the nanoclays sector. Mergers and acquisitions (M&A) activity is present, with strategic partnerships and acquisitions aimed at expanding geographical reach and product portfolios. Estimated M&A deal values in the past three years range from 50-150 million, highlighting strategic consolidation.
- Market Share Leaders: BYK Additives & Instruments, Elementis Specialties, UBE, Nanocor, Mineral Technologies.
- Innovation Focus: Enhanced mechanical properties, barrier properties, flame retardancy, biodegradability.
- Regulatory Impact: REACH compliance, environmental certifications, REACH compliance.
- Competitive Landscape: Competition from carbon nanotubes, graphene, and traditional fillers.
- M&A Activity: Strategic acquisitions to gain market share and technological expertise.
Nanoclays Material Industry Trends & Insights
The global nanoclays material market is poised for substantial growth, driven by a confluence of technological advancements, evolving consumer preferences, and expanding industrial applications. The market is projected to witness a Compound Annual Growth Rate (CAGR) of approximately 8-10% over the forecast period of 2025–2033. This robust growth is underpinned by the increasing demand for high-performance nanocomposites in industries such as automotive, aerospace, packaging, and construction. Nanoclays, when incorporated into polymer matrices, significantly enhance mechanical strength, thermal stability, barrier properties, and flame retardancy, making them indispensable for creating lighter, more durable, and sustainable products.
Technological disruptions are playing a pivotal role, with advancements in exfoliation techniques and surface modification of nanoclays leading to improved compatibility and dispersion within host materials. This results in more effective property enhancements at lower loading levels, thereby reducing material costs and environmental impact. The development of novel nanoclays with tailored properties for specific applications, such as organoclays for enhanced hydrophobicity or chemically modified nanoclays for improved adhesion, is a key trend.
Consumer preferences are increasingly leaning towards sustainable and eco-friendly materials. Nanoclays, derived from abundant natural minerals, offer a compelling solution for reducing the environmental footprint of manufactured goods. Their use in biodegradable polymers and in water treatment applications for removing pollutants further aligns with these consumer demands. The market penetration of nanoclays in emerging economies is expected to rise significantly, driven by industrialization and growing awareness of their performance benefits.
The competitive dynamics within the nanoclays material sector are intensifying. Companies are investing heavily in research and development to differentiate their offerings and secure intellectual property. Strategic collaborations between raw material suppliers, nanoclays manufacturers, and end-users are becoming more common, fostering innovation and accelerating market adoption. Key market players are focusing on expanding their production capacities and global distribution networks to cater to the growing international demand. The market penetration of nanoclays in polymer composites is estimated to reach over 60% by 2030, with water treatment applications following closely.
Dominant Markets & Segments in Nanoclays Material
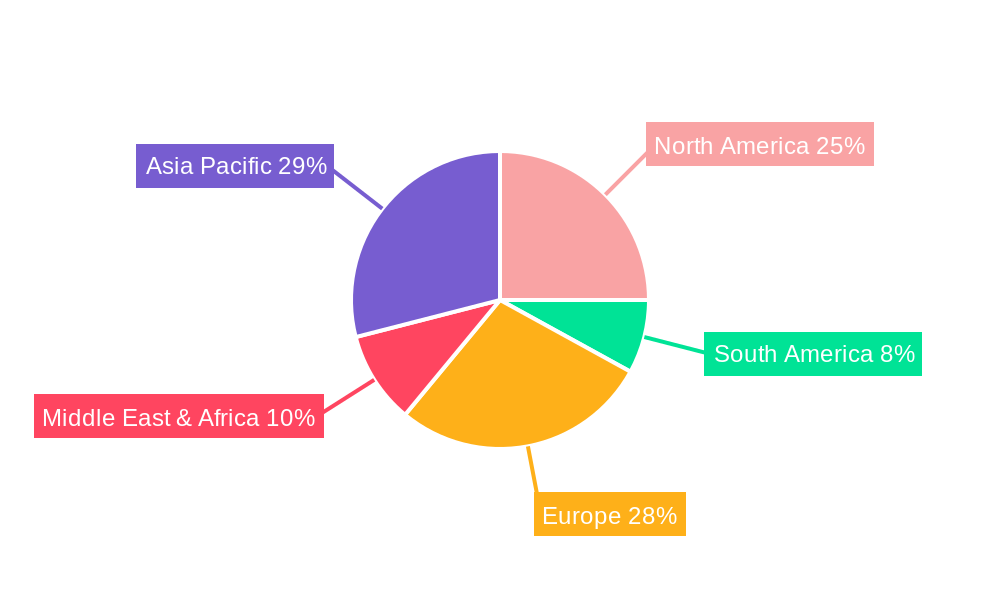
The nanoclays material market exhibits distinct dominance across various geographical regions and application segments, driven by a combination of economic policies, infrastructure development, and technological adoption. North America and Europe currently represent the largest markets for nanoclays, owing to their established industrial bases and significant investments in advanced materials research and development. The United States and Germany, in particular, are leading consumers, propelled by their strong automotive and aerospace sectors, where the demand for lightweight and high-performance composites is paramount. Asia-Pacific, however, is emerging as the fastest-growing region, fueled by rapid industrialization, expanding manufacturing capabilities, and increasing adoption of nanoclays in packaging and construction sectors in countries like China and India.
Within the application segments, Polymer Composites constitute the largest and most dominant market. This is attributed to the exceptional ability of nanoclays to reinforce polymers, leading to enhanced mechanical properties such as tensile strength, flexural modulus, and impact resistance. These improved properties translate into lighter and more durable end products, making nanoclays highly sought after in automotive components, packaging films, electrical insulation, and sporting goods. The global market size for nanoclays in polymer composites is projected to exceed 3,000 million by 2028.
The Water Treatment segment is also experiencing significant growth. Nanoclays, particularly montmorillonite-based clays, possess excellent adsorption capabilities, making them effective in removing various pollutants, including heavy metals, organic dyes, and pesticides from wastewater. This application is gaining traction due to increasing environmental regulations and the growing global concern over water scarcity and contamination. The market size for nanoclays in water treatment is estimated to reach over 1,500 million by 2028.
The Other application segment, encompassing areas like pharmaceuticals, cosmetics, coatings, and oil and gas, represents a diverse and growing market. In pharmaceuticals, nanoclays are utilized for controlled drug delivery systems and as excipients. In cosmetics, they serve as rheology modifiers and emulsifiers. In coatings, nanoclays enhance scratch resistance, UV protection, and barrier properties. The oil and gas industry employs nanoclays in drilling fluids for rheology control and wellbore stability.
When considering the types of nanoclays, Smectite clays, including montmorillonite, hectorite, and saponite, are the most widely used due to their layered structure, high aspect ratio, and ease of intercalation and exfoliation. Their superior ability to reinforce polymers and adsorb contaminants makes them the preferred choice for most applications. Kaolinite is another significant type, often used in filler applications, though its reinforcing capabilities are generally lower compared to smectites. The market for smectite nanoclays is projected to be over 4,000 million by 2028.
- Dominant Region: North America, Europe, with Asia-Pacific as the fastest-growing market.
- Leading Country: United States, Germany, China, India.
- Dominant Application: Polymer Composites, followed by Water Treatment.
- Key Drivers for Polymer Composites: Lightweighting, enhanced mechanical properties, improved barrier functions.
- Key Drivers for Water Treatment: Environmental regulations, water purification needs, efficient pollutant removal.
- Dominant Clay Type: Smectite (Montmorillonite), followed by Kaolinite.
- Economic Policies: Government initiatives promoting advanced materials and sustainable technologies.
- Infrastructure: Growth in construction and automotive manufacturing driving demand.
Nanoclays Material Product Developments
Nanoclays material product developments are characterized by a continuous drive towards enhanced performance and expanded applications. Innovations focus on improving the dispersion of nanoclays within polymer matrices through surface modification techniques, leading to superior mechanical strength, thermal stability, and barrier properties. For instance, organoclay modifications are creating highly compatible nanoclays for hydrophobic polymers, enhancing their use in automotive interiors and flexible packaging. Novel nanoclays with inherent antimicrobial properties are being developed for hygienic coatings and medical devices. The market fit for these advanced nanoclays is driven by the increasing demand for lightweight, durable, and sustainable materials across various industries, offering competitive advantages through superior performance and potential cost savings at higher loading levels.
Report Scope & Segmentation Analysis
This comprehensive report analyzes the global nanoclays material market, offering detailed segmentation across key parameters. The Application segment is dissected into Polymer Composites, Water Treatment, and Other applications, each examined for market size, growth projections, and competitive dynamics. The Polymer Composites segment is anticipated to dominate, driven by advancements in automotive and packaging industries. The Water Treatment segment showcases strong growth potential due to increasing environmental concerns. The Other segment covers diverse niche applications such as pharmaceuticals, cosmetics, and coatings.
Further segmentation is provided by Types of nanoclays: Kaolinite, Smectite, and Other. The Smectite segment, particularly montmorillonite-based nanoclays, is expected to lead the market due to its superior properties. Kaolinite and other types are analyzed for their specific market niches and growth trajectories.
- Application: Polymer Composites: Expected market size of over 3,000 million by 2028, driven by automotive and packaging.
- Application: Water Treatment: Projected market size exceeding 1,500 million by 2028, fueled by environmental regulations.
- Application: Other: Encompasses pharmaceuticals, cosmetics, coatings, etc., with significant niche growth.
- Type: Smectite: Dominant type, with market share estimated at over 60% of the total nanoclays market.
- Type: Kaolinite: Significant market presence, particularly in filler applications.
- Type: Other: Includes diverse clay types with specialized applications.
Key Drivers of Nanoclays Material Growth
The nanoclays material market is propelled by several interconnected growth drivers. Technological advancements in exfoliation, dispersion, and surface modification techniques are crucial, enabling enhanced material properties and broader application scope. The growing demand for lightweight and high-strength materials across industries like automotive and aerospace, to improve fuel efficiency and performance, is a primary economic driver. Furthermore, increasing environmental regulations worldwide are promoting the use of sustainable materials, including nanoclays, in applications such as packaging and water treatment. The expansion of manufacturing capabilities in emerging economies and the rising awareness of the cost-effectiveness and superior performance of nanoclays compared to traditional fillers also contribute significantly to market expansion.
Challenges in the Nanoclays Material Sector
Despite robust growth prospects, the nanoclays material sector faces several challenges. Scalability and cost-effectiveness of production for high-purity nanoclays can be a barrier, especially for specialized modifications. Dispersion issues within host matrices, particularly in certain polymer systems, can limit the full realization of their potential benefits, requiring significant R&D effort and application-specific formulation. Regulatory hurdles and potential health/environmental concerns surrounding nanomaterials, though often unsubstantiated, can lead to cautious adoption and require rigorous safety assessments. Price volatility of raw materials (clay minerals) and competition from alternative nanofillers like carbon nanotubes and graphene, which offer different sets of properties, also present competitive pressures.
Emerging Opportunities in Nanoclays Material
Emerging opportunities in the nanoclays material sector are diverse and promising. The development of biodegradable nanocomposites incorporating nanoclays presents a significant opportunity in the sustainable packaging and single-use plastics market. Advances in nanoclay-based membranes for water purification and desalination offer solutions to global water challenges. The integration of nanoclays into advanced functional materials, such as those with self-healing capabilities, piezoelectric properties, or enhanced conductivity, opens doors in high-tech applications like electronics and sensors. Furthermore, the growing demand for bio-based and natural additives in cosmetics and personal care products creates a niche for well-characterized and safe nanoclays.
Leading Players in the Nanoclays Material Market
- FCC
- BYK Additives & Instruments
- Nanocor
- Elementis Specialties
- UBE
- Mineral Technologies
- Jani Clays
Key Developments in Nanoclays Material Industry
- 2023 Q4: BYK Additives & Instruments launched a new range of surface-modified nanoclays for enhanced barrier properties in food packaging.
- 2024 Q1: Elementis Specialties announced a strategic partnership with a leading automotive manufacturer to develop lightweight nanocomposite components.
- 2024 Q2: Nanocor expanded its production capacity for bentonite-based nanoclays to meet rising demand in water treatment applications.
- 2024 Q3: UBE showcased novel nanoclay-enhanced coatings with superior scratch and UV resistance at an international materials conference.
- 2024 Q4: Mineral Technologies acquired a smaller player specializing in kaolinite-based fillers to broaden its product portfolio.
- 2025 Q1: Jani Clays introduced a new grade of organoclay optimized for biodegradable polymer composites.
Strategic Outlook for Nanoclays Material Market
The strategic outlook for the nanoclays material market is highly positive, driven by innovation and increasing demand for high-performance, sustainable materials. Key growth catalysts include the continued advancements in nanocomposite technology, particularly in the automotive, aerospace, and packaging sectors, where lightweighting and enhanced durability are paramount. The growing global focus on environmental sustainability and the need for effective water treatment solutions will further propel the adoption of nanoclays. Strategic partnerships and investments in research and development to overcome current challenges, such as dispersion and scalability, will be critical for unlocking new market potentials and solidifying the position of nanoclays as indispensable materials in a wide array of future applications.
Nanoclays Material Segmentation
-
1. Application
- 1.1. Polymer Composites
- 1.2. Water Treatment
- 1.3. Other
-
2. Types
- 2.1. Kaolinite
- 2.2. Smectite
- 2.3. Other
Nanoclays Material Segmentation By Geography
-
1. North America
- 1.1. United States
- 1.2. Canada
- 1.3. Mexico
-
2. South America
- 2.1. Brazil
- 2.2. Argentina
- 2.3. Rest of South America
-
3. Europe
- 3.1. United Kingdom
- 3.2. Germany
- 3.3. France
- 3.4. Italy
- 3.5. Spain
- 3.6. Russia
- 3.7. Benelux
- 3.8. Nordics
- 3.9. Rest of Europe
-
4. Middle East & Africa
- 4.1. Turkey
- 4.2. Israel
- 4.3. GCC
- 4.4. North Africa
- 4.5. South Africa
- 4.6. Rest of Middle East & Africa
-
5. Asia Pacific
- 5.1. China
- 5.2. India
- 5.3. Japan
- 5.4. South Korea
- 5.5. ASEAN
- 5.6. Oceania
- 5.7. Rest of Asia Pacific
Nanoclays Material REPORT HIGHLIGHTS
| Aspects | Details |
|---|---|
| Study Period | 2019-2033 |
| Base Year | 2024 |
| Estimated Year | 2025 |
| Forecast Period | 2025-2033 |
| Historical Period | 2019-2024 |
| Growth Rate | CAGR of XX% from 2019-2033 |
| Segmentation |
|
Table of Contents
- 1. Introduction
- 1.1. Research Scope
- 1.2. Market Segmentation
- 1.3. Research Methodology
- 1.4. Definitions and Assumptions
- 2. Executive Summary
- 2.1. Introduction
- 3. Market Dynamics
- 3.1. Introduction
- 3.2. Market Drivers
- 3.3. Market Restrains
- 3.4. Market Trends
- 4. Market Factor Analysis
- 4.1. Porters Five Forces
- 4.2. Supply/Value Chain
- 4.3. PESTEL analysis
- 4.4. Market Entropy
- 4.5. Patent/Trademark Analysis
- 5. Global Nanoclays Material Analysis, Insights and Forecast, 2019-2031
- 5.1. Market Analysis, Insights and Forecast - by Application
- 5.1.1. Polymer Composites
- 5.1.2. Water Treatment
- 5.1.3. Other
- 5.2. Market Analysis, Insights and Forecast - by Types
- 5.2.1. Kaolinite
- 5.2.2. Smectite
- 5.2.3. Other
- 5.3. Market Analysis, Insights and Forecast - by Region
- 5.3.1. North America
- 5.3.2. South America
- 5.3.3. Europe
- 5.3.4. Middle East & Africa
- 5.3.5. Asia Pacific
- 5.1. Market Analysis, Insights and Forecast - by Application
- 6. North America Nanoclays Material Analysis, Insights and Forecast, 2019-2031
- 6.1. Market Analysis, Insights and Forecast - by Application
- 6.1.1. Polymer Composites
- 6.1.2. Water Treatment
- 6.1.3. Other
- 6.2. Market Analysis, Insights and Forecast - by Types
- 6.2.1. Kaolinite
- 6.2.2. Smectite
- 6.2.3. Other
- 6.1. Market Analysis, Insights and Forecast - by Application
- 7. South America Nanoclays Material Analysis, Insights and Forecast, 2019-2031
- 7.1. Market Analysis, Insights and Forecast - by Application
- 7.1.1. Polymer Composites
- 7.1.2. Water Treatment
- 7.1.3. Other
- 7.2. Market Analysis, Insights and Forecast - by Types
- 7.2.1. Kaolinite
- 7.2.2. Smectite
- 7.2.3. Other
- 7.1. Market Analysis, Insights and Forecast - by Application
- 8. Europe Nanoclays Material Analysis, Insights and Forecast, 2019-2031
- 8.1. Market Analysis, Insights and Forecast - by Application
- 8.1.1. Polymer Composites
- 8.1.2. Water Treatment
- 8.1.3. Other
- 8.2. Market Analysis, Insights and Forecast - by Types
- 8.2.1. Kaolinite
- 8.2.2. Smectite
- 8.2.3. Other
- 8.1. Market Analysis, Insights and Forecast - by Application
- 9. Middle East & Africa Nanoclays Material Analysis, Insights and Forecast, 2019-2031
- 9.1. Market Analysis, Insights and Forecast - by Application
- 9.1.1. Polymer Composites
- 9.1.2. Water Treatment
- 9.1.3. Other
- 9.2. Market Analysis, Insights and Forecast - by Types
- 9.2.1. Kaolinite
- 9.2.2. Smectite
- 9.2.3. Other
- 9.1. Market Analysis, Insights and Forecast - by Application
- 10. Asia Pacific Nanoclays Material Analysis, Insights and Forecast, 2019-2031
- 10.1. Market Analysis, Insights and Forecast - by Application
- 10.1.1. Polymer Composites
- 10.1.2. Water Treatment
- 10.1.3. Other
- 10.2. Market Analysis, Insights and Forecast - by Types
- 10.2.1. Kaolinite
- 10.2.2. Smectite
- 10.2.3. Other
- 10.1. Market Analysis, Insights and Forecast - by Application
- 11. Competitive Analysis
- 11.1. Global Market Share Analysis 2024
- 11.2. Company Profiles
- 11.2.1 FCC
- 11.2.1.1. Overview
- 11.2.1.2. Products
- 11.2.1.3. SWOT Analysis
- 11.2.1.4. Recent Developments
- 11.2.1.5. Financials (Based on Availability)
- 11.2.2 BYK Additives & Instruments
- 11.2.2.1. Overview
- 11.2.2.2. Products
- 11.2.2.3. SWOT Analysis
- 11.2.2.4. Recent Developments
- 11.2.2.5. Financials (Based on Availability)
- 11.2.3 Nanocor
- 11.2.3.1. Overview
- 11.2.3.2. Products
- 11.2.3.3. SWOT Analysis
- 11.2.3.4. Recent Developments
- 11.2.3.5. Financials (Based on Availability)
- 11.2.4 Elementis Specialties
- 11.2.4.1. Overview
- 11.2.4.2. Products
- 11.2.4.3. SWOT Analysis
- 11.2.4.4. Recent Developments
- 11.2.4.5. Financials (Based on Availability)
- 11.2.5 UBE
- 11.2.5.1. Overview
- 11.2.5.2. Products
- 11.2.5.3. SWOT Analysis
- 11.2.5.4. Recent Developments
- 11.2.5.5. Financials (Based on Availability)
- 11.2.6 Mineral Technologies
- 11.2.6.1. Overview
- 11.2.6.2. Products
- 11.2.6.3. SWOT Analysis
- 11.2.6.4. Recent Developments
- 11.2.6.5. Financials (Based on Availability)
- 11.2.7 Jani Clays
- 11.2.7.1. Overview
- 11.2.7.2. Products
- 11.2.7.3. SWOT Analysis
- 11.2.7.4. Recent Developments
- 11.2.7.5. Financials (Based on Availability)
- 11.2.1 FCC
List of Figures
- Figure 1: Global Nanoclays Material Revenue Breakdown (million, %) by Region 2024 & 2032
- Figure 2: North America Nanoclays Material Revenue (million), by Application 2024 & 2032
- Figure 3: North America Nanoclays Material Revenue Share (%), by Application 2024 & 2032
- Figure 4: North America Nanoclays Material Revenue (million), by Types 2024 & 2032
- Figure 5: North America Nanoclays Material Revenue Share (%), by Types 2024 & 2032
- Figure 6: North America Nanoclays Material Revenue (million), by Country 2024 & 2032
- Figure 7: North America Nanoclays Material Revenue Share (%), by Country 2024 & 2032
- Figure 8: South America Nanoclays Material Revenue (million), by Application 2024 & 2032
- Figure 9: South America Nanoclays Material Revenue Share (%), by Application 2024 & 2032
- Figure 10: South America Nanoclays Material Revenue (million), by Types 2024 & 2032
- Figure 11: South America Nanoclays Material Revenue Share (%), by Types 2024 & 2032
- Figure 12: South America Nanoclays Material Revenue (million), by Country 2024 & 2032
- Figure 13: South America Nanoclays Material Revenue Share (%), by Country 2024 & 2032
- Figure 14: Europe Nanoclays Material Revenue (million), by Application 2024 & 2032
- Figure 15: Europe Nanoclays Material Revenue Share (%), by Application 2024 & 2032
- Figure 16: Europe Nanoclays Material Revenue (million), by Types 2024 & 2032
- Figure 17: Europe Nanoclays Material Revenue Share (%), by Types 2024 & 2032
- Figure 18: Europe Nanoclays Material Revenue (million), by Country 2024 & 2032
- Figure 19: Europe Nanoclays Material Revenue Share (%), by Country 2024 & 2032
- Figure 20: Middle East & Africa Nanoclays Material Revenue (million), by Application 2024 & 2032
- Figure 21: Middle East & Africa Nanoclays Material Revenue Share (%), by Application 2024 & 2032
- Figure 22: Middle East & Africa Nanoclays Material Revenue (million), by Types 2024 & 2032
- Figure 23: Middle East & Africa Nanoclays Material Revenue Share (%), by Types 2024 & 2032
- Figure 24: Middle East & Africa Nanoclays Material Revenue (million), by Country 2024 & 2032
- Figure 25: Middle East & Africa Nanoclays Material Revenue Share (%), by Country 2024 & 2032
- Figure 26: Asia Pacific Nanoclays Material Revenue (million), by Application 2024 & 2032
- Figure 27: Asia Pacific Nanoclays Material Revenue Share (%), by Application 2024 & 2032
- Figure 28: Asia Pacific Nanoclays Material Revenue (million), by Types 2024 & 2032
- Figure 29: Asia Pacific Nanoclays Material Revenue Share (%), by Types 2024 & 2032
- Figure 30: Asia Pacific Nanoclays Material Revenue (million), by Country 2024 & 2032
- Figure 31: Asia Pacific Nanoclays Material Revenue Share (%), by Country 2024 & 2032
List of Tables
- Table 1: Global Nanoclays Material Revenue million Forecast, by Region 2019 & 2032
- Table 2: Global Nanoclays Material Revenue million Forecast, by Application 2019 & 2032
- Table 3: Global Nanoclays Material Revenue million Forecast, by Types 2019 & 2032
- Table 4: Global Nanoclays Material Revenue million Forecast, by Region 2019 & 2032
- Table 5: Global Nanoclays Material Revenue million Forecast, by Application 2019 & 2032
- Table 6: Global Nanoclays Material Revenue million Forecast, by Types 2019 & 2032
- Table 7: Global Nanoclays Material Revenue million Forecast, by Country 2019 & 2032
- Table 8: United States Nanoclays Material Revenue (million) Forecast, by Application 2019 & 2032
- Table 9: Canada Nanoclays Material Revenue (million) Forecast, by Application 2019 & 2032
- Table 10: Mexico Nanoclays Material Revenue (million) Forecast, by Application 2019 & 2032
- Table 11: Global Nanoclays Material Revenue million Forecast, by Application 2019 & 2032
- Table 12: Global Nanoclays Material Revenue million Forecast, by Types 2019 & 2032
- Table 13: Global Nanoclays Material Revenue million Forecast, by Country 2019 & 2032
- Table 14: Brazil Nanoclays Material Revenue (million) Forecast, by Application 2019 & 2032
- Table 15: Argentina Nanoclays Material Revenue (million) Forecast, by Application 2019 & 2032
- Table 16: Rest of South America Nanoclays Material Revenue (million) Forecast, by Application 2019 & 2032
- Table 17: Global Nanoclays Material Revenue million Forecast, by Application 2019 & 2032
- Table 18: Global Nanoclays Material Revenue million Forecast, by Types 2019 & 2032
- Table 19: Global Nanoclays Material Revenue million Forecast, by Country 2019 & 2032
- Table 20: United Kingdom Nanoclays Material Revenue (million) Forecast, by Application 2019 & 2032
- Table 21: Germany Nanoclays Material Revenue (million) Forecast, by Application 2019 & 2032
- Table 22: France Nanoclays Material Revenue (million) Forecast, by Application 2019 & 2032
- Table 23: Italy Nanoclays Material Revenue (million) Forecast, by Application 2019 & 2032
- Table 24: Spain Nanoclays Material Revenue (million) Forecast, by Application 2019 & 2032
- Table 25: Russia Nanoclays Material Revenue (million) Forecast, by Application 2019 & 2032
- Table 26: Benelux Nanoclays Material Revenue (million) Forecast, by Application 2019 & 2032
- Table 27: Nordics Nanoclays Material Revenue (million) Forecast, by Application 2019 & 2032
- Table 28: Rest of Europe Nanoclays Material Revenue (million) Forecast, by Application 2019 & 2032
- Table 29: Global Nanoclays Material Revenue million Forecast, by Application 2019 & 2032
- Table 30: Global Nanoclays Material Revenue million Forecast, by Types 2019 & 2032
- Table 31: Global Nanoclays Material Revenue million Forecast, by Country 2019 & 2032
- Table 32: Turkey Nanoclays Material Revenue (million) Forecast, by Application 2019 & 2032
- Table 33: Israel Nanoclays Material Revenue (million) Forecast, by Application 2019 & 2032
- Table 34: GCC Nanoclays Material Revenue (million) Forecast, by Application 2019 & 2032
- Table 35: North Africa Nanoclays Material Revenue (million) Forecast, by Application 2019 & 2032
- Table 36: South Africa Nanoclays Material Revenue (million) Forecast, by Application 2019 & 2032
- Table 37: Rest of Middle East & Africa Nanoclays Material Revenue (million) Forecast, by Application 2019 & 2032
- Table 38: Global Nanoclays Material Revenue million Forecast, by Application 2019 & 2032
- Table 39: Global Nanoclays Material Revenue million Forecast, by Types 2019 & 2032
- Table 40: Global Nanoclays Material Revenue million Forecast, by Country 2019 & 2032
- Table 41: China Nanoclays Material Revenue (million) Forecast, by Application 2019 & 2032
- Table 42: India Nanoclays Material Revenue (million) Forecast, by Application 2019 & 2032
- Table 43: Japan Nanoclays Material Revenue (million) Forecast, by Application 2019 & 2032
- Table 44: South Korea Nanoclays Material Revenue (million) Forecast, by Application 2019 & 2032
- Table 45: ASEAN Nanoclays Material Revenue (million) Forecast, by Application 2019 & 2032
- Table 46: Oceania Nanoclays Material Revenue (million) Forecast, by Application 2019 & 2032
- Table 47: Rest of Asia Pacific Nanoclays Material Revenue (million) Forecast, by Application 2019 & 2032
Frequently Asked Questions
1. What is the projected Compound Annual Growth Rate (CAGR) of the Nanoclays Material?
The projected CAGR is approximately XX%.
2. Which companies are prominent players in the Nanoclays Material?
Key companies in the market include FCC, BYK Additives & Instruments, Nanocor, Elementis Specialties, UBE, Mineral Technologies, Jani Clays.
3. What are the main segments of the Nanoclays Material?
The market segments include Application, Types.
4. Can you provide details about the market size?
The market size is estimated to be USD XXX million as of 2022.
5. What are some drivers contributing to market growth?
N/A
6. What are the notable trends driving market growth?
N/A
7. Are there any restraints impacting market growth?
N/A
8. Can you provide examples of recent developments in the market?
N/A
9. What pricing options are available for accessing the report?
Pricing options include single-user, multi-user, and enterprise licenses priced at USD 4900.00, USD 7350.00, and USD 9800.00 respectively.
10. Is the market size provided in terms of value or volume?
The market size is provided in terms of value, measured in million.
11. Are there any specific market keywords associated with the report?
Yes, the market keyword associated with the report is "Nanoclays Material," which aids in identifying and referencing the specific market segment covered.
12. How do I determine which pricing option suits my needs best?
The pricing options vary based on user requirements and access needs. Individual users may opt for single-user licenses, while businesses requiring broader access may choose multi-user or enterprise licenses for cost-effective access to the report.
13. Are there any additional resources or data provided in the Nanoclays Material report?
While the report offers comprehensive insights, it's advisable to review the specific contents or supplementary materials provided to ascertain if additional resources or data are available.
14. How can I stay updated on further developments or reports in the Nanoclays Material?
To stay informed about further developments, trends, and reports in the Nanoclays Material, consider subscribing to industry newsletters, following relevant companies and organizations, or regularly checking reputable industry news sources and publications.
Methodology
Step 1 - Identification of Relevant Samples Size from Population Database


Step 2 - Approaches for Defining Global Market Size (Value, Volume* & Price*)

Note*: In applicable scenarios
Step 3 - Data Sources
Primary Research
- Web Analytics
- Survey Reports
- Research Institute
- Latest Research Reports
- Opinion Leaders
Secondary Research
- Annual Reports
- White Paper
- Latest Press Release
- Industry Association
- Paid Database
- Investor Presentations

Step 4 - Data Triangulation
Involves using different sources of information in order to increase the validity of a study
These sources are likely to be stakeholders in a program - participants, other researchers, program staff, other community members, and so on.
Then we put all data in single framework & apply various statistical tools to find out the dynamic on the market.
During the analysis stage, feedback from the stakeholder groups would be compared to determine areas of agreement as well as areas of divergence


