
Key Insights
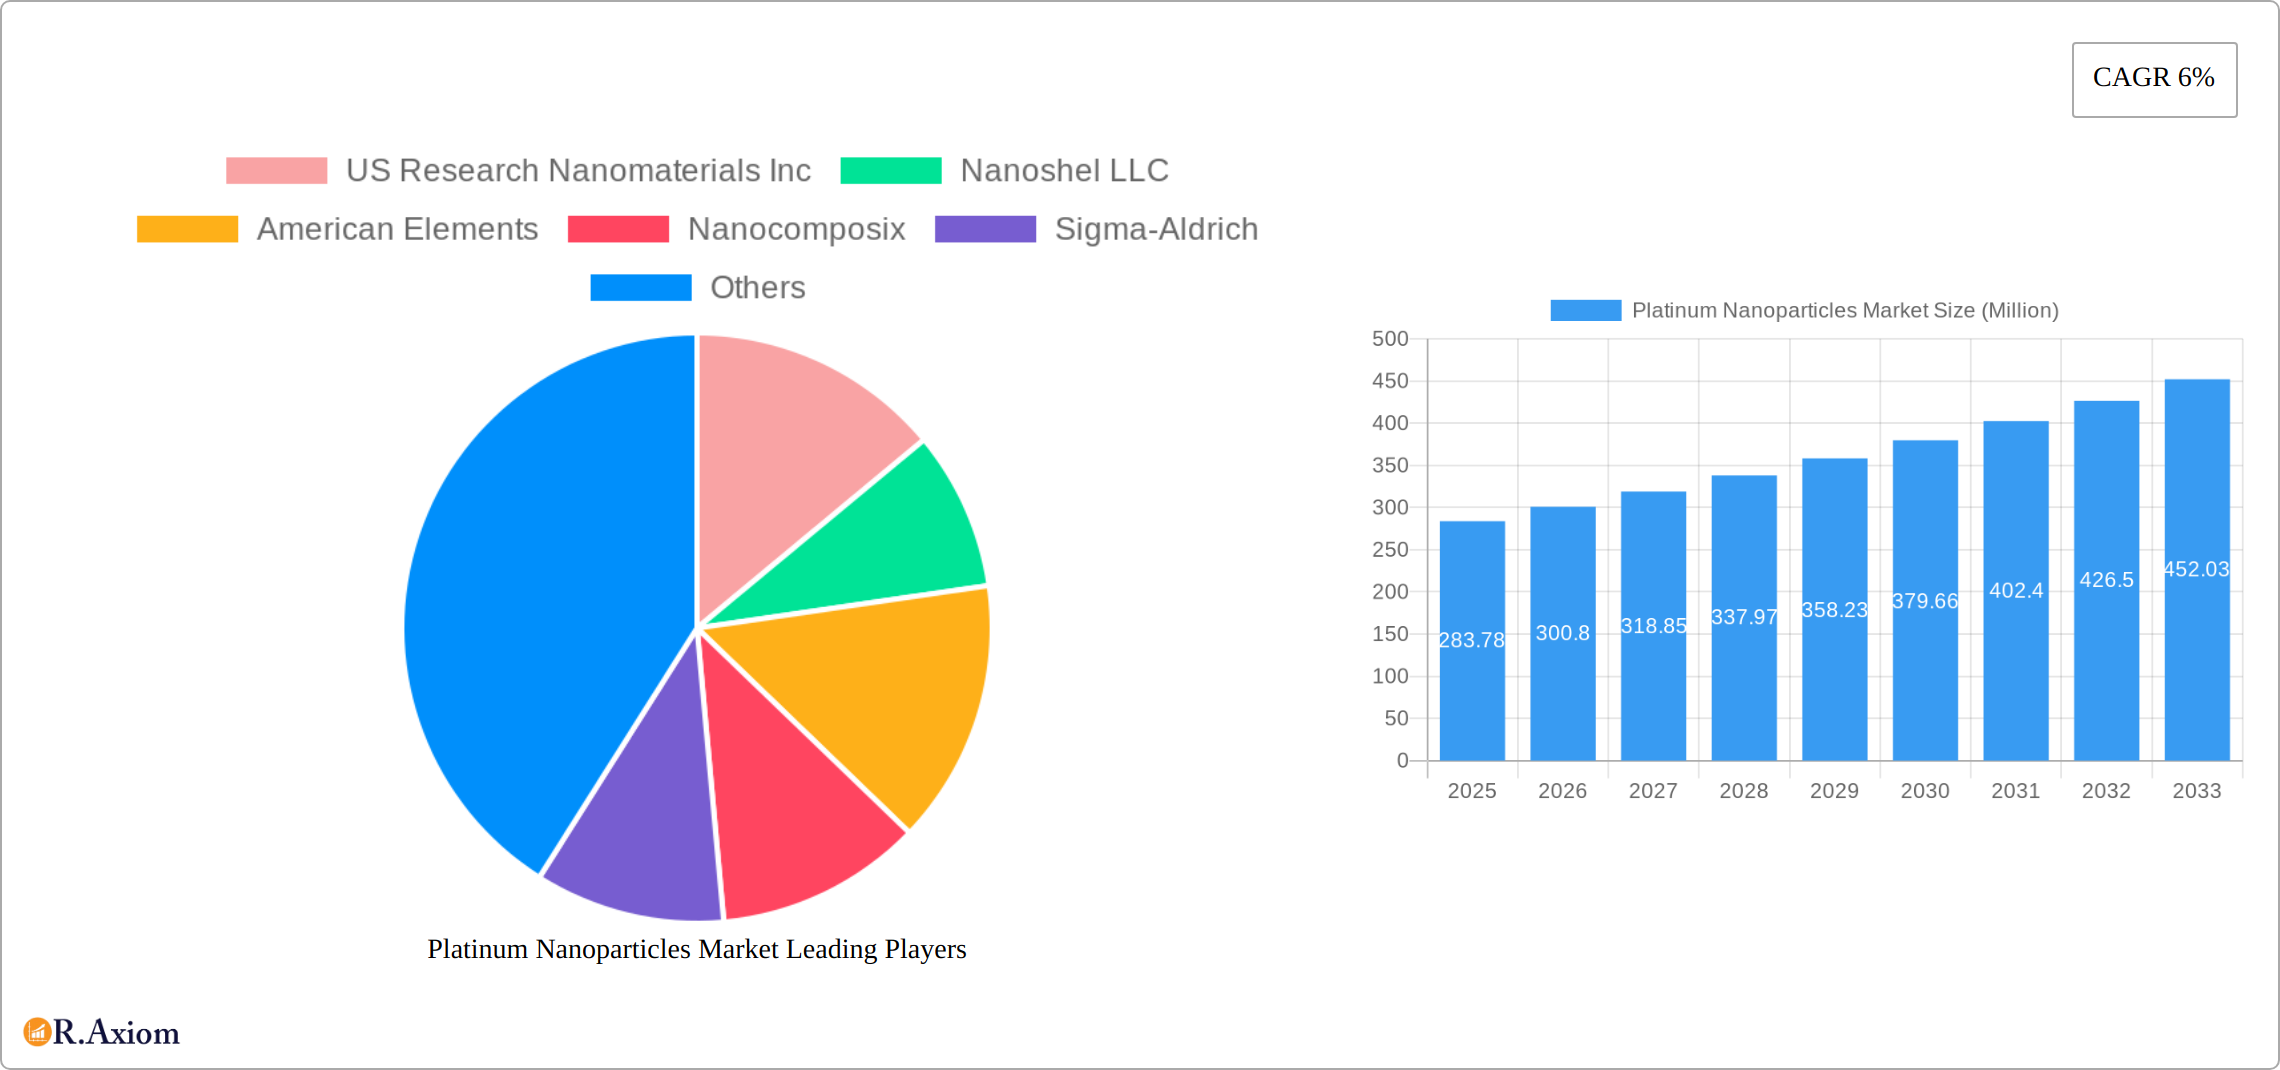
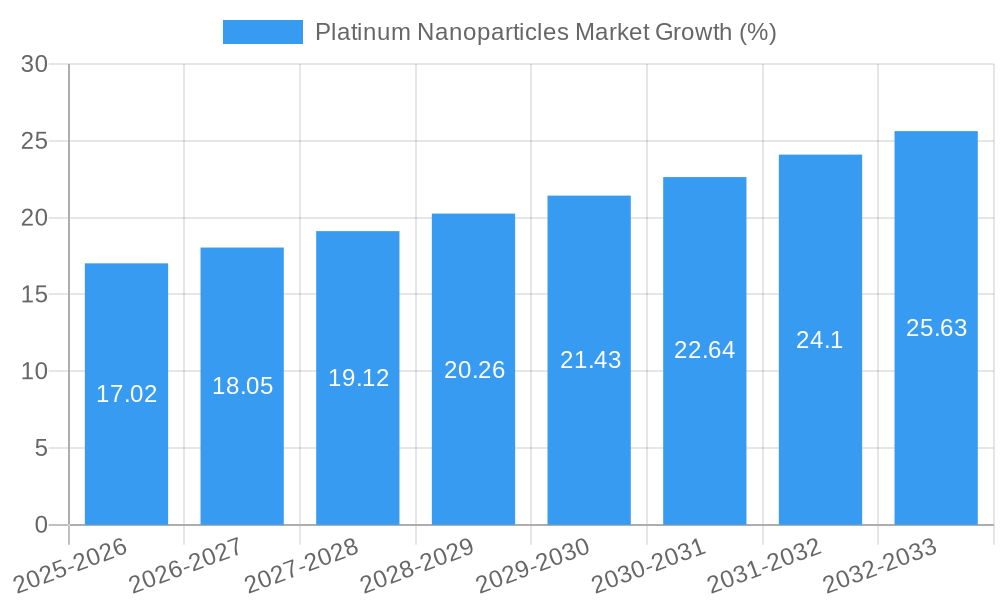
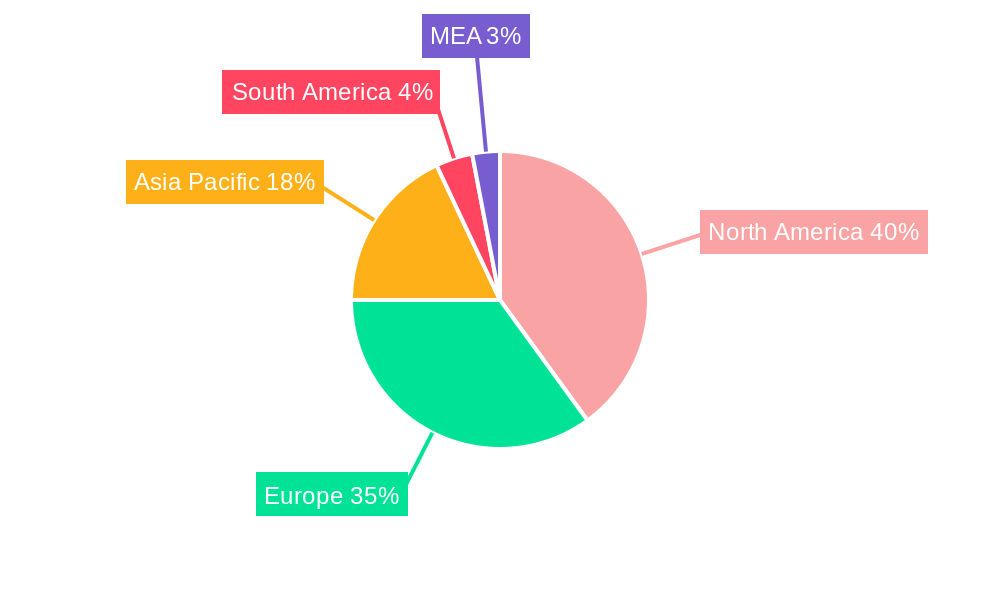
The Platinum Nanoparticles market, valued at $283.78 million in 2025, is projected to experience robust growth, driven by its increasing applications across diverse sectors. A compound annual growth rate (CAGR) of 6% from 2025 to 2033 indicates a significant expansion of this market. Key drivers include the rising demand for platinum nanoparticles in the automotive industry for catalytic converters and sensors, as well as their expanding use in healthcare for drug delivery and diagnostics. The chemical industry also leverages their unique catalytic properties in various processes. Market segmentation reveals a diverse landscape, with spherical, cube, and square nanoparticles leading the product segment, while the automotive and healthcare sectors dominate end-user industry applications. Technological advancements, particularly in synthesis and functionalization techniques, are fueling market growth. However, the high cost of platinum and potential environmental concerns associated with nanoparticle synthesis and disposal represent key restraints to consider. Competition in the market is relatively intense, with established players like Sigma-Aldrich and emerging companies like Nanoshel LLC vying for market share. Geographic analysis suggests North America and Europe currently hold a substantial market share due to strong research and development infrastructure, but the Asia-Pacific region is poised for significant growth due to increasing industrialization and expanding applications.
The forecast period (2025-2033) is expected to witness a continuous upward trend, influenced by ongoing research and development efforts leading to new applications in fields like electronics and energy. Strategic partnerships and mergers & acquisitions will likely play a role in shaping the competitive landscape. Future market developments may include the emergence of more sustainable and cost-effective synthesis methods, along with regulatory changes that could impact the adoption of platinum nanoparticles. This necessitates a dynamic market strategy from players, emphasizing innovation and adapting to evolving technological and regulatory landscapes. The long-term outlook for the Platinum Nanoparticles market remains positive, driven by its unique properties and increasing demand across multiple industries.
Platinum Nanoparticles Market: A Comprehensive Analysis (2019-2033)
This in-depth report provides a comprehensive analysis of the global Platinum Nanoparticles Market, offering invaluable insights for industry stakeholders, investors, and researchers. The study covers the period from 2019 to 2033, with 2025 as the base and estimated year. The report meticulously examines market dynamics, segmentation, key players, and future growth prospects. With a focus on actionable intelligence and data-driven conclusions, this report is an indispensable resource for navigating the complexities of this rapidly evolving market.
Platinum Nanoparticles Market Concentration & Innovation
The Platinum Nanoparticles market exhibits a moderately concentrated landscape, with several key players holding significant market share. While precise market share figures for individual companies are proprietary to the full report, US Research Nanomaterials Inc, Nanoshel LLC, American Elements, and Nanocomposix are among the prominent players driving innovation. The market is characterized by ongoing R&D efforts focused on enhancing particle size control, surface functionalization, and expanding applications. Regulatory frameworks, particularly concerning nanomaterial safety and environmental impact, play a significant role in shaping market growth. Product substitutes, such as other precious metal nanoparticles or alternative catalytic materials, pose a moderate competitive threat. End-user trends, particularly in the healthcare and automotive sectors, are driving demand for specific platinum nanoparticle properties. Mergers and acquisitions (M&A) activity in the past five years has been moderate, with deal values averaging approximately xx Million annually (data available in the full report). Key M&A activities, drivers, and their impact on the competitive landscape are detailed within the complete report.
Platinum Nanoparticles Market Industry Trends & Insights
The global Platinum Nanoparticles market is experiencing robust growth, with a projected Compound Annual Growth Rate (CAGR) of xx% during the forecast period (2025-2033). This growth is propelled by several key factors. The increasing adoption of platinum nanoparticles in catalytic converters for automotive emission control is a major driver, fueled by stricter emission regulations globally. Furthermore, the expanding applications of platinum nanoparticles in the healthcare sector, such as targeted drug delivery and diagnostic imaging, are significantly contributing to market expansion. Technological disruptions, particularly advancements in nanofabrication techniques, are enabling the production of platinum nanoparticles with superior properties, leading to increased market penetration in various industries. Consumer preferences for environmentally friendly and high-performance products further drive demand. However, competitive dynamics are intensifying, with existing players focusing on innovation and expanding their product portfolios. The market penetration of platinum nanoparticles in various end-use applications is further detailed in the full report, including regional and segment-specific data.
Dominant Markets & Segments in Platinum Nanoparticles Market
The North American region currently holds the dominant position in the global Platinum Nanoparticles market, driven by strong technological advancements, robust regulatory support, and high demand from automotive and healthcare sectors. Within the product segment, spherical platinum nanoparticles constitute the largest share due to their ease of production and versatile applications. In the end-user industry segment, the healthcare sector displays the highest growth rate, fueled by the increasing use of platinum nanoparticles in drug delivery systems, biosensors, and medical imaging.
Key Drivers for North American Dominance:
- Robust R&D infrastructure and funding.
- Stringent environmental regulations driving demand in the automotive sector.
- High adoption rate of advanced technologies in healthcare.
- Strong presence of key market players.
Other Regions: The Asia-Pacific region is also exhibiting significant growth potential, driven by rapid industrialization and increasing investments in nanotechnology. Detailed analysis of regional market dynamics is presented in the complete report.
Platinum Nanoparticles Market Product Developments
Recent years have witnessed significant advancements in platinum nanoparticle technology, focusing on tailoring particle size, shape, and surface functionalities to optimize performance for specific applications. Innovations include the development of highly monodisperse nanoparticles with precise control over size and shape, enhancing catalytic activity and improving biocompatibility for biomedical applications. These developments are directly translating into competitive advantages, allowing manufacturers to cater to niche market needs and command premium prices. The integration of novel surface modification techniques is further boosting the efficacy and versatility of platinum nanoparticles across diverse sectors.
Report Scope & Segmentation Analysis
This report offers a comprehensive segmentation of the Platinum Nanoparticles market, analyzing both product type and end-user industry to provide a detailed market overview. The analysis considers various factors influencing market dynamics, including production methods, application-specific properties, and regional demand.
Product Segmentation:
- Spherical Platinum Nanoparticles: This segment currently holds the largest market share, attributed to its versatile applications and relatively straightforward manufacturing process. The report provides detailed growth projections for this segment, considering factors such as production capacity expansions and evolving application demands.
- Cubic Platinum Nanoparticles: Characterized by unique properties beneficial in specialized applications, this segment exhibits moderate but consistent growth. The report delves into a thorough analysis of market size, competitive landscape, and future growth potential for cubic nanoparticles.
- Square Platinum Nanoparticles: Representing a niche segment, square platinum nanoparticles show significant promise for future expansion, driven by ongoing research and development efforts focused on optimizing their properties for specific applications. Detailed forecasts outlining the potential market growth are included in the full report.
- Other Platinum Nanoparticle Shapes: This category encompasses a range of shapes including rods, wires, and other less common morphologies. The report provides specific market sizes and growth forecasts for these diverse nanoparticle forms, considering their unique characteristics and corresponding applications.
End-User Industry Segmentation:
- Automotive Industry: A major consumer of platinum nanoparticles, this segment relies heavily on their use in catalytic converters to meet stringent emission regulations. The report analyzes the influence of evolving emission standards on market demand within this sector.
- Healthcare Industry: This rapidly expanding segment leverages platinum nanoparticles in various applications, including drug delivery systems, diagnostic tools, and therapeutic agents. The report examines the impact of advancements in biomedical technologies on the growth of this sector.
- Chemical Industry: Platinum nanoparticles serve as highly effective catalysts in numerous chemical processes. The report assesses the steady growth within this segment, considering factors such as industrial production levels and technological advancements impacting catalytic efficiency.
- Other End-User Industries: This category includes diverse sectors such as electronics, energy, and environmental remediation, each exhibiting unique growth trajectories detailed within the full report. The report analyzes the specific applications and market potential for platinum nanoparticles within these various industries.
Key Drivers of Platinum Nanoparticles Market Growth
The Platinum Nanoparticles market is propelled by several key factors, including:
- Stringent environmental regulations: Governments worldwide are implementing stricter emission standards, driving demand for highly efficient catalytic converters incorporating platinum nanoparticles.
- Advancements in nanotechnology: Continuous innovation in nanofabrication techniques enables the production of platinum nanoparticles with improved properties and functionalities.
- Growing healthcare sector: The expanding applications of platinum nanoparticles in drug delivery and diagnostics fuel significant market growth.
Challenges in the Platinum Nanoparticles Market Sector
The Platinum Nanoparticles market faces several challenges, including:
- High cost of production: The high cost of platinum and complex manufacturing processes can limit market accessibility.
- Regulatory hurdles: Stringent regulations concerning the safety and environmental impact of nanomaterials can increase production costs and hinder market growth.
- Supply chain disruptions: Any disruption in the supply of raw materials can impact the production of platinum nanoparticles.
Emerging Opportunities in Platinum Nanoparticles Market
Several emerging opportunities are shaping the future of the Platinum Nanoparticles market:
- Development of novel applications: Research and development efforts are exploring new applications in fields such as energy storage and sensing.
- Expansion into developing economies: Growing industrialization in developing economies presents significant market expansion potential.
- Advancements in surface functionalization: The development of advanced surface modification techniques allows for enhanced particle dispersion and biocompatibility, expanding market applications.
Leading Players in the Platinum Nanoparticles Market
- US Research Nanomaterials Inc
- Nanoshel LLC
- American Elements
- Nanocomposix
- Sigma-Aldrich
- NanoBio Chemicals India Pvt Ltd
- TANAKA HOLDINGS Co Ltd
- Nanostructured & Amorphous Materials Inc
- Metrohm India Limited
- HiQ-Nano s r l
- Strem Chemicals Inc
- PlasmaChem GmbH
- Meliorum Technologies Inc
- Particular GMBH
- NANOCHEMAZONE
Key Developments in Platinum Nanoparticles Market Industry
- January 2023: Nanocomposix launched a new line of highly monodisperse platinum nanoparticles.
- June 2022: American Elements announced a strategic partnership to expand its distribution network for platinum nanoparticles in Asia.
- (Further key developments with dates are detailed in the full report.)
Strategic Outlook for Platinum Nanoparticles Market Market
The Platinum Nanoparticles market is poised for significant growth in the coming years, driven by technological advancements, expanding applications, and increasing demand from various sectors. The focus on sustainable and environmentally friendly solutions will further fuel market expansion. Strategic investments in R&D, focusing on cost reduction and enhanced functionalities, will be crucial for market leadership. The exploration of new applications and expansion into emerging markets will further enhance the long-term growth potential of the Platinum Nanoparticles market.
Platinum Nanoparticles Market Segmentation
-
1. Product
- 1.1. Spherical
- 1.2. Cube
- 1.3. Square
- 1.4. Others
-
2. End-user Industry
- 2.1. Automotive
- 2.2. Health Care
- 2.3. Chemical
- 2.4. Others
Platinum Nanoparticles Market Segmentation By Geography
-
1. Asia Pacific
- 1.1. China
- 1.2. India
- 1.3. Japan
- 1.4. South Korea
- 1.5. Rest of Asia Pacific
-
2. North America
- 2.1. United States
- 2.2. Canada
- 2.3. Mexico
-
3. Europe
- 3.1. Germany
- 3.2. United Kingdom
- 3.3. France
- 3.4. Italy
- 3.5. Rest of Europe
-
4. South America
- 4.1. Brazil
- 4.2. Argentina
- 4.3. Rest of South America
-
5. Middle East and Africa
- 5.1. Saudi Arabia
- 5.2. South Africa
- 5.3. Rest of Middle East and Africa
Platinum Nanoparticles Market REPORT HIGHLIGHTS
| Aspects | Details |
|---|---|
| Study Period | 2019-2033 |
| Base Year | 2024 |
| Estimated Year | 2025 |
| Forecast Period | 2025-2033 |
| Historical Period | 2019-2024 |
| Growth Rate | CAGR of 6% from 2019-2033 |
| Segmentation |
|
Table of Contents
- 1. Introduction
- 1.1. Research Scope
- 1.2. Market Segmentation
- 1.3. Research Methodology
- 1.4. Definitions and Assumptions
- 2. Executive Summary
- 2.1. Introduction
- 3. Market Dynamics
- 3.1. Introduction
- 3.2. Market Drivers
- 3.2.1. ; Growing Health Care Industry; Other Drivers
- 3.3. Market Restrains
- 3.3.1. ; Toxic Nature of Platinum Nanoparticles; Unfavorable Conditions in Non-medical End-user Industries Arising Due to COVID-19 Outbreak
- 3.4. Market Trends
- 3.4.1. Health Care Segment to Dominate the Market
- 4. Market Factor Analysis
- 4.1. Porters Five Forces
- 4.2. Supply/Value Chain
- 4.3. PESTEL analysis
- 4.4. Market Entropy
- 4.5. Patent/Trademark Analysis
- 5. Global Platinum Nanoparticles Market Analysis, Insights and Forecast, 2019-2031
- 5.1. Market Analysis, Insights and Forecast - by Product
- 5.1.1. Spherical
- 5.1.2. Cube
- 5.1.3. Square
- 5.1.4. Others
- 5.2. Market Analysis, Insights and Forecast - by End-user Industry
- 5.2.1. Automotive
- 5.2.2. Health Care
- 5.2.3. Chemical
- 5.2.4. Others
- 5.3. Market Analysis, Insights and Forecast - by Region
- 5.3.1. Asia Pacific
- 5.3.2. North America
- 5.3.3. Europe
- 5.3.4. South America
- 5.3.5. Middle East and Africa
- 5.1. Market Analysis, Insights and Forecast - by Product
- 6. Asia Pacific Platinum Nanoparticles Market Analysis, Insights and Forecast, 2019-2031
- 6.1. Market Analysis, Insights and Forecast - by Product
- 6.1.1. Spherical
- 6.1.2. Cube
- 6.1.3. Square
- 6.1.4. Others
- 6.2. Market Analysis, Insights and Forecast - by End-user Industry
- 6.2.1. Automotive
- 6.2.2. Health Care
- 6.2.3. Chemical
- 6.2.4. Others
- 6.1. Market Analysis, Insights and Forecast - by Product
- 7. North America Platinum Nanoparticles Market Analysis, Insights and Forecast, 2019-2031
- 7.1. Market Analysis, Insights and Forecast - by Product
- 7.1.1. Spherical
- 7.1.2. Cube
- 7.1.3. Square
- 7.1.4. Others
- 7.2. Market Analysis, Insights and Forecast - by End-user Industry
- 7.2.1. Automotive
- 7.2.2. Health Care
- 7.2.3. Chemical
- 7.2.4. Others
- 7.1. Market Analysis, Insights and Forecast - by Product
- 8. Europe Platinum Nanoparticles Market Analysis, Insights and Forecast, 2019-2031
- 8.1. Market Analysis, Insights and Forecast - by Product
- 8.1.1. Spherical
- 8.1.2. Cube
- 8.1.3. Square
- 8.1.4. Others
- 8.2. Market Analysis, Insights and Forecast - by End-user Industry
- 8.2.1. Automotive
- 8.2.2. Health Care
- 8.2.3. Chemical
- 8.2.4. Others
- 8.1. Market Analysis, Insights and Forecast - by Product
- 9. South America Platinum Nanoparticles Market Analysis, Insights and Forecast, 2019-2031
- 9.1. Market Analysis, Insights and Forecast - by Product
- 9.1.1. Spherical
- 9.1.2. Cube
- 9.1.3. Square
- 9.1.4. Others
- 9.2. Market Analysis, Insights and Forecast - by End-user Industry
- 9.2.1. Automotive
- 9.2.2. Health Care
- 9.2.3. Chemical
- 9.2.4. Others
- 9.1. Market Analysis, Insights and Forecast - by Product
- 10. Middle East and Africa Platinum Nanoparticles Market Analysis, Insights and Forecast, 2019-2031
- 10.1. Market Analysis, Insights and Forecast - by Product
- 10.1.1. Spherical
- 10.1.2. Cube
- 10.1.3. Square
- 10.1.4. Others
- 10.2. Market Analysis, Insights and Forecast - by End-user Industry
- 10.2.1. Automotive
- 10.2.2. Health Care
- 10.2.3. Chemical
- 10.2.4. Others
- 10.1. Market Analysis, Insights and Forecast - by Product
- 11. North America Platinum Nanoparticles Market Analysis, Insights and Forecast, 2019-2031
- 11.1. Market Analysis, Insights and Forecast - By Country/Sub-region
- 11.1.1 United States
- 11.1.2 Canada
- 11.1.3 Mexico
- 12. Europe Platinum Nanoparticles Market Analysis, Insights and Forecast, 2019-2031
- 12.1. Market Analysis, Insights and Forecast - By Country/Sub-region
- 12.1.1 Germany
- 12.1.2 France
- 12.1.3 Italy
- 12.1.4 United Kingdom
- 12.1.5 Netherlands
- 12.1.6 Rest of Europe
- 13. Asia Pacific Platinum Nanoparticles Market Analysis, Insights and Forecast, 2019-2031
- 13.1. Market Analysis, Insights and Forecast - By Country/Sub-region
- 13.1.1 China
- 13.1.2 Japan
- 13.1.3 India
- 13.1.4 South Korea
- 13.1.5 Taiwan
- 13.1.6 Australia
- 13.1.7 Rest of Asia-Pacific
- 14. South America Platinum Nanoparticles Market Analysis, Insights and Forecast, 2019-2031
- 14.1. Market Analysis, Insights and Forecast - By Country/Sub-region
- 14.1.1 Brazil
- 14.1.2 Argentina
- 14.1.3 Rest of South America
- 15. MEA Platinum Nanoparticles Market Analysis, Insights and Forecast, 2019-2031
- 15.1. Market Analysis, Insights and Forecast - By Country/Sub-region
- 15.1.1 Middle East
- 15.1.2 Africa
- 16. Competitive Analysis
- 16.1. Global Market Share Analysis 2024
- 16.2. Company Profiles
- 16.2.1 US Research Nanomaterials Inc
- 16.2.1.1. Overview
- 16.2.1.2. Products
- 16.2.1.3. SWOT Analysis
- 16.2.1.4. Recent Developments
- 16.2.1.5. Financials (Based on Availability)
- 16.2.2 Nanoshel LLC
- 16.2.2.1. Overview
- 16.2.2.2. Products
- 16.2.2.3. SWOT Analysis
- 16.2.2.4. Recent Developments
- 16.2.2.5. Financials (Based on Availability)
- 16.2.3 American Elements
- 16.2.3.1. Overview
- 16.2.3.2. Products
- 16.2.3.3. SWOT Analysis
- 16.2.3.4. Recent Developments
- 16.2.3.5. Financials (Based on Availability)
- 16.2.4 Nanocomposix
- 16.2.4.1. Overview
- 16.2.4.2. Products
- 16.2.4.3. SWOT Analysis
- 16.2.4.4. Recent Developments
- 16.2.4.5. Financials (Based on Availability)
- 16.2.5 Sigma-Aldrich
- 16.2.5.1. Overview
- 16.2.5.2. Products
- 16.2.5.3. SWOT Analysis
- 16.2.5.4. Recent Developments
- 16.2.5.5. Financials (Based on Availability)
- 16.2.6 NanoBio Chemicals India Pvt Ltd
- 16.2.6.1. Overview
- 16.2.6.2. Products
- 16.2.6.3. SWOT Analysis
- 16.2.6.4. Recent Developments
- 16.2.6.5. Financials (Based on Availability)
- 16.2.7 TANAKA HOLDINGS Co Ltd
- 16.2.7.1. Overview
- 16.2.7.2. Products
- 16.2.7.3. SWOT Analysis
- 16.2.7.4. Recent Developments
- 16.2.7.5. Financials (Based on Availability)
- 16.2.8 Nanostructured & Amorphous Materials Inc
- 16.2.8.1. Overview
- 16.2.8.2. Products
- 16.2.8.3. SWOT Analysis
- 16.2.8.4. Recent Developments
- 16.2.8.5. Financials (Based on Availability)
- 16.2.9 Metrohm India Limited
- 16.2.9.1. Overview
- 16.2.9.2. Products
- 16.2.9.3. SWOT Analysis
- 16.2.9.4. Recent Developments
- 16.2.9.5. Financials (Based on Availability)
- 16.2.10 HiQ-Nano s r l
- 16.2.10.1. Overview
- 16.2.10.2. Products
- 16.2.10.3. SWOT Analysis
- 16.2.10.4. Recent Developments
- 16.2.10.5. Financials (Based on Availability)
- 16.2.11 Strem Chemicals Inc
- 16.2.11.1. Overview
- 16.2.11.2. Products
- 16.2.11.3. SWOT Analysis
- 16.2.11.4. Recent Developments
- 16.2.11.5. Financials (Based on Availability)
- 16.2.12 PlasmaChem GmbH
- 16.2.12.1. Overview
- 16.2.12.2. Products
- 16.2.12.3. SWOT Analysis
- 16.2.12.4. Recent Developments
- 16.2.12.5. Financials (Based on Availability)
- 16.2.13 Meliorum Technologies Inc
- 16.2.13.1. Overview
- 16.2.13.2. Products
- 16.2.13.3. SWOT Analysis
- 16.2.13.4. Recent Developments
- 16.2.13.5. Financials (Based on Availability)
- 16.2.14 Particular GMBH
- 16.2.14.1. Overview
- 16.2.14.2. Products
- 16.2.14.3. SWOT Analysis
- 16.2.14.4. Recent Developments
- 16.2.14.5. Financials (Based on Availability)
- 16.2.15 NANOCHEMAZONE
- 16.2.15.1. Overview
- 16.2.15.2. Products
- 16.2.15.3. SWOT Analysis
- 16.2.15.4. Recent Developments
- 16.2.15.5. Financials (Based on Availability)
- 16.2.1 US Research Nanomaterials Inc
List of Figures
- Figure 1: Global Platinum Nanoparticles Market Revenue Breakdown (Million, %) by Region 2024 & 2032
- Figure 2: Global Platinum Nanoparticles Market Volume Breakdown (K Tons, %) by Region 2024 & 2032
- Figure 3: North America Platinum Nanoparticles Market Revenue (Million), by Country 2024 & 2032
- Figure 4: North America Platinum Nanoparticles Market Volume (K Tons), by Country 2024 & 2032
- Figure 5: North America Platinum Nanoparticles Market Revenue Share (%), by Country 2024 & 2032
- Figure 6: North America Platinum Nanoparticles Market Volume Share (%), by Country 2024 & 2032
- Figure 7: Europe Platinum Nanoparticles Market Revenue (Million), by Country 2024 & 2032
- Figure 8: Europe Platinum Nanoparticles Market Volume (K Tons), by Country 2024 & 2032
- Figure 9: Europe Platinum Nanoparticles Market Revenue Share (%), by Country 2024 & 2032
- Figure 10: Europe Platinum Nanoparticles Market Volume Share (%), by Country 2024 & 2032
- Figure 11: Asia Pacific Platinum Nanoparticles Market Revenue (Million), by Country 2024 & 2032
- Figure 12: Asia Pacific Platinum Nanoparticles Market Volume (K Tons), by Country 2024 & 2032
- Figure 13: Asia Pacific Platinum Nanoparticles Market Revenue Share (%), by Country 2024 & 2032
- Figure 14: Asia Pacific Platinum Nanoparticles Market Volume Share (%), by Country 2024 & 2032
- Figure 15: South America Platinum Nanoparticles Market Revenue (Million), by Country 2024 & 2032
- Figure 16: South America Platinum Nanoparticles Market Volume (K Tons), by Country 2024 & 2032
- Figure 17: South America Platinum Nanoparticles Market Revenue Share (%), by Country 2024 & 2032
- Figure 18: South America Platinum Nanoparticles Market Volume Share (%), by Country 2024 & 2032
- Figure 19: MEA Platinum Nanoparticles Market Revenue (Million), by Country 2024 & 2032
- Figure 20: MEA Platinum Nanoparticles Market Volume (K Tons), by Country 2024 & 2032
- Figure 21: MEA Platinum Nanoparticles Market Revenue Share (%), by Country 2024 & 2032
- Figure 22: MEA Platinum Nanoparticles Market Volume Share (%), by Country 2024 & 2032
- Figure 23: Asia Pacific Platinum Nanoparticles Market Revenue (Million), by Product 2024 & 2032
- Figure 24: Asia Pacific Platinum Nanoparticles Market Volume (K Tons), by Product 2024 & 2032
- Figure 25: Asia Pacific Platinum Nanoparticles Market Revenue Share (%), by Product 2024 & 2032
- Figure 26: Asia Pacific Platinum Nanoparticles Market Volume Share (%), by Product 2024 & 2032
- Figure 27: Asia Pacific Platinum Nanoparticles Market Revenue (Million), by End-user Industry 2024 & 2032
- Figure 28: Asia Pacific Platinum Nanoparticles Market Volume (K Tons), by End-user Industry 2024 & 2032
- Figure 29: Asia Pacific Platinum Nanoparticles Market Revenue Share (%), by End-user Industry 2024 & 2032
- Figure 30: Asia Pacific Platinum Nanoparticles Market Volume Share (%), by End-user Industry 2024 & 2032
- Figure 31: Asia Pacific Platinum Nanoparticles Market Revenue (Million), by Country 2024 & 2032
- Figure 32: Asia Pacific Platinum Nanoparticles Market Volume (K Tons), by Country 2024 & 2032
- Figure 33: Asia Pacific Platinum Nanoparticles Market Revenue Share (%), by Country 2024 & 2032
- Figure 34: Asia Pacific Platinum Nanoparticles Market Volume Share (%), by Country 2024 & 2032
- Figure 35: North America Platinum Nanoparticles Market Revenue (Million), by Product 2024 & 2032
- Figure 36: North America Platinum Nanoparticles Market Volume (K Tons), by Product 2024 & 2032
- Figure 37: North America Platinum Nanoparticles Market Revenue Share (%), by Product 2024 & 2032
- Figure 38: North America Platinum Nanoparticles Market Volume Share (%), by Product 2024 & 2032
- Figure 39: North America Platinum Nanoparticles Market Revenue (Million), by End-user Industry 2024 & 2032
- Figure 40: North America Platinum Nanoparticles Market Volume (K Tons), by End-user Industry 2024 & 2032
- Figure 41: North America Platinum Nanoparticles Market Revenue Share (%), by End-user Industry 2024 & 2032
- Figure 42: North America Platinum Nanoparticles Market Volume Share (%), by End-user Industry 2024 & 2032
- Figure 43: North America Platinum Nanoparticles Market Revenue (Million), by Country 2024 & 2032
- Figure 44: North America Platinum Nanoparticles Market Volume (K Tons), by Country 2024 & 2032
- Figure 45: North America Platinum Nanoparticles Market Revenue Share (%), by Country 2024 & 2032
- Figure 46: North America Platinum Nanoparticles Market Volume Share (%), by Country 2024 & 2032
- Figure 47: Europe Platinum Nanoparticles Market Revenue (Million), by Product 2024 & 2032
- Figure 48: Europe Platinum Nanoparticles Market Volume (K Tons), by Product 2024 & 2032
- Figure 49: Europe Platinum Nanoparticles Market Revenue Share (%), by Product 2024 & 2032
- Figure 50: Europe Platinum Nanoparticles Market Volume Share (%), by Product 2024 & 2032
- Figure 51: Europe Platinum Nanoparticles Market Revenue (Million), by End-user Industry 2024 & 2032
- Figure 52: Europe Platinum Nanoparticles Market Volume (K Tons), by End-user Industry 2024 & 2032
- Figure 53: Europe Platinum Nanoparticles Market Revenue Share (%), by End-user Industry 2024 & 2032
- Figure 54: Europe Platinum Nanoparticles Market Volume Share (%), by End-user Industry 2024 & 2032
- Figure 55: Europe Platinum Nanoparticles Market Revenue (Million), by Country 2024 & 2032
- Figure 56: Europe Platinum Nanoparticles Market Volume (K Tons), by Country 2024 & 2032
- Figure 57: Europe Platinum Nanoparticles Market Revenue Share (%), by Country 2024 & 2032
- Figure 58: Europe Platinum Nanoparticles Market Volume Share (%), by Country 2024 & 2032
- Figure 59: South America Platinum Nanoparticles Market Revenue (Million), by Product 2024 & 2032
- Figure 60: South America Platinum Nanoparticles Market Volume (K Tons), by Product 2024 & 2032
- Figure 61: South America Platinum Nanoparticles Market Revenue Share (%), by Product 2024 & 2032
- Figure 62: South America Platinum Nanoparticles Market Volume Share (%), by Product 2024 & 2032
- Figure 63: South America Platinum Nanoparticles Market Revenue (Million), by End-user Industry 2024 & 2032
- Figure 64: South America Platinum Nanoparticles Market Volume (K Tons), by End-user Industry 2024 & 2032
- Figure 65: South America Platinum Nanoparticles Market Revenue Share (%), by End-user Industry 2024 & 2032
- Figure 66: South America Platinum Nanoparticles Market Volume Share (%), by End-user Industry 2024 & 2032
- Figure 67: South America Platinum Nanoparticles Market Revenue (Million), by Country 2024 & 2032
- Figure 68: South America Platinum Nanoparticles Market Volume (K Tons), by Country 2024 & 2032
- Figure 69: South America Platinum Nanoparticles Market Revenue Share (%), by Country 2024 & 2032
- Figure 70: South America Platinum Nanoparticles Market Volume Share (%), by Country 2024 & 2032
- Figure 71: Middle East and Africa Platinum Nanoparticles Market Revenue (Million), by Product 2024 & 2032
- Figure 72: Middle East and Africa Platinum Nanoparticles Market Volume (K Tons), by Product 2024 & 2032
- Figure 73: Middle East and Africa Platinum Nanoparticles Market Revenue Share (%), by Product 2024 & 2032
- Figure 74: Middle East and Africa Platinum Nanoparticles Market Volume Share (%), by Product 2024 & 2032
- Figure 75: Middle East and Africa Platinum Nanoparticles Market Revenue (Million), by End-user Industry 2024 & 2032
- Figure 76: Middle East and Africa Platinum Nanoparticles Market Volume (K Tons), by End-user Industry 2024 & 2032
- Figure 77: Middle East and Africa Platinum Nanoparticles Market Revenue Share (%), by End-user Industry 2024 & 2032
- Figure 78: Middle East and Africa Platinum Nanoparticles Market Volume Share (%), by End-user Industry 2024 & 2032
- Figure 79: Middle East and Africa Platinum Nanoparticles Market Revenue (Million), by Country 2024 & 2032
- Figure 80: Middle East and Africa Platinum Nanoparticles Market Volume (K Tons), by Country 2024 & 2032
- Figure 81: Middle East and Africa Platinum Nanoparticles Market Revenue Share (%), by Country 2024 & 2032
- Figure 82: Middle East and Africa Platinum Nanoparticles Market Volume Share (%), by Country 2024 & 2032
List of Tables
- Table 1: Global Platinum Nanoparticles Market Revenue Million Forecast, by Region 2019 & 2032
- Table 2: Global Platinum Nanoparticles Market Volume K Tons Forecast, by Region 2019 & 2032
- Table 3: Global Platinum Nanoparticles Market Revenue Million Forecast, by Product 2019 & 2032
- Table 4: Global Platinum Nanoparticles Market Volume K Tons Forecast, by Product 2019 & 2032
- Table 5: Global Platinum Nanoparticles Market Revenue Million Forecast, by End-user Industry 2019 & 2032
- Table 6: Global Platinum Nanoparticles Market Volume K Tons Forecast, by End-user Industry 2019 & 2032
- Table 7: Global Platinum Nanoparticles Market Revenue Million Forecast, by Region 2019 & 2032
- Table 8: Global Platinum Nanoparticles Market Volume K Tons Forecast, by Region 2019 & 2032
- Table 9: Global Platinum Nanoparticles Market Revenue Million Forecast, by Country 2019 & 2032
- Table 10: Global Platinum Nanoparticles Market Volume K Tons Forecast, by Country 2019 & 2032
- Table 11: United States Platinum Nanoparticles Market Revenue (Million) Forecast, by Application 2019 & 2032
- Table 12: United States Platinum Nanoparticles Market Volume (K Tons) Forecast, by Application 2019 & 2032
- Table 13: Canada Platinum Nanoparticles Market Revenue (Million) Forecast, by Application 2019 & 2032
- Table 14: Canada Platinum Nanoparticles Market Volume (K Tons) Forecast, by Application 2019 & 2032
- Table 15: Mexico Platinum Nanoparticles Market Revenue (Million) Forecast, by Application 2019 & 2032
- Table 16: Mexico Platinum Nanoparticles Market Volume (K Tons) Forecast, by Application 2019 & 2032
- Table 17: Global Platinum Nanoparticles Market Revenue Million Forecast, by Country 2019 & 2032
- Table 18: Global Platinum Nanoparticles Market Volume K Tons Forecast, by Country 2019 & 2032
- Table 19: Germany Platinum Nanoparticles Market Revenue (Million) Forecast, by Application 2019 & 2032
- Table 20: Germany Platinum Nanoparticles Market Volume (K Tons) Forecast, by Application 2019 & 2032
- Table 21: France Platinum Nanoparticles Market Revenue (Million) Forecast, by Application 2019 & 2032
- Table 22: France Platinum Nanoparticles Market Volume (K Tons) Forecast, by Application 2019 & 2032
- Table 23: Italy Platinum Nanoparticles Market Revenue (Million) Forecast, by Application 2019 & 2032
- Table 24: Italy Platinum Nanoparticles Market Volume (K Tons) Forecast, by Application 2019 & 2032
- Table 25: United Kingdom Platinum Nanoparticles Market Revenue (Million) Forecast, by Application 2019 & 2032
- Table 26: United Kingdom Platinum Nanoparticles Market Volume (K Tons) Forecast, by Application 2019 & 2032
- Table 27: Netherlands Platinum Nanoparticles Market Revenue (Million) Forecast, by Application 2019 & 2032
- Table 28: Netherlands Platinum Nanoparticles Market Volume (K Tons) Forecast, by Application 2019 & 2032
- Table 29: Rest of Europe Platinum Nanoparticles Market Revenue (Million) Forecast, by Application 2019 & 2032
- Table 30: Rest of Europe Platinum Nanoparticles Market Volume (K Tons) Forecast, by Application 2019 & 2032
- Table 31: Global Platinum Nanoparticles Market Revenue Million Forecast, by Country 2019 & 2032
- Table 32: Global Platinum Nanoparticles Market Volume K Tons Forecast, by Country 2019 & 2032
- Table 33: China Platinum Nanoparticles Market Revenue (Million) Forecast, by Application 2019 & 2032
- Table 34: China Platinum Nanoparticles Market Volume (K Tons) Forecast, by Application 2019 & 2032
- Table 35: Japan Platinum Nanoparticles Market Revenue (Million) Forecast, by Application 2019 & 2032
- Table 36: Japan Platinum Nanoparticles Market Volume (K Tons) Forecast, by Application 2019 & 2032
- Table 37: India Platinum Nanoparticles Market Revenue (Million) Forecast, by Application 2019 & 2032
- Table 38: India Platinum Nanoparticles Market Volume (K Tons) Forecast, by Application 2019 & 2032
- Table 39: South Korea Platinum Nanoparticles Market Revenue (Million) Forecast, by Application 2019 & 2032
- Table 40: South Korea Platinum Nanoparticles Market Volume (K Tons) Forecast, by Application 2019 & 2032
- Table 41: Taiwan Platinum Nanoparticles Market Revenue (Million) Forecast, by Application 2019 & 2032
- Table 42: Taiwan Platinum Nanoparticles Market Volume (K Tons) Forecast, by Application 2019 & 2032
- Table 43: Australia Platinum Nanoparticles Market Revenue (Million) Forecast, by Application 2019 & 2032
- Table 44: Australia Platinum Nanoparticles Market Volume (K Tons) Forecast, by Application 2019 & 2032
- Table 45: Rest of Asia-Pacific Platinum Nanoparticles Market Revenue (Million) Forecast, by Application 2019 & 2032
- Table 46: Rest of Asia-Pacific Platinum Nanoparticles Market Volume (K Tons) Forecast, by Application 2019 & 2032
- Table 47: Global Platinum Nanoparticles Market Revenue Million Forecast, by Country 2019 & 2032
- Table 48: Global Platinum Nanoparticles Market Volume K Tons Forecast, by Country 2019 & 2032
- Table 49: Brazil Platinum Nanoparticles Market Revenue (Million) Forecast, by Application 2019 & 2032
- Table 50: Brazil Platinum Nanoparticles Market Volume (K Tons) Forecast, by Application 2019 & 2032
- Table 51: Argentina Platinum Nanoparticles Market Revenue (Million) Forecast, by Application 2019 & 2032
- Table 52: Argentina Platinum Nanoparticles Market Volume (K Tons) Forecast, by Application 2019 & 2032
- Table 53: Rest of South America Platinum Nanoparticles Market Revenue (Million) Forecast, by Application 2019 & 2032
- Table 54: Rest of South America Platinum Nanoparticles Market Volume (K Tons) Forecast, by Application 2019 & 2032
- Table 55: Global Platinum Nanoparticles Market Revenue Million Forecast, by Country 2019 & 2032
- Table 56: Global Platinum Nanoparticles Market Volume K Tons Forecast, by Country 2019 & 2032
- Table 57: Middle East Platinum Nanoparticles Market Revenue (Million) Forecast, by Application 2019 & 2032
- Table 58: Middle East Platinum Nanoparticles Market Volume (K Tons) Forecast, by Application 2019 & 2032
- Table 59: Africa Platinum Nanoparticles Market Revenue (Million) Forecast, by Application 2019 & 2032
- Table 60: Africa Platinum Nanoparticles Market Volume (K Tons) Forecast, by Application 2019 & 2032
- Table 61: Global Platinum Nanoparticles Market Revenue Million Forecast, by Product 2019 & 2032
- Table 62: Global Platinum Nanoparticles Market Volume K Tons Forecast, by Product 2019 & 2032
- Table 63: Global Platinum Nanoparticles Market Revenue Million Forecast, by End-user Industry 2019 & 2032
- Table 64: Global Platinum Nanoparticles Market Volume K Tons Forecast, by End-user Industry 2019 & 2032
- Table 65: Global Platinum Nanoparticles Market Revenue Million Forecast, by Country 2019 & 2032
- Table 66: Global Platinum Nanoparticles Market Volume K Tons Forecast, by Country 2019 & 2032
- Table 67: China Platinum Nanoparticles Market Revenue (Million) Forecast, by Application 2019 & 2032
- Table 68: China Platinum Nanoparticles Market Volume (K Tons) Forecast, by Application 2019 & 2032
- Table 69: India Platinum Nanoparticles Market Revenue (Million) Forecast, by Application 2019 & 2032
- Table 70: India Platinum Nanoparticles Market Volume (K Tons) Forecast, by Application 2019 & 2032
- Table 71: Japan Platinum Nanoparticles Market Revenue (Million) Forecast, by Application 2019 & 2032
- Table 72: Japan Platinum Nanoparticles Market Volume (K Tons) Forecast, by Application 2019 & 2032
- Table 73: South Korea Platinum Nanoparticles Market Revenue (Million) Forecast, by Application 2019 & 2032
- Table 74: South Korea Platinum Nanoparticles Market Volume (K Tons) Forecast, by Application 2019 & 2032
- Table 75: Rest of Asia Pacific Platinum Nanoparticles Market Revenue (Million) Forecast, by Application 2019 & 2032
- Table 76: Rest of Asia Pacific Platinum Nanoparticles Market Volume (K Tons) Forecast, by Application 2019 & 2032
- Table 77: Global Platinum Nanoparticles Market Revenue Million Forecast, by Product 2019 & 2032
- Table 78: Global Platinum Nanoparticles Market Volume K Tons Forecast, by Product 2019 & 2032
- Table 79: Global Platinum Nanoparticles Market Revenue Million Forecast, by End-user Industry 2019 & 2032
- Table 80: Global Platinum Nanoparticles Market Volume K Tons Forecast, by End-user Industry 2019 & 2032
- Table 81: Global Platinum Nanoparticles Market Revenue Million Forecast, by Country 2019 & 2032
- Table 82: Global Platinum Nanoparticles Market Volume K Tons Forecast, by Country 2019 & 2032
- Table 83: United States Platinum Nanoparticles Market Revenue (Million) Forecast, by Application 2019 & 2032
- Table 84: United States Platinum Nanoparticles Market Volume (K Tons) Forecast, by Application 2019 & 2032
- Table 85: Canada Platinum Nanoparticles Market Revenue (Million) Forecast, by Application 2019 & 2032
- Table 86: Canada Platinum Nanoparticles Market Volume (K Tons) Forecast, by Application 2019 & 2032
- Table 87: Mexico Platinum Nanoparticles Market Revenue (Million) Forecast, by Application 2019 & 2032
- Table 88: Mexico Platinum Nanoparticles Market Volume (K Tons) Forecast, by Application 2019 & 2032
- Table 89: Global Platinum Nanoparticles Market Revenue Million Forecast, by Product 2019 & 2032
- Table 90: Global Platinum Nanoparticles Market Volume K Tons Forecast, by Product 2019 & 2032
- Table 91: Global Platinum Nanoparticles Market Revenue Million Forecast, by End-user Industry 2019 & 2032
- Table 92: Global Platinum Nanoparticles Market Volume K Tons Forecast, by End-user Industry 2019 & 2032
- Table 93: Global Platinum Nanoparticles Market Revenue Million Forecast, by Country 2019 & 2032
- Table 94: Global Platinum Nanoparticles Market Volume K Tons Forecast, by Country 2019 & 2032
- Table 95: Germany Platinum Nanoparticles Market Revenue (Million) Forecast, by Application 2019 & 2032
- Table 96: Germany Platinum Nanoparticles Market Volume (K Tons) Forecast, by Application 2019 & 2032
- Table 97: United Kingdom Platinum Nanoparticles Market Revenue (Million) Forecast, by Application 2019 & 2032
- Table 98: United Kingdom Platinum Nanoparticles Market Volume (K Tons) Forecast, by Application 2019 & 2032
- Table 99: France Platinum Nanoparticles Market Revenue (Million) Forecast, by Application 2019 & 2032
- Table 100: France Platinum Nanoparticles Market Volume (K Tons) Forecast, by Application 2019 & 2032
- Table 101: Italy Platinum Nanoparticles Market Revenue (Million) Forecast, by Application 2019 & 2032
- Table 102: Italy Platinum Nanoparticles Market Volume (K Tons) Forecast, by Application 2019 & 2032
- Table 103: Rest of Europe Platinum Nanoparticles Market Revenue (Million) Forecast, by Application 2019 & 2032
- Table 104: Rest of Europe Platinum Nanoparticles Market Volume (K Tons) Forecast, by Application 2019 & 2032
- Table 105: Global Platinum Nanoparticles Market Revenue Million Forecast, by Product 2019 & 2032
- Table 106: Global Platinum Nanoparticles Market Volume K Tons Forecast, by Product 2019 & 2032
- Table 107: Global Platinum Nanoparticles Market Revenue Million Forecast, by End-user Industry 2019 & 2032
- Table 108: Global Platinum Nanoparticles Market Volume K Tons Forecast, by End-user Industry 2019 & 2032
- Table 109: Global Platinum Nanoparticles Market Revenue Million Forecast, by Country 2019 & 2032
- Table 110: Global Platinum Nanoparticles Market Volume K Tons Forecast, by Country 2019 & 2032
- Table 111: Brazil Platinum Nanoparticles Market Revenue (Million) Forecast, by Application 2019 & 2032
- Table 112: Brazil Platinum Nanoparticles Market Volume (K Tons) Forecast, by Application 2019 & 2032
- Table 113: Argentina Platinum Nanoparticles Market Revenue (Million) Forecast, by Application 2019 & 2032
- Table 114: Argentina Platinum Nanoparticles Market Volume (K Tons) Forecast, by Application 2019 & 2032
- Table 115: Rest of South America Platinum Nanoparticles Market Revenue (Million) Forecast, by Application 2019 & 2032
- Table 116: Rest of South America Platinum Nanoparticles Market Volume (K Tons) Forecast, by Application 2019 & 2032
- Table 117: Global Platinum Nanoparticles Market Revenue Million Forecast, by Product 2019 & 2032
- Table 118: Global Platinum Nanoparticles Market Volume K Tons Forecast, by Product 2019 & 2032
- Table 119: Global Platinum Nanoparticles Market Revenue Million Forecast, by End-user Industry 2019 & 2032
- Table 120: Global Platinum Nanoparticles Market Volume K Tons Forecast, by End-user Industry 2019 & 2032
- Table 121: Global Platinum Nanoparticles Market Revenue Million Forecast, by Country 2019 & 2032
- Table 122: Global Platinum Nanoparticles Market Volume K Tons Forecast, by Country 2019 & 2032
- Table 123: Saudi Arabia Platinum Nanoparticles Market Revenue (Million) Forecast, by Application 2019 & 2032
- Table 124: Saudi Arabia Platinum Nanoparticles Market Volume (K Tons) Forecast, by Application 2019 & 2032
- Table 125: South Africa Platinum Nanoparticles Market Revenue (Million) Forecast, by Application 2019 & 2032
- Table 126: South Africa Platinum Nanoparticles Market Volume (K Tons) Forecast, by Application 2019 & 2032
- Table 127: Rest of Middle East and Africa Platinum Nanoparticles Market Revenue (Million) Forecast, by Application 2019 & 2032
- Table 128: Rest of Middle East and Africa Platinum Nanoparticles Market Volume (K Tons) Forecast, by Application 2019 & 2032
Frequently Asked Questions
1. What is the projected Compound Annual Growth Rate (CAGR) of the Platinum Nanoparticles Market?
The projected CAGR is approximately 6%.
2. Which companies are prominent players in the Platinum Nanoparticles Market?
Key companies in the market include US Research Nanomaterials Inc, Nanoshel LLC, American Elements, Nanocomposix, Sigma-Aldrich, NanoBio Chemicals India Pvt Ltd, TANAKA HOLDINGS Co Ltd, Nanostructured & Amorphous Materials Inc, Metrohm India Limited, HiQ-Nano s r l, Strem Chemicals Inc, PlasmaChem GmbH, Meliorum Technologies Inc, Particular GMBH, NANOCHEMAZONE.
3. What are the main segments of the Platinum Nanoparticles Market?
The market segments include Product, End-user Industry.
4. Can you provide details about the market size?
The market size is estimated to be USD 283.78 Million as of 2022.
5. What are some drivers contributing to market growth?
; Growing Health Care Industry; Other Drivers.
6. What are the notable trends driving market growth?
Health Care Segment to Dominate the Market.
7. Are there any restraints impacting market growth?
; Toxic Nature of Platinum Nanoparticles; Unfavorable Conditions in Non-medical End-user Industries Arising Due to COVID-19 Outbreak.
8. Can you provide examples of recent developments in the market?
N/A
9. What pricing options are available for accessing the report?
Pricing options include single-user, multi-user, and enterprise licenses priced at USD 4750, USD 5250, and USD 8750 respectively.
10. Is the market size provided in terms of value or volume?
The market size is provided in terms of value, measured in Million and volume, measured in K Tons.
11. Are there any specific market keywords associated with the report?
Yes, the market keyword associated with the report is "Platinum Nanoparticles Market," which aids in identifying and referencing the specific market segment covered.
12. How do I determine which pricing option suits my needs best?
The pricing options vary based on user requirements and access needs. Individual users may opt for single-user licenses, while businesses requiring broader access may choose multi-user or enterprise licenses for cost-effective access to the report.
13. Are there any additional resources or data provided in the Platinum Nanoparticles Market report?
While the report offers comprehensive insights, it's advisable to review the specific contents or supplementary materials provided to ascertain if additional resources or data are available.
14. How can I stay updated on further developments or reports in the Platinum Nanoparticles Market?
To stay informed about further developments, trends, and reports in the Platinum Nanoparticles Market, consider subscribing to industry newsletters, following relevant companies and organizations, or regularly checking reputable industry news sources and publications.
Methodology
Step 1 - Identification of Relevant Samples Size from Population Database


Step 2 - Approaches for Defining Global Market Size (Value, Volume* & Price*)

Note*: In applicable scenarios
Step 3 - Data Sources
Primary Research
- Web Analytics
- Survey Reports
- Research Institute
- Latest Research Reports
- Opinion Leaders
Secondary Research
- Annual Reports
- White Paper
- Latest Press Release
- Industry Association
- Paid Database
- Investor Presentations

Step 4 - Data Triangulation
Involves using different sources of information in order to increase the validity of a study
These sources are likely to be stakeholders in a program - participants, other researchers, program staff, other community members, and so on.
Then we put all data in single framework & apply various statistical tools to find out the dynamic on the market.
During the analysis stage, feedback from the stakeholder groups would be compared to determine areas of agreement as well as areas of divergence


