
Key Insights
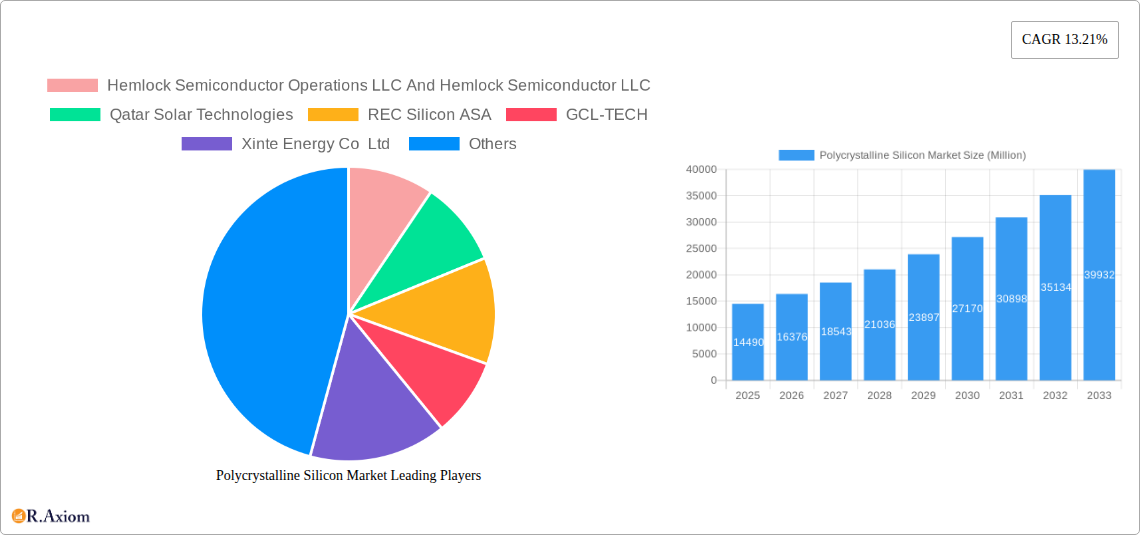
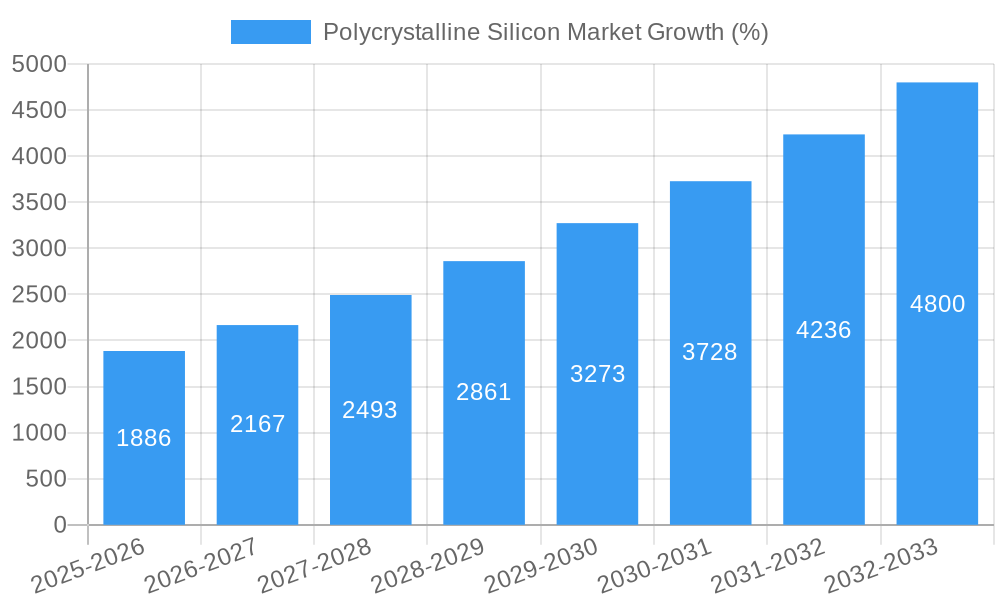
The polycrystalline silicon (polysilicon) market, valued at $14.49 billion in 2025, is experiencing robust growth, projected to expand at a Compound Annual Growth Rate (CAGR) of 13.21% from 2025 to 2033. This significant expansion is driven primarily by the burgeoning solar photovoltaic (PV) industry's increasing demand for polysilicon as a crucial raw material in solar panel manufacturing. The rising global adoption of renewable energy sources, coupled with supportive government policies and incentives aimed at reducing carbon emissions, fuels this market's growth trajectory. Furthermore, technological advancements leading to improved polysilicon production efficiency and reduced costs contribute to increased market accessibility and wider adoption. Key players such as Hemlock Semiconductor, REC Silicon, and GCL-TECH are actively investing in research and development to enhance product quality and expand production capacities, further solidifying the market's positive outlook.
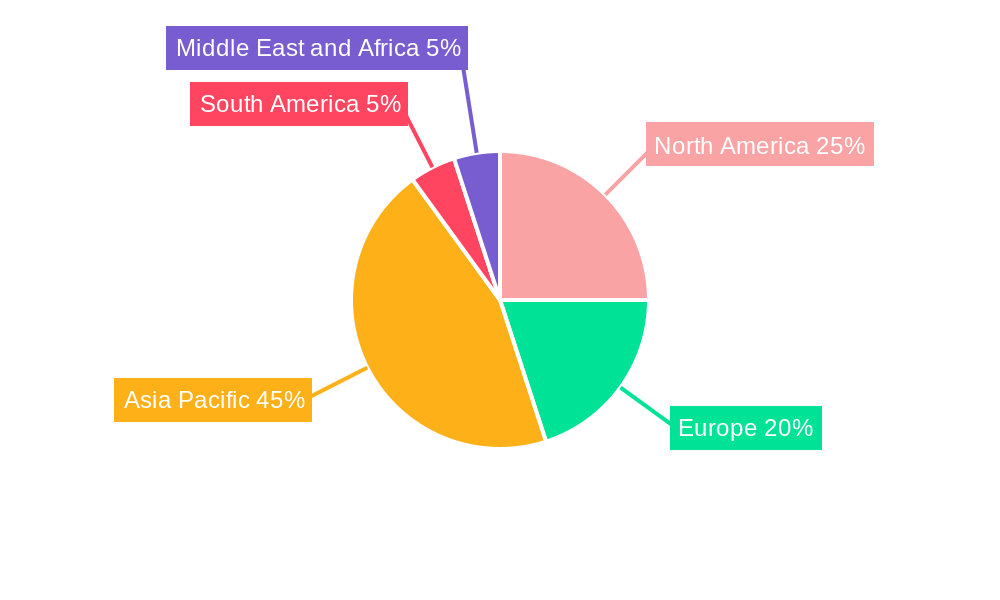
Geographic distribution shows a concentration of market share in the Asia-Pacific region, particularly in China, India, Japan, and South Korea, owing to the region's substantial solar energy deployment and strong manufacturing base. North America and Europe also hold significant market positions, reflecting the growing emphasis on renewable energy in these regions. However, factors such as fluctuating raw material prices and the potential for disruptions in the global supply chain pose challenges to consistent market growth. Despite these constraints, the long-term outlook remains positive, driven by the persistent global shift toward renewable energy sources and the continued expansion of the solar PV industry. The market segmentation highlights the significant role of the electronics and semiconductor industries beyond solar PV, suggesting a diversified and resilient market structure.
Polycrystalline Silicon Market: A Comprehensive Report (2019-2033)
This in-depth report provides a comprehensive analysis of the polycrystalline silicon market, covering the historical period (2019-2024), base year (2025), and forecast period (2025-2033). It delves into market dynamics, competitive landscape, technological advancements, and emerging trends, offering invaluable insights for industry stakeholders, investors, and strategic decision-makers. The report leverages extensive primary and secondary research, incorporating data from reputable sources and expert analysis to deliver actionable intelligence. Market values are expressed in Millions.
Polycrystalline Silicon Market Market Concentration & Innovation
The polycrystalline silicon market exhibits a moderately concentrated structure, with several major players holding significant market share. While precise figures for market share are proprietary data, key players like Hemlock Semiconductor, OCI Company Ltd, and REC Silicon ASA collectively account for a substantial portion of global production. This concentration is influenced by the capital-intensive nature of polysilicon manufacturing and the significant technological barriers to entry.
Innovation in the polycrystalline silicon market is driven by the relentless pursuit of higher efficiencies and lower production costs in solar photovoltaic (PV) applications. This is evident in ongoing research and development efforts focused on improving silicon purity, refining production processes, and exploring alternative manufacturing methods. Stringent environmental regulations further incentivize innovation toward more sustainable and less energy-intensive production techniques. The landscape is also shaped by mergers and acquisitions (M&A) activities, with deal values in recent years ranging from USD xx Million to over USD 1.2 Billion (as seen in the OCI Company Ltd-Hanwha Solutions deal). These M&A activities frequently aim to consolidate market share, access new technologies, or expand geographic reach. Product substitution is minimal, as polycrystalline silicon remains the dominant material in many solar PV applications, although monocrystalline silicon is gaining traction. End-user trends heavily favor the renewable energy sector, primarily solar PV, driving significant demand for polycrystalline silicon.
- Key Players: Hemlock Semiconductor, OCI Company Ltd, REC Silicon ASA, GCL-TECH, and others.
- Innovation Drivers: Higher efficiency, lower costs, sustainable production, and environmental regulations.
- M&A Activity: Significant activity observed, with deal values ranging from USD xx Million to over USD 1.2 Billion.
Polycrystalline Silicon Market Industry Trends & Insights
The polycrystalline silicon market is experiencing robust growth, fueled by the expanding global demand for renewable energy solutions. The compound annual growth rate (CAGR) for the forecast period (2025-2033) is estimated to be xx%. This growth is largely driven by the increasing adoption of solar PV technology worldwide, particularly in emerging economies with high solar irradiance. Technological advancements, such as improved production techniques and higher purity silicon, are contributing to enhanced efficiency and reduced costs, further boosting market demand. Consumer preference for environmentally friendly energy sources is a key driver, with governments worldwide implementing supportive policies and incentives to promote the adoption of renewable energy. However, the market faces challenges, including fluctuating silicon prices, geopolitical factors affecting supply chains, and competition from alternative energy technologies. Market penetration of polycrystalline silicon in solar PV continues to be high, though the share is gradually shifting towards monocrystalline silicon. Despite this, the polycrystalline silicon market retains a significant presence driven by its cost-effectiveness. Competitive dynamics are characterized by intense price competition and continuous efforts to improve production efficiency and quality.
Dominant Markets & Segments in Polycrystalline Silicon Market
The Asia-Pacific region dominates the polycrystalline silicon market, driven by factors such as large-scale solar PV installations in China and India. These countries' supportive government policies, extensive infrastructure development in renewable energy, and robust economic growth have propelled the market's expansion.
- Key Drivers in Asia-Pacific:
- Significant government investments in renewable energy infrastructure.
- High solar irradiance levels.
- Large-scale solar projects in China and India.
- Cost-competitive manufacturing capabilities.
The solar PV segment constitutes the largest end-user industry for polycrystalline silicon, accounting for approximately xx% of the total market. The electronics (semiconductor) segment also utilizes polycrystalline silicon, but its contribution is relatively smaller.
Polycrystalline Silicon Market Product Developments
Recent product developments focus on enhancing silicon purity, improving crystal quality, and optimizing production processes to achieve higher yields and reduced costs. New technologies are being explored to improve the efficiency and lifespan of solar cells and reduce manufacturing energy consumption, aligning with sustainability goals. These advancements are vital for maintaining polycrystalline silicon's competitive edge in the solar PV market.
Report Scope & Segmentation Analysis
This report segments the polycrystalline silicon market by end-user industry (Solar PV, Electronics) and geographic region. The Solar PV segment holds a significantly larger market share compared to the Electronics segment. Growth projections for both segments are positive, driven by the global push for renewable energy and the continued demand for semiconductor materials. Competitive dynamics vary across regions and segments, reflecting the different levels of market concentration and technological advancement.
- Solar PV Segment: This segment is expected to experience a CAGR of xx% over the forecast period (2025-2033), driven primarily by the growing adoption of solar energy.
- Electronics Segment: This segment exhibits moderate growth, with a projected CAGR of xx%, influenced by the steady demand for semiconductor components in various electronic devices.
Key Drivers of Polycrystalline Silicon Market Growth
The growth of the polycrystalline silicon market is driven by several key factors, including the increasing global demand for renewable energy, particularly solar power. Government incentives and supportive policies promoting solar energy adoption play a critical role. Technological advancements leading to improved efficiency and reduced costs of polycrystalline silicon production further fuel market expansion. The growing awareness of climate change and the need for sustainable energy solutions are also contributing factors.
Challenges in the Polycrystalline Silicon Market Sector
The polycrystalline silicon market faces several challenges, including fluctuating raw material prices, potential supply chain disruptions due to geopolitical factors, and intense competition from other solar technologies (monocrystalline silicon). Stringent environmental regulations can increase production costs.
Emerging Opportunities in Polycrystalline Silicon Market
Emerging opportunities lie in the development of more efficient and sustainable polycrystalline silicon production methods. Expansion into new markets, particularly in developing economies, presents significant growth potential. Innovations in solar cell technology that enhance the performance of polycrystalline silicon could drive future market expansion.
Leading Players in the Polycrystalline Silicon Market Market
- Hemlock Semiconductor Operations LLC And Hemlock Semiconductor LLC
- Qatar Solar Technologies
- REC Silicon ASA
- GCL-TECH
- Xinte Energy Co Ltd
- Tokuyama Corporation
- Asia Silicon (Qinghai) Co Ltd
- Daqo New Energy Co Ltd
- Sichuan Yongxiang Co Ltd (Tongwei)
- OCI Company Ltd
- Wacker Chemie AG
- Mitsubishi Polycrystalline Silicon America Corporation
Key Developments in Polycrystalline Silicon Market Industry
- August 2022: REC Silicon ASA and Mississippi Silicon collaborated to develop a solar supply chain in the United States, aiming to boost domestic solar energy production.
- April 2022: OCI Company Ltd secured a USD 1.2 billion polysilicon supply contract with Hanwha Solutions, significantly boosting its revenue and market position.
Strategic Outlook for Polycrystalline Silicon Market Market
The polycrystalline silicon market is poised for continued growth, driven by the global transition towards renewable energy. Technological advancements, along with supportive government policies and increasing consumer demand for sustainable energy solutions, present significant opportunities for market expansion. Companies focused on innovation, efficiency improvements, and strategic partnerships are well-positioned to capitalize on this growth potential.
Polycrystalline Silicon Market Segmentation
-
1. End-user Industry
-
1.1. Solar PV
- 1.1.1. Monocrystalline Solar Panel
- 1.1.2. Multicrystalline Solar Panel
- 1.2. Electronics (Semiconductor)
-
1.1. Solar PV
Polycrystalline Silicon Market Segmentation By Geography
-
1. Asia Pacific
- 1.1. China
- 1.2. India
- 1.3. Japan
- 1.4. South Korea
- 1.5. Rest of Asia Pacific
-
2. North America
- 2.1. United States
- 2.2. Canada
- 2.3. Mexico
-
3. Europe
- 3.1. Germany
- 3.2. United Kingdom
- 3.3. Italy
- 3.4. France
- 3.5. Rest of Europe
-
4. South America
- 4.1. Brazil
- 4.2. Argentina
- 4.3. Rest of South America
-
5. Middle East and Africa
- 5.1. Saudi Arabia
- 5.2. South Africa
- 5.3. Rest of Middle East and Africa
Polycrystalline Silicon Market REPORT HIGHLIGHTS
| Aspects | Details |
|---|---|
| Study Period | 2019-2033 |
| Base Year | 2024 |
| Estimated Year | 2025 |
| Forecast Period | 2025-2033 |
| Historical Period | 2019-2024 |
| Growth Rate | CAGR of 13.21% from 2019-2033 |
| Segmentation |
|
Table of Contents
- 1. Introduction
- 1.1. Research Scope
- 1.2. Market Segmentation
- 1.3. Research Methodology
- 1.4. Definitions and Assumptions
- 2. Executive Summary
- 2.1. Introduction
- 3. Market Dynamics
- 3.1. Introduction
- 3.2. Market Drivers
- 3.2.1. Increasing Number of Solar PV Installation; Growth in the Semiconductor Industry
- 3.3. Market Restrains
- 3.3.1 Emerging Competitors
- 3.3.2 such as Upgraded Metallurgical-grade Silicon (UMG-Si) Solar Cell; High Capital Expenditure
- 3.4. Market Trends
- 3.4.1. Growing Demand from the Solar PV Industry
- 4. Market Factor Analysis
- 4.1. Porters Five Forces
- 4.2. Supply/Value Chain
- 4.3. PESTEL analysis
- 4.4. Market Entropy
- 4.5. Patent/Trademark Analysis
- 5. Global Polycrystalline Silicon Market Analysis, Insights and Forecast, 2019-2031
- 5.1. Market Analysis, Insights and Forecast - by End-user Industry
- 5.1.1. Solar PV
- 5.1.1.1. Monocrystalline Solar Panel
- 5.1.1.2. Multicrystalline Solar Panel
- 5.1.2. Electronics (Semiconductor)
- 5.1.1. Solar PV
- 5.2. Market Analysis, Insights and Forecast - by Region
- 5.2.1. Asia Pacific
- 5.2.2. North America
- 5.2.3. Europe
- 5.2.4. South America
- 5.2.5. Middle East and Africa
- 5.1. Market Analysis, Insights and Forecast - by End-user Industry
- 6. Asia Pacific Polycrystalline Silicon Market Analysis, Insights and Forecast, 2019-2031
- 6.1. Market Analysis, Insights and Forecast - by End-user Industry
- 6.1.1. Solar PV
- 6.1.1.1. Monocrystalline Solar Panel
- 6.1.1.2. Multicrystalline Solar Panel
- 6.1.2. Electronics (Semiconductor)
- 6.1.1. Solar PV
- 6.1. Market Analysis, Insights and Forecast - by End-user Industry
- 7. North America Polycrystalline Silicon Market Analysis, Insights and Forecast, 2019-2031
- 7.1. Market Analysis, Insights and Forecast - by End-user Industry
- 7.1.1. Solar PV
- 7.1.1.1. Monocrystalline Solar Panel
- 7.1.1.2. Multicrystalline Solar Panel
- 7.1.2. Electronics (Semiconductor)
- 7.1.1. Solar PV
- 7.1. Market Analysis, Insights and Forecast - by End-user Industry
- 8. Europe Polycrystalline Silicon Market Analysis, Insights and Forecast, 2019-2031
- 8.1. Market Analysis, Insights and Forecast - by End-user Industry
- 8.1.1. Solar PV
- 8.1.1.1. Monocrystalline Solar Panel
- 8.1.1.2. Multicrystalline Solar Panel
- 8.1.2. Electronics (Semiconductor)
- 8.1.1. Solar PV
- 8.1. Market Analysis, Insights and Forecast - by End-user Industry
- 9. South America Polycrystalline Silicon Market Analysis, Insights and Forecast, 2019-2031
- 9.1. Market Analysis, Insights and Forecast - by End-user Industry
- 9.1.1. Solar PV
- 9.1.1.1. Monocrystalline Solar Panel
- 9.1.1.2. Multicrystalline Solar Panel
- 9.1.2. Electronics (Semiconductor)
- 9.1.1. Solar PV
- 9.1. Market Analysis, Insights and Forecast - by End-user Industry
- 10. Middle East and Africa Polycrystalline Silicon Market Analysis, Insights and Forecast, 2019-2031
- 10.1. Market Analysis, Insights and Forecast - by End-user Industry
- 10.1.1. Solar PV
- 10.1.1.1. Monocrystalline Solar Panel
- 10.1.1.2. Multicrystalline Solar Panel
- 10.1.2. Electronics (Semiconductor)
- 10.1.1. Solar PV
- 10.1. Market Analysis, Insights and Forecast - by End-user Industry
- 11. Asia Pacific Polycrystalline Silicon Market Analysis, Insights and Forecast, 2019-2031
- 11.1. Market Analysis, Insights and Forecast - By Country/Sub-region
- 11.1.1 China
- 11.1.2 India
- 11.1.3 Japan
- 11.1.4 South Korea
- 11.1.5 Rest of Asia Pacific
- 12. North America Polycrystalline Silicon Market Analysis, Insights and Forecast, 2019-2031
- 12.1. Market Analysis, Insights and Forecast - By Country/Sub-region
- 12.1.1 United States
- 12.1.2 Canada
- 12.1.3 Mexico
- 13. Europe Polycrystalline Silicon Market Analysis, Insights and Forecast, 2019-2031
- 13.1. Market Analysis, Insights and Forecast - By Country/Sub-region
- 13.1.1 Germany
- 13.1.2 United Kingdom
- 13.1.3 Italy
- 13.1.4 France
- 13.1.5 Rest of Europe
- 14. South America Polycrystalline Silicon Market Analysis, Insights and Forecast, 2019-2031
- 14.1. Market Analysis, Insights and Forecast - By Country/Sub-region
- 14.1.1 Brazil
- 14.1.2 Argentina
- 14.1.3 Rest of South America
- 15. Middle East and Africa Polycrystalline Silicon Market Analysis, Insights and Forecast, 2019-2031
- 15.1. Market Analysis, Insights and Forecast - By Country/Sub-region
- 15.1.1 Saudi Arabia
- 15.1.2 South Africa
- 15.1.3 Rest of Middle East and Africa
- 16. Competitive Analysis
- 16.1. Global Market Share Analysis 2024
- 16.2. Company Profiles
- 16.2.1 Hemlock Semiconductor Operations LLC And Hemlock Semiconductor LLC
- 16.2.1.1. Overview
- 16.2.1.2. Products
- 16.2.1.3. SWOT Analysis
- 16.2.1.4. Recent Developments
- 16.2.1.5. Financials (Based on Availability)
- 16.2.2 Qatar Solar Technologies
- 16.2.2.1. Overview
- 16.2.2.2. Products
- 16.2.2.3. SWOT Analysis
- 16.2.2.4. Recent Developments
- 16.2.2.5. Financials (Based on Availability)
- 16.2.3 REC Silicon ASA
- 16.2.3.1. Overview
- 16.2.3.2. Products
- 16.2.3.3. SWOT Analysis
- 16.2.3.4. Recent Developments
- 16.2.3.5. Financials (Based on Availability)
- 16.2.4 GCL-TECH
- 16.2.4.1. Overview
- 16.2.4.2. Products
- 16.2.4.3. SWOT Analysis
- 16.2.4.4. Recent Developments
- 16.2.4.5. Financials (Based on Availability)
- 16.2.5 Xinte Energy Co Ltd
- 16.2.5.1. Overview
- 16.2.5.2. Products
- 16.2.5.3. SWOT Analysis
- 16.2.5.4. Recent Developments
- 16.2.5.5. Financials (Based on Availability)
- 16.2.6 Tokuyama Corporation
- 16.2.6.1. Overview
- 16.2.6.2. Products
- 16.2.6.3. SWOT Analysis
- 16.2.6.4. Recent Developments
- 16.2.6.5. Financials (Based on Availability)
- 16.2.7 Asia Silicon (Qinghai) Co Ltd
- 16.2.7.1. Overview
- 16.2.7.2. Products
- 16.2.7.3. SWOT Analysis
- 16.2.7.4. Recent Developments
- 16.2.7.5. Financials (Based on Availability)
- 16.2.8 Daqo New Energy Co Ltd
- 16.2.8.1. Overview
- 16.2.8.2. Products
- 16.2.8.3. SWOT Analysis
- 16.2.8.4. Recent Developments
- 16.2.8.5. Financials (Based on Availability)
- 16.2.9 Sichuan Yongxiang Co Ltd (Tongwei)
- 16.2.9.1. Overview
- 16.2.9.2. Products
- 16.2.9.3. SWOT Analysis
- 16.2.9.4. Recent Developments
- 16.2.9.5. Financials (Based on Availability)
- 16.2.10 OCI Company Ltd
- 16.2.10.1. Overview
- 16.2.10.2. Products
- 16.2.10.3. SWOT Analysis
- 16.2.10.4. Recent Developments
- 16.2.10.5. Financials (Based on Availability)
- 16.2.11 Wacker Chemie AG
- 16.2.11.1. Overview
- 16.2.11.2. Products
- 16.2.11.3. SWOT Analysis
- 16.2.11.4. Recent Developments
- 16.2.11.5. Financials (Based on Availability)
- 16.2.12 Mitsubishi Polycrystalline Silicon America Corporation
- 16.2.12.1. Overview
- 16.2.12.2. Products
- 16.2.12.3. SWOT Analysis
- 16.2.12.4. Recent Developments
- 16.2.12.5. Financials (Based on Availability)
- 16.2.1 Hemlock Semiconductor Operations LLC And Hemlock Semiconductor LLC
List of Figures
- Figure 1: Global Polycrystalline Silicon Market Revenue Breakdown (Million, %) by Region 2024 & 2032
- Figure 2: Global Polycrystalline Silicon Market Volume Breakdown (K Tons, %) by Region 2024 & 2032
- Figure 3: Asia Pacific Polycrystalline Silicon Market Revenue (Million), by Country 2024 & 2032
- Figure 4: Asia Pacific Polycrystalline Silicon Market Volume (K Tons), by Country 2024 & 2032
- Figure 5: Asia Pacific Polycrystalline Silicon Market Revenue Share (%), by Country 2024 & 2032
- Figure 6: Asia Pacific Polycrystalline Silicon Market Volume Share (%), by Country 2024 & 2032
- Figure 7: North America Polycrystalline Silicon Market Revenue (Million), by Country 2024 & 2032
- Figure 8: North America Polycrystalline Silicon Market Volume (K Tons), by Country 2024 & 2032
- Figure 9: North America Polycrystalline Silicon Market Revenue Share (%), by Country 2024 & 2032
- Figure 10: North America Polycrystalline Silicon Market Volume Share (%), by Country 2024 & 2032
- Figure 11: Europe Polycrystalline Silicon Market Revenue (Million), by Country 2024 & 2032
- Figure 12: Europe Polycrystalline Silicon Market Volume (K Tons), by Country 2024 & 2032
- Figure 13: Europe Polycrystalline Silicon Market Revenue Share (%), by Country 2024 & 2032
- Figure 14: Europe Polycrystalline Silicon Market Volume Share (%), by Country 2024 & 2032
- Figure 15: South America Polycrystalline Silicon Market Revenue (Million), by Country 2024 & 2032
- Figure 16: South America Polycrystalline Silicon Market Volume (K Tons), by Country 2024 & 2032
- Figure 17: South America Polycrystalline Silicon Market Revenue Share (%), by Country 2024 & 2032
- Figure 18: South America Polycrystalline Silicon Market Volume Share (%), by Country 2024 & 2032
- Figure 19: Middle East and Africa Polycrystalline Silicon Market Revenue (Million), by Country 2024 & 2032
- Figure 20: Middle East and Africa Polycrystalline Silicon Market Volume (K Tons), by Country 2024 & 2032
- Figure 21: Middle East and Africa Polycrystalline Silicon Market Revenue Share (%), by Country 2024 & 2032
- Figure 22: Middle East and Africa Polycrystalline Silicon Market Volume Share (%), by Country 2024 & 2032
- Figure 23: Asia Pacific Polycrystalline Silicon Market Revenue (Million), by End-user Industry 2024 & 2032
- Figure 24: Asia Pacific Polycrystalline Silicon Market Volume (K Tons), by End-user Industry 2024 & 2032
- Figure 25: Asia Pacific Polycrystalline Silicon Market Revenue Share (%), by End-user Industry 2024 & 2032
- Figure 26: Asia Pacific Polycrystalline Silicon Market Volume Share (%), by End-user Industry 2024 & 2032
- Figure 27: Asia Pacific Polycrystalline Silicon Market Revenue (Million), by Country 2024 & 2032
- Figure 28: Asia Pacific Polycrystalline Silicon Market Volume (K Tons), by Country 2024 & 2032
- Figure 29: Asia Pacific Polycrystalline Silicon Market Revenue Share (%), by Country 2024 & 2032
- Figure 30: Asia Pacific Polycrystalline Silicon Market Volume Share (%), by Country 2024 & 2032
- Figure 31: North America Polycrystalline Silicon Market Revenue (Million), by End-user Industry 2024 & 2032
- Figure 32: North America Polycrystalline Silicon Market Volume (K Tons), by End-user Industry 2024 & 2032
- Figure 33: North America Polycrystalline Silicon Market Revenue Share (%), by End-user Industry 2024 & 2032
- Figure 34: North America Polycrystalline Silicon Market Volume Share (%), by End-user Industry 2024 & 2032
- Figure 35: North America Polycrystalline Silicon Market Revenue (Million), by Country 2024 & 2032
- Figure 36: North America Polycrystalline Silicon Market Volume (K Tons), by Country 2024 & 2032
- Figure 37: North America Polycrystalline Silicon Market Revenue Share (%), by Country 2024 & 2032
- Figure 38: North America Polycrystalline Silicon Market Volume Share (%), by Country 2024 & 2032
- Figure 39: Europe Polycrystalline Silicon Market Revenue (Million), by End-user Industry 2024 & 2032
- Figure 40: Europe Polycrystalline Silicon Market Volume (K Tons), by End-user Industry 2024 & 2032
- Figure 41: Europe Polycrystalline Silicon Market Revenue Share (%), by End-user Industry 2024 & 2032
- Figure 42: Europe Polycrystalline Silicon Market Volume Share (%), by End-user Industry 2024 & 2032
- Figure 43: Europe Polycrystalline Silicon Market Revenue (Million), by Country 2024 & 2032
- Figure 44: Europe Polycrystalline Silicon Market Volume (K Tons), by Country 2024 & 2032
- Figure 45: Europe Polycrystalline Silicon Market Revenue Share (%), by Country 2024 & 2032
- Figure 46: Europe Polycrystalline Silicon Market Volume Share (%), by Country 2024 & 2032
- Figure 47: South America Polycrystalline Silicon Market Revenue (Million), by End-user Industry 2024 & 2032
- Figure 48: South America Polycrystalline Silicon Market Volume (K Tons), by End-user Industry 2024 & 2032
- Figure 49: South America Polycrystalline Silicon Market Revenue Share (%), by End-user Industry 2024 & 2032
- Figure 50: South America Polycrystalline Silicon Market Volume Share (%), by End-user Industry 2024 & 2032
- Figure 51: South America Polycrystalline Silicon Market Revenue (Million), by Country 2024 & 2032
- Figure 52: South America Polycrystalline Silicon Market Volume (K Tons), by Country 2024 & 2032
- Figure 53: South America Polycrystalline Silicon Market Revenue Share (%), by Country 2024 & 2032
- Figure 54: South America Polycrystalline Silicon Market Volume Share (%), by Country 2024 & 2032
- Figure 55: Middle East and Africa Polycrystalline Silicon Market Revenue (Million), by End-user Industry 2024 & 2032
- Figure 56: Middle East and Africa Polycrystalline Silicon Market Volume (K Tons), by End-user Industry 2024 & 2032
- Figure 57: Middle East and Africa Polycrystalline Silicon Market Revenue Share (%), by End-user Industry 2024 & 2032
- Figure 58: Middle East and Africa Polycrystalline Silicon Market Volume Share (%), by End-user Industry 2024 & 2032
- Figure 59: Middle East and Africa Polycrystalline Silicon Market Revenue (Million), by Country 2024 & 2032
- Figure 60: Middle East and Africa Polycrystalline Silicon Market Volume (K Tons), by Country 2024 & 2032
- Figure 61: Middle East and Africa Polycrystalline Silicon Market Revenue Share (%), by Country 2024 & 2032
- Figure 62: Middle East and Africa Polycrystalline Silicon Market Volume Share (%), by Country 2024 & 2032
List of Tables
- Table 1: Global Polycrystalline Silicon Market Revenue Million Forecast, by Region 2019 & 2032
- Table 2: Global Polycrystalline Silicon Market Volume K Tons Forecast, by Region 2019 & 2032
- Table 3: Global Polycrystalline Silicon Market Revenue Million Forecast, by End-user Industry 2019 & 2032
- Table 4: Global Polycrystalline Silicon Market Volume K Tons Forecast, by End-user Industry 2019 & 2032
- Table 5: Global Polycrystalline Silicon Market Revenue Million Forecast, by Region 2019 & 2032
- Table 6: Global Polycrystalline Silicon Market Volume K Tons Forecast, by Region 2019 & 2032
- Table 7: Global Polycrystalline Silicon Market Revenue Million Forecast, by Country 2019 & 2032
- Table 8: Global Polycrystalline Silicon Market Volume K Tons Forecast, by Country 2019 & 2032
- Table 9: China Polycrystalline Silicon Market Revenue (Million) Forecast, by Application 2019 & 2032
- Table 10: China Polycrystalline Silicon Market Volume (K Tons) Forecast, by Application 2019 & 2032
- Table 11: India Polycrystalline Silicon Market Revenue (Million) Forecast, by Application 2019 & 2032
- Table 12: India Polycrystalline Silicon Market Volume (K Tons) Forecast, by Application 2019 & 2032
- Table 13: Japan Polycrystalline Silicon Market Revenue (Million) Forecast, by Application 2019 & 2032
- Table 14: Japan Polycrystalline Silicon Market Volume (K Tons) Forecast, by Application 2019 & 2032
- Table 15: South Korea Polycrystalline Silicon Market Revenue (Million) Forecast, by Application 2019 & 2032
- Table 16: South Korea Polycrystalline Silicon Market Volume (K Tons) Forecast, by Application 2019 & 2032
- Table 17: Rest of Asia Pacific Polycrystalline Silicon Market Revenue (Million) Forecast, by Application 2019 & 2032
- Table 18: Rest of Asia Pacific Polycrystalline Silicon Market Volume (K Tons) Forecast, by Application 2019 & 2032
- Table 19: Global Polycrystalline Silicon Market Revenue Million Forecast, by Country 2019 & 2032
- Table 20: Global Polycrystalline Silicon Market Volume K Tons Forecast, by Country 2019 & 2032
- Table 21: United States Polycrystalline Silicon Market Revenue (Million) Forecast, by Application 2019 & 2032
- Table 22: United States Polycrystalline Silicon Market Volume (K Tons) Forecast, by Application 2019 & 2032
- Table 23: Canada Polycrystalline Silicon Market Revenue (Million) Forecast, by Application 2019 & 2032
- Table 24: Canada Polycrystalline Silicon Market Volume (K Tons) Forecast, by Application 2019 & 2032
- Table 25: Mexico Polycrystalline Silicon Market Revenue (Million) Forecast, by Application 2019 & 2032
- Table 26: Mexico Polycrystalline Silicon Market Volume (K Tons) Forecast, by Application 2019 & 2032
- Table 27: Global Polycrystalline Silicon Market Revenue Million Forecast, by Country 2019 & 2032
- Table 28: Global Polycrystalline Silicon Market Volume K Tons Forecast, by Country 2019 & 2032
- Table 29: Germany Polycrystalline Silicon Market Revenue (Million) Forecast, by Application 2019 & 2032
- Table 30: Germany Polycrystalline Silicon Market Volume (K Tons) Forecast, by Application 2019 & 2032
- Table 31: United Kingdom Polycrystalline Silicon Market Revenue (Million) Forecast, by Application 2019 & 2032
- Table 32: United Kingdom Polycrystalline Silicon Market Volume (K Tons) Forecast, by Application 2019 & 2032
- Table 33: Italy Polycrystalline Silicon Market Revenue (Million) Forecast, by Application 2019 & 2032
- Table 34: Italy Polycrystalline Silicon Market Volume (K Tons) Forecast, by Application 2019 & 2032
- Table 35: France Polycrystalline Silicon Market Revenue (Million) Forecast, by Application 2019 & 2032
- Table 36: France Polycrystalline Silicon Market Volume (K Tons) Forecast, by Application 2019 & 2032
- Table 37: Rest of Europe Polycrystalline Silicon Market Revenue (Million) Forecast, by Application 2019 & 2032
- Table 38: Rest of Europe Polycrystalline Silicon Market Volume (K Tons) Forecast, by Application 2019 & 2032
- Table 39: Global Polycrystalline Silicon Market Revenue Million Forecast, by Country 2019 & 2032
- Table 40: Global Polycrystalline Silicon Market Volume K Tons Forecast, by Country 2019 & 2032
- Table 41: Brazil Polycrystalline Silicon Market Revenue (Million) Forecast, by Application 2019 & 2032
- Table 42: Brazil Polycrystalline Silicon Market Volume (K Tons) Forecast, by Application 2019 & 2032
- Table 43: Argentina Polycrystalline Silicon Market Revenue (Million) Forecast, by Application 2019 & 2032
- Table 44: Argentina Polycrystalline Silicon Market Volume (K Tons) Forecast, by Application 2019 & 2032
- Table 45: Rest of South America Polycrystalline Silicon Market Revenue (Million) Forecast, by Application 2019 & 2032
- Table 46: Rest of South America Polycrystalline Silicon Market Volume (K Tons) Forecast, by Application 2019 & 2032
- Table 47: Global Polycrystalline Silicon Market Revenue Million Forecast, by Country 2019 & 2032
- Table 48: Global Polycrystalline Silicon Market Volume K Tons Forecast, by Country 2019 & 2032
- Table 49: Saudi Arabia Polycrystalline Silicon Market Revenue (Million) Forecast, by Application 2019 & 2032
- Table 50: Saudi Arabia Polycrystalline Silicon Market Volume (K Tons) Forecast, by Application 2019 & 2032
- Table 51: South Africa Polycrystalline Silicon Market Revenue (Million) Forecast, by Application 2019 & 2032
- Table 52: South Africa Polycrystalline Silicon Market Volume (K Tons) Forecast, by Application 2019 & 2032
- Table 53: Rest of Middle East and Africa Polycrystalline Silicon Market Revenue (Million) Forecast, by Application 2019 & 2032
- Table 54: Rest of Middle East and Africa Polycrystalline Silicon Market Volume (K Tons) Forecast, by Application 2019 & 2032
- Table 55: Global Polycrystalline Silicon Market Revenue Million Forecast, by End-user Industry 2019 & 2032
- Table 56: Global Polycrystalline Silicon Market Volume K Tons Forecast, by End-user Industry 2019 & 2032
- Table 57: Global Polycrystalline Silicon Market Revenue Million Forecast, by Country 2019 & 2032
- Table 58: Global Polycrystalline Silicon Market Volume K Tons Forecast, by Country 2019 & 2032
- Table 59: China Polycrystalline Silicon Market Revenue (Million) Forecast, by Application 2019 & 2032
- Table 60: China Polycrystalline Silicon Market Volume (K Tons) Forecast, by Application 2019 & 2032
- Table 61: India Polycrystalline Silicon Market Revenue (Million) Forecast, by Application 2019 & 2032
- Table 62: India Polycrystalline Silicon Market Volume (K Tons) Forecast, by Application 2019 & 2032
- Table 63: Japan Polycrystalline Silicon Market Revenue (Million) Forecast, by Application 2019 & 2032
- Table 64: Japan Polycrystalline Silicon Market Volume (K Tons) Forecast, by Application 2019 & 2032
- Table 65: South Korea Polycrystalline Silicon Market Revenue (Million) Forecast, by Application 2019 & 2032
- Table 66: South Korea Polycrystalline Silicon Market Volume (K Tons) Forecast, by Application 2019 & 2032
- Table 67: Rest of Asia Pacific Polycrystalline Silicon Market Revenue (Million) Forecast, by Application 2019 & 2032
- Table 68: Rest of Asia Pacific Polycrystalline Silicon Market Volume (K Tons) Forecast, by Application 2019 & 2032
- Table 69: Global Polycrystalline Silicon Market Revenue Million Forecast, by End-user Industry 2019 & 2032
- Table 70: Global Polycrystalline Silicon Market Volume K Tons Forecast, by End-user Industry 2019 & 2032
- Table 71: Global Polycrystalline Silicon Market Revenue Million Forecast, by Country 2019 & 2032
- Table 72: Global Polycrystalline Silicon Market Volume K Tons Forecast, by Country 2019 & 2032
- Table 73: United States Polycrystalline Silicon Market Revenue (Million) Forecast, by Application 2019 & 2032
- Table 74: United States Polycrystalline Silicon Market Volume (K Tons) Forecast, by Application 2019 & 2032
- Table 75: Canada Polycrystalline Silicon Market Revenue (Million) Forecast, by Application 2019 & 2032
- Table 76: Canada Polycrystalline Silicon Market Volume (K Tons) Forecast, by Application 2019 & 2032
- Table 77: Mexico Polycrystalline Silicon Market Revenue (Million) Forecast, by Application 2019 & 2032
- Table 78: Mexico Polycrystalline Silicon Market Volume (K Tons) Forecast, by Application 2019 & 2032
- Table 79: Global Polycrystalline Silicon Market Revenue Million Forecast, by End-user Industry 2019 & 2032
- Table 80: Global Polycrystalline Silicon Market Volume K Tons Forecast, by End-user Industry 2019 & 2032
- Table 81: Global Polycrystalline Silicon Market Revenue Million Forecast, by Country 2019 & 2032
- Table 82: Global Polycrystalline Silicon Market Volume K Tons Forecast, by Country 2019 & 2032
- Table 83: Germany Polycrystalline Silicon Market Revenue (Million) Forecast, by Application 2019 & 2032
- Table 84: Germany Polycrystalline Silicon Market Volume (K Tons) Forecast, by Application 2019 & 2032
- Table 85: United Kingdom Polycrystalline Silicon Market Revenue (Million) Forecast, by Application 2019 & 2032
- Table 86: United Kingdom Polycrystalline Silicon Market Volume (K Tons) Forecast, by Application 2019 & 2032
- Table 87: Italy Polycrystalline Silicon Market Revenue (Million) Forecast, by Application 2019 & 2032
- Table 88: Italy Polycrystalline Silicon Market Volume (K Tons) Forecast, by Application 2019 & 2032
- Table 89: France Polycrystalline Silicon Market Revenue (Million) Forecast, by Application 2019 & 2032
- Table 90: France Polycrystalline Silicon Market Volume (K Tons) Forecast, by Application 2019 & 2032
- Table 91: Rest of Europe Polycrystalline Silicon Market Revenue (Million) Forecast, by Application 2019 & 2032
- Table 92: Rest of Europe Polycrystalline Silicon Market Volume (K Tons) Forecast, by Application 2019 & 2032
- Table 93: Global Polycrystalline Silicon Market Revenue Million Forecast, by End-user Industry 2019 & 2032
- Table 94: Global Polycrystalline Silicon Market Volume K Tons Forecast, by End-user Industry 2019 & 2032
- Table 95: Global Polycrystalline Silicon Market Revenue Million Forecast, by Country 2019 & 2032
- Table 96: Global Polycrystalline Silicon Market Volume K Tons Forecast, by Country 2019 & 2032
- Table 97: Brazil Polycrystalline Silicon Market Revenue (Million) Forecast, by Application 2019 & 2032
- Table 98: Brazil Polycrystalline Silicon Market Volume (K Tons) Forecast, by Application 2019 & 2032
- Table 99: Argentina Polycrystalline Silicon Market Revenue (Million) Forecast, by Application 2019 & 2032
- Table 100: Argentina Polycrystalline Silicon Market Volume (K Tons) Forecast, by Application 2019 & 2032
- Table 101: Rest of South America Polycrystalline Silicon Market Revenue (Million) Forecast, by Application 2019 & 2032
- Table 102: Rest of South America Polycrystalline Silicon Market Volume (K Tons) Forecast, by Application 2019 & 2032
- Table 103: Global Polycrystalline Silicon Market Revenue Million Forecast, by End-user Industry 2019 & 2032
- Table 104: Global Polycrystalline Silicon Market Volume K Tons Forecast, by End-user Industry 2019 & 2032
- Table 105: Global Polycrystalline Silicon Market Revenue Million Forecast, by Country 2019 & 2032
- Table 106: Global Polycrystalline Silicon Market Volume K Tons Forecast, by Country 2019 & 2032
- Table 107: Saudi Arabia Polycrystalline Silicon Market Revenue (Million) Forecast, by Application 2019 & 2032
- Table 108: Saudi Arabia Polycrystalline Silicon Market Volume (K Tons) Forecast, by Application 2019 & 2032
- Table 109: South Africa Polycrystalline Silicon Market Revenue (Million) Forecast, by Application 2019 & 2032
- Table 110: South Africa Polycrystalline Silicon Market Volume (K Tons) Forecast, by Application 2019 & 2032
- Table 111: Rest of Middle East and Africa Polycrystalline Silicon Market Revenue (Million) Forecast, by Application 2019 & 2032
- Table 112: Rest of Middle East and Africa Polycrystalline Silicon Market Volume (K Tons) Forecast, by Application 2019 & 2032
Frequently Asked Questions
1. What is the projected Compound Annual Growth Rate (CAGR) of the Polycrystalline Silicon Market?
The projected CAGR is approximately 13.21%.
2. Which companies are prominent players in the Polycrystalline Silicon Market?
Key companies in the market include Hemlock Semiconductor Operations LLC And Hemlock Semiconductor LLC, Qatar Solar Technologies, REC Silicon ASA, GCL-TECH, Xinte Energy Co Ltd , Tokuyama Corporation, Asia Silicon (Qinghai) Co Ltd, Daqo New Energy Co Ltd, Sichuan Yongxiang Co Ltd (Tongwei), OCI Company Ltd, Wacker Chemie AG, Mitsubishi Polycrystalline Silicon America Corporation.
3. What are the main segments of the Polycrystalline Silicon Market?
The market segments include End-user Industry.
4. Can you provide details about the market size?
The market size is estimated to be USD 14.49 Million as of 2022.
5. What are some drivers contributing to market growth?
Increasing Number of Solar PV Installation; Growth in the Semiconductor Industry.
6. What are the notable trends driving market growth?
Growing Demand from the Solar PV Industry.
7. Are there any restraints impacting market growth?
Emerging Competitors. such as Upgraded Metallurgical-grade Silicon (UMG-Si) Solar Cell; High Capital Expenditure.
8. Can you provide examples of recent developments in the market?
August 2022: REC Silicon ASA and Mississippi Silicon collaborated to develop a solar supply chain in the United States. They plan to develop this solar supply chain from raw silicon to polysilicon and finally to fully assembled modules.
9. What pricing options are available for accessing the report?
Pricing options include single-user, multi-user, and enterprise licenses priced at USD 4750, USD 5250, and USD 8750 respectively.
10. Is the market size provided in terms of value or volume?
The market size is provided in terms of value, measured in Million and volume, measured in K Tons.
11. Are there any specific market keywords associated with the report?
Yes, the market keyword associated with the report is "Polycrystalline Silicon Market," which aids in identifying and referencing the specific market segment covered.
12. How do I determine which pricing option suits my needs best?
The pricing options vary based on user requirements and access needs. Individual users may opt for single-user licenses, while businesses requiring broader access may choose multi-user or enterprise licenses for cost-effective access to the report.
13. Are there any additional resources or data provided in the Polycrystalline Silicon Market report?
While the report offers comprehensive insights, it's advisable to review the specific contents or supplementary materials provided to ascertain if additional resources or data are available.
14. How can I stay updated on further developments or reports in the Polycrystalline Silicon Market?
To stay informed about further developments, trends, and reports in the Polycrystalline Silicon Market, consider subscribing to industry newsletters, following relevant companies and organizations, or regularly checking reputable industry news sources and publications.
Methodology
Step 1 - Identification of Relevant Samples Size from Population Database


Step 2 - Approaches for Defining Global Market Size (Value, Volume* & Price*)

Note*: In applicable scenarios
Step 3 - Data Sources
Primary Research
- Web Analytics
- Survey Reports
- Research Institute
- Latest Research Reports
- Opinion Leaders
Secondary Research
- Annual Reports
- White Paper
- Latest Press Release
- Industry Association
- Paid Database
- Investor Presentations

Step 4 - Data Triangulation
Involves using different sources of information in order to increase the validity of a study
These sources are likely to be stakeholders in a program - participants, other researchers, program staff, other community members, and so on.
Then we put all data in single framework & apply various statistical tools to find out the dynamic on the market.
During the analysis stage, feedback from the stakeholder groups would be compared to determine areas of agreement as well as areas of divergence


