
Key Insights
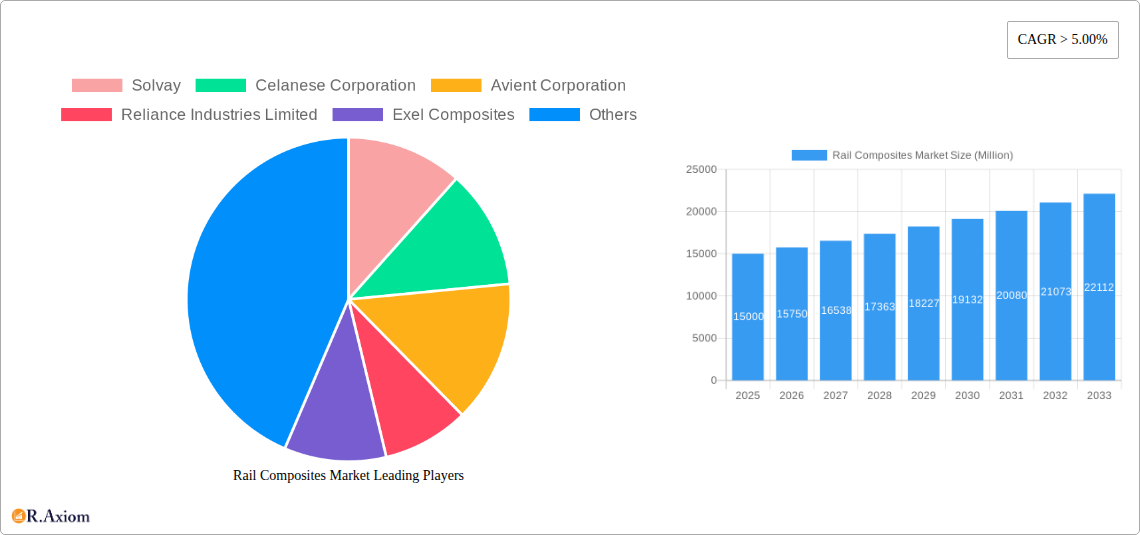
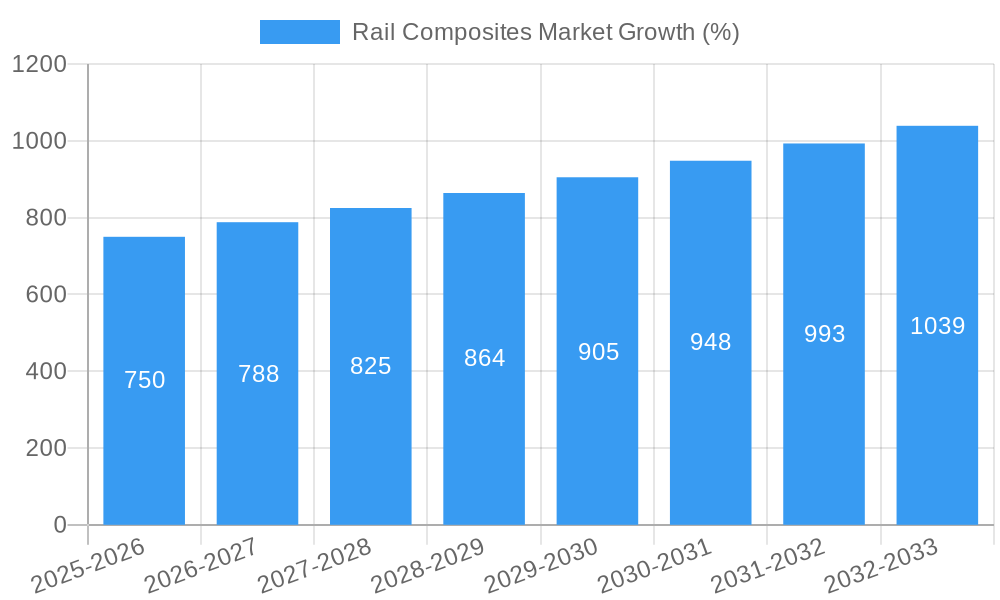
The global rail composites market is experiencing robust growth, driven by the increasing demand for lightweight, high-strength, and corrosion-resistant materials in rail vehicle manufacturing. A compound annual growth rate (CAGR) exceeding 5% from 2019 to 2033 indicates a significant expansion, projected to reach a substantial market size. This growth is fueled by several factors: the rising adoption of composite materials to improve fuel efficiency and reduce overall weight in trains, buses, and other rail vehicles; stringent government regulations promoting sustainable transportation solutions; and ongoing advancements in composite material technology leading to enhanced performance and durability. Key segments within the market include epoxy, polyester, and phenolic resins, alongside glass and carbon fibers, each catering to specific application requirements in both exterior and interior rail components. Leading players like Solvay, Celanese, and BASF are actively involved in developing innovative composite solutions, driving market competitiveness and innovation. Geographical distribution showcases strong growth across North America, Europe, and Asia-Pacific, reflecting the significant investments in rail infrastructure modernization and expansion projects worldwide.
The market's growth is further supported by the increasing adoption of high-speed rail systems, which necessitate lightweight and durable materials to withstand high speeds and vibrations. While challenges such as the relatively higher cost of composite materials compared to traditional alternatives and the need for specialized manufacturing processes exist, these are being mitigated by continuous technological advancements and economies of scale. The diverse applications of rail composites—ranging from car bodies and bogies to interior fittings—contribute to the overall market expansion. Future growth will likely be influenced by technological breakthroughs in fiber-reinforced polymers, the development of more sustainable manufacturing processes, and government policies promoting the adoption of eco-friendly materials in the transportation sector. Regional variations in market growth are expected to depend on factors such as infrastructure investment levels and the pace of technological adoption in different regions.
Rail Composites Market: A Comprehensive Analysis (2019-2033)
This in-depth report provides a comprehensive analysis of the global Rail Composites Market, offering valuable insights into market dynamics, growth drivers, challenges, and future opportunities. Covering the period from 2019 to 2033, with 2025 as the base year, this report equips stakeholders with actionable intelligence to navigate the evolving landscape of this dynamic sector. The market is segmented by resin type (Epoxy, Polyester, Phenolic, Vinyl Ester, Other Resin Types), fiber type (Glass Fiber, Carbon Fiber, Other Fiber Types), and application (Exterior, Interior). Key players analyzed include Solvay, Celanese Corporation, Avient Corporation, Reliance Industries Limited, Exel Composites, LANXESS, BASF SE, Kineco Limited, Toray Industries Inc, Hexcel Corporation, Gurit, TEIJIN LIMITED, and Mitsubishi Chemical Advanced Materials. The estimated market size in 2025 is xx Million, with a projected Compound Annual Growth Rate (CAGR) of xx% during the forecast period (2025-2033).
Rail Composites Market Market Concentration & Innovation
The Rail Composites Market exhibits a moderately concentrated landscape, with a few major players holding significant market share. Market share data for 2024 reveals that the top five players account for approximately xx% of the global market. Innovation is a key driver, with companies continually developing lighter, stronger, and more cost-effective composite materials to meet the stringent demands of the rail industry. Regulatory frameworks, particularly those focused on sustainability and safety, are increasingly influencing material selection and manufacturing processes. The market also sees competition from alternative materials like steel and aluminum, while ongoing mergers and acquisitions (M&A) activity shapes the competitive dynamics. For instance, the total value of M&A deals in the sector between 2020 and 2024 reached approximately xx Million.
- Market Concentration: Top 5 players hold xx% market share in 2024.
- Innovation Drivers: Lightweighting, enhanced strength, cost reduction, sustainability initiatives.
- Regulatory Frameworks: Stringent safety and environmental regulations influence material choices.
- Product Substitutes: Steel and aluminum remain significant competitors.
- M&A Activity: Total M&A deal value (2020-2024): xx Million.
- End-User Trends: Increasing demand for high-speed rail and improved passenger comfort.
Rail Composites Market Industry Trends & Insights
The Rail Composites Market is experiencing robust growth, driven by several key factors. The increasing demand for lightweight, high-performance materials in rail vehicles is a primary growth driver. Technological advancements in composite materials, including the development of advanced fiber types and resin systems, are further boosting market expansion. Consumer preferences for enhanced safety, comfort, and fuel efficiency are also playing a crucial role. The competitive landscape is characterized by intense competition among major players, leading to continuous innovation and product differentiation. The market penetration of composite materials in the rail sector is steadily increasing, with a projected penetration rate of xx% by 2033. The CAGR for the market during the forecast period is estimated at xx%. Specific trends include the growing adoption of long-fiber thermoplastic (LFT) composites and the increasing use of recycled materials in composite manufacturing.
Dominant Markets & Segments in Rail Composites Market
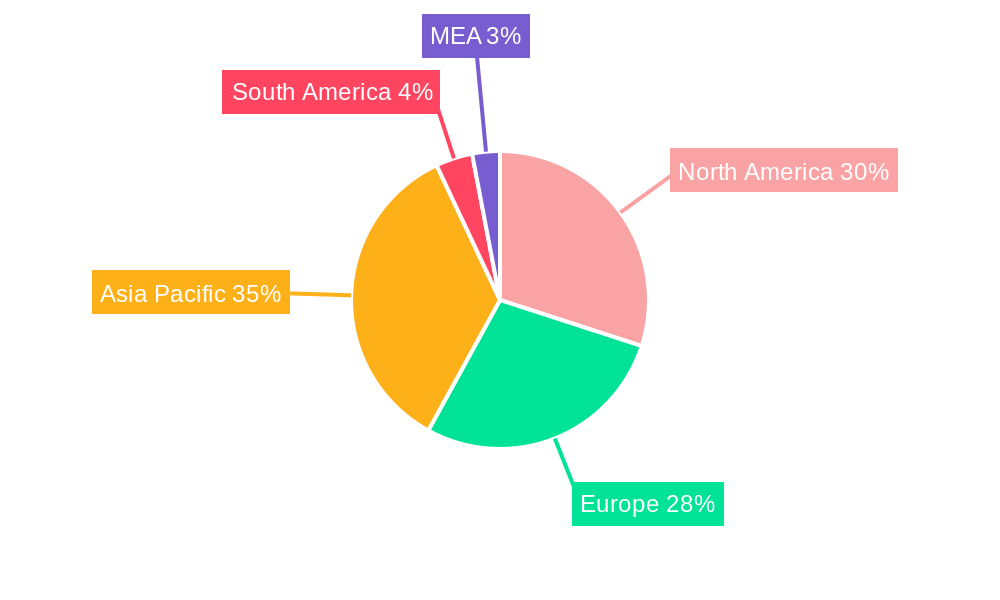
The Rail Composites Market exhibits regional variations in dominance. Currently, [Leading Region, e.g., Europe/North America] holds the largest market share, driven by factors such as robust rail infrastructure development and stringent environmental regulations. Within this region, [Leading Country, e.g., Germany/USA] is a key market.
- Resin Type: Epoxy resins dominate the market due to their superior mechanical properties and adhesion characteristics.
- Fiber Type: Glass fiber remains the most widely used fiber type due to its cost-effectiveness and adequate performance characteristics. However, carbon fiber is gaining traction in high-performance applications.
- Application: The exterior application segment holds a larger share than the interior segment, primarily due to the need for robust and weather-resistant materials in external components.
Key Drivers:
- Economic Policies: Government initiatives promoting sustainable transportation and infrastructure development.
- Infrastructure Development: Expansion of high-speed rail networks and modernization of existing rail infrastructure.
Rail Composites Market Product Developments
Recent innovations in rail composites focus on enhanced performance characteristics and reduced manufacturing costs. New resin systems offer improved durability and fire resistance, while advanced fiber architectures provide greater strength and stiffness. These developments cater to the evolving needs of the rail industry, offering lightweight solutions that enhance fuel efficiency and passenger safety. Companies are also focusing on developing sustainable and recyclable composite materials to address growing environmental concerns.
Report Scope & Segmentation Analysis
This report comprehensively analyzes the Rail Composites Market across various segments:
Resin Type: Epoxy, Polyester, Phenolic, Vinyl Ester, and Other Resin Types. Each segment's growth is projected based on material properties, cost, and application suitability.
Fiber Type: Glass Fiber, Carbon Fiber, and Other Fiber Types. Market size and growth are assessed based on fiber strength, cost, and application-specific needs.
Application: Exterior and Interior. The segmentation analyzes the usage of composites based on component location and required performance characteristics. Each segment shows growth projections, market sizes, and competitive dynamics.
Key Drivers of Rail Composites Market Growth
Several factors are propelling the growth of the Rail Composites Market. Technological advancements in composite materials lead to enhanced performance and cost-effectiveness. Government initiatives supporting sustainable transportation infrastructure development are also driving demand. Furthermore, the increasing demand for lightweight and fuel-efficient rail vehicles is boosting market growth.
Challenges in the Rail Composites Market Sector
The Rail Composites Market faces several challenges. High initial investment costs associated with composite manufacturing can hinder adoption. Supply chain disruptions and fluctuations in raw material prices pose a risk. Intense competition among established players and emerging manufacturers also presents a challenge.
Emerging Opportunities in Rail Composites Market
The Rail Composites Market presents several exciting opportunities. The growing adoption of lightweighting strategies across the rail industry offers significant market potential. Emerging technologies like 3D printing for composite manufacturing are creating new avenues for innovation. The increasing focus on sustainability and recyclability is driving demand for eco-friendly composite materials.
Leading Players in the Rail Composites Market Market
- Solvay
- Celanese Corporation
- Avient Corporation
- Reliance Industries Limited
- Exel Composites
- LANXESS
- BASF SE
- Kineco Limited
- Toray Industries Inc
- Hexcel Corporation
- Gurit
- TEIJIN LIMITED
- Mitsubishi Chemical Advanced Materials
Key Developments in Rail Composites Market Industry
- May 2021: Celanese announces a three-year plan to expand its LFT capacity in Nanjing, China, expected to be completed by the second half of 2023. This expansion significantly increases the supply of a key composite material for the rail industry, potentially impacting pricing and availability.
Strategic Outlook for Rail Composites Market Market
The Rail Composites Market is poised for substantial growth, driven by technological advancements, increasing demand for lightweight and high-performance materials, and supportive government policies. Continued innovation in material science and manufacturing processes will be crucial for sustained market expansion. Companies that can effectively address sustainability concerns and optimize their supply chains will be well-positioned to capitalize on emerging opportunities in this dynamic market.
Rail Composites Market Segmentation
-
1. Resin Type
- 1.1. Epoxy
- 1.2. Polyester
- 1.3. Phenolic
- 1.4. Vinyl Ester
- 1.5. Other Resin Types
-
2. Fiber Type
- 2.1. Glass Fiber
- 2.2. Carbon Fiber
- 2.3. Other Fiber Types
-
3. Application
- 3.1. Exterior
- 3.2. Interior
Rail Composites Market Segmentation By Geography
-
1. Asia Pacific
- 1.1. China
- 1.2. India
- 1.3. Japan
- 1.4. South Korea
- 1.5. Rest of Asia Pacific
-
2. North America
- 2.1. United States
- 2.2. Canada
- 2.3. Mexico
-
3. Europe
- 3.1. Germany
- 3.2. United Kingdom
- 3.3. Italy
- 3.4. France
- 3.5. Rest of Europe
- 4. Rest of the World
Rail Composites Market REPORT HIGHLIGHTS
| Aspects | Details |
|---|---|
| Study Period | 2019-2033 |
| Base Year | 2024 |
| Estimated Year | 2025 |
| Forecast Period | 2025-2033 |
| Historical Period | 2019-2024 |
| Growth Rate | CAGR of > 5.00% from 2019-2033 |
| Segmentation |
|
Table of Contents
- 1. Introduction
- 1.1. Research Scope
- 1.2. Market Segmentation
- 1.3. Research Methodology
- 1.4. Definitions and Assumptions
- 2. Executive Summary
- 2.1. Introduction
- 3. Market Dynamics
- 3.1. Introduction
- 3.2. Market Drivers
- 3.2.1. Increasing Railway Projects in the Asia-Pacific Region; Rapidly Increasing Demand for High-speed Rail
- 3.3. Market Restrains
- 3.3.1 Lack of Railway Infrastructure in Vietnam
- 3.3.2 Indonesia
- 3.3.3 and Thailand; Restrictions on Composite Materials for Railway Application
- 3.4. Market Trends
- 3.4.1. Exterior Application to Dominate the Market
- 4. Market Factor Analysis
- 4.1. Porters Five Forces
- 4.2. Supply/Value Chain
- 4.3. PESTEL analysis
- 4.4. Market Entropy
- 4.5. Patent/Trademark Analysis
- 5. Global Rail Composites Market Analysis, Insights and Forecast, 2019-2031
- 5.1. Market Analysis, Insights and Forecast - by Resin Type
- 5.1.1. Epoxy
- 5.1.2. Polyester
- 5.1.3. Phenolic
- 5.1.4. Vinyl Ester
- 5.1.5. Other Resin Types
- 5.2. Market Analysis, Insights and Forecast - by Fiber Type
- 5.2.1. Glass Fiber
- 5.2.2. Carbon Fiber
- 5.2.3. Other Fiber Types
- 5.3. Market Analysis, Insights and Forecast - by Application
- 5.3.1. Exterior
- 5.3.2. Interior
- 5.4. Market Analysis, Insights and Forecast - by Region
- 5.4.1. Asia Pacific
- 5.4.2. North America
- 5.4.3. Europe
- 5.4.4. Rest of the World
- 5.1. Market Analysis, Insights and Forecast - by Resin Type
- 6. Asia Pacific Rail Composites Market Analysis, Insights and Forecast, 2019-2031
- 6.1. Market Analysis, Insights and Forecast - by Resin Type
- 6.1.1. Epoxy
- 6.1.2. Polyester
- 6.1.3. Phenolic
- 6.1.4. Vinyl Ester
- 6.1.5. Other Resin Types
- 6.2. Market Analysis, Insights and Forecast - by Fiber Type
- 6.2.1. Glass Fiber
- 6.2.2. Carbon Fiber
- 6.2.3. Other Fiber Types
- 6.3. Market Analysis, Insights and Forecast - by Application
- 6.3.1. Exterior
- 6.3.2. Interior
- 6.1. Market Analysis, Insights and Forecast - by Resin Type
- 7. North America Rail Composites Market Analysis, Insights and Forecast, 2019-2031
- 7.1. Market Analysis, Insights and Forecast - by Resin Type
- 7.1.1. Epoxy
- 7.1.2. Polyester
- 7.1.3. Phenolic
- 7.1.4. Vinyl Ester
- 7.1.5. Other Resin Types
- 7.2. Market Analysis, Insights and Forecast - by Fiber Type
- 7.2.1. Glass Fiber
- 7.2.2. Carbon Fiber
- 7.2.3. Other Fiber Types
- 7.3. Market Analysis, Insights and Forecast - by Application
- 7.3.1. Exterior
- 7.3.2. Interior
- 7.1. Market Analysis, Insights and Forecast - by Resin Type
- 8. Europe Rail Composites Market Analysis, Insights and Forecast, 2019-2031
- 8.1. Market Analysis, Insights and Forecast - by Resin Type
- 8.1.1. Epoxy
- 8.1.2. Polyester
- 8.1.3. Phenolic
- 8.1.4. Vinyl Ester
- 8.1.5. Other Resin Types
- 8.2. Market Analysis, Insights and Forecast - by Fiber Type
- 8.2.1. Glass Fiber
- 8.2.2. Carbon Fiber
- 8.2.3. Other Fiber Types
- 8.3. Market Analysis, Insights and Forecast - by Application
- 8.3.1. Exterior
- 8.3.2. Interior
- 8.1. Market Analysis, Insights and Forecast - by Resin Type
- 9. Rest of the World Rail Composites Market Analysis, Insights and Forecast, 2019-2031
- 9.1. Market Analysis, Insights and Forecast - by Resin Type
- 9.1.1. Epoxy
- 9.1.2. Polyester
- 9.1.3. Phenolic
- 9.1.4. Vinyl Ester
- 9.1.5. Other Resin Types
- 9.2. Market Analysis, Insights and Forecast - by Fiber Type
- 9.2.1. Glass Fiber
- 9.2.2. Carbon Fiber
- 9.2.3. Other Fiber Types
- 9.3. Market Analysis, Insights and Forecast - by Application
- 9.3.1. Exterior
- 9.3.2. Interior
- 9.1. Market Analysis, Insights and Forecast - by Resin Type
- 10. North America Rail Composites Market Analysis, Insights and Forecast, 2019-2031
- 10.1. Market Analysis, Insights and Forecast - By Country/Sub-region
- 10.1.1 United States
- 10.1.2 Canada
- 10.1.3 Mexico
- 11. Europe Rail Composites Market Analysis, Insights and Forecast, 2019-2031
- 11.1. Market Analysis, Insights and Forecast - By Country/Sub-region
- 11.1.1 Germany
- 11.1.2 United Kingdom
- 11.1.3 France
- 11.1.4 Spain
- 11.1.5 Italy
- 11.1.6 Spain
- 11.1.7 Belgium
- 11.1.8 Netherland
- 11.1.9 Nordics
- 11.1.10 Rest of Europe
- 12. Asia Pacific Rail Composites Market Analysis, Insights and Forecast, 2019-2031
- 12.1. Market Analysis, Insights and Forecast - By Country/Sub-region
- 12.1.1 China
- 12.1.2 Japan
- 12.1.3 India
- 12.1.4 South Korea
- 12.1.5 Southeast Asia
- 12.1.6 Australia
- 12.1.7 Indonesia
- 12.1.8 Phillipes
- 12.1.9 Singapore
- 12.1.10 Thailandc
- 12.1.11 Rest of Asia Pacific
- 13. South America Rail Composites Market Analysis, Insights and Forecast, 2019-2031
- 13.1. Market Analysis, Insights and Forecast - By Country/Sub-region
- 13.1.1 Brazil
- 13.1.2 Argentina
- 13.1.3 Peru
- 13.1.4 Chile
- 13.1.5 Colombia
- 13.1.6 Ecuador
- 13.1.7 Venezuela
- 13.1.8 Rest of South America
- 14. North America Rail Composites Market Analysis, Insights and Forecast, 2019-2031
- 14.1. Market Analysis, Insights and Forecast - By Country/Sub-region
- 14.1.1 United States
- 14.1.2 Canada
- 14.1.3 Mexico
- 15. MEA Rail Composites Market Analysis, Insights and Forecast, 2019-2031
- 15.1. Market Analysis, Insights and Forecast - By Country/Sub-region
- 15.1.1 United Arab Emirates
- 15.1.2 Saudi Arabia
- 15.1.3 South Africa
- 15.1.4 Rest of Middle East and Africa
- 16. Competitive Analysis
- 16.1. Global Market Share Analysis 2024
- 16.2. Company Profiles
- 16.2.1 Solvay
- 16.2.1.1. Overview
- 16.2.1.2. Products
- 16.2.1.3. SWOT Analysis
- 16.2.1.4. Recent Developments
- 16.2.1.5. Financials (Based on Availability)
- 16.2.2 Celanese Corporation
- 16.2.2.1. Overview
- 16.2.2.2. Products
- 16.2.2.3. SWOT Analysis
- 16.2.2.4. Recent Developments
- 16.2.2.5. Financials (Based on Availability)
- 16.2.3 Avient Corporation
- 16.2.3.1. Overview
- 16.2.3.2. Products
- 16.2.3.3. SWOT Analysis
- 16.2.3.4. Recent Developments
- 16.2.3.5. Financials (Based on Availability)
- 16.2.4 Reliance Industries Limited
- 16.2.4.1. Overview
- 16.2.4.2. Products
- 16.2.4.3. SWOT Analysis
- 16.2.4.4. Recent Developments
- 16.2.4.5. Financials (Based on Availability)
- 16.2.5 Exel Composites
- 16.2.5.1. Overview
- 16.2.5.2. Products
- 16.2.5.3. SWOT Analysis
- 16.2.5.4. Recent Developments
- 16.2.5.5. Financials (Based on Availability)
- 16.2.6 LANXESS
- 16.2.6.1. Overview
- 16.2.6.2. Products
- 16.2.6.3. SWOT Analysis
- 16.2.6.4. Recent Developments
- 16.2.6.5. Financials (Based on Availability)
- 16.2.7 BASF SE
- 16.2.7.1. Overview
- 16.2.7.2. Products
- 16.2.7.3. SWOT Analysis
- 16.2.7.4. Recent Developments
- 16.2.7.5. Financials (Based on Availability)
- 16.2.8 Kineco Limited
- 16.2.8.1. Overview
- 16.2.8.2. Products
- 16.2.8.3. SWOT Analysis
- 16.2.8.4. Recent Developments
- 16.2.8.5. Financials (Based on Availability)
- 16.2.9 Toray Industries Inc
- 16.2.9.1. Overview
- 16.2.9.2. Products
- 16.2.9.3. SWOT Analysis
- 16.2.9.4. Recent Developments
- 16.2.9.5. Financials (Based on Availability)
- 16.2.10 Hexcel Corporation
- 16.2.10.1. Overview
- 16.2.10.2. Products
- 16.2.10.3. SWOT Analysis
- 16.2.10.4. Recent Developments
- 16.2.10.5. Financials (Based on Availability)
- 16.2.11 Gurit
- 16.2.11.1. Overview
- 16.2.11.2. Products
- 16.2.11.3. SWOT Analysis
- 16.2.11.4. Recent Developments
- 16.2.11.5. Financials (Based on Availability)
- 16.2.12 TEIJIN LIMITED
- 16.2.12.1. Overview
- 16.2.12.2. Products
- 16.2.12.3. SWOT Analysis
- 16.2.12.4. Recent Developments
- 16.2.12.5. Financials (Based on Availability)
- 16.2.13 Mitsubishi Chemical Advanced Materials
- 16.2.13.1. Overview
- 16.2.13.2. Products
- 16.2.13.3. SWOT Analysis
- 16.2.13.4. Recent Developments
- 16.2.13.5. Financials (Based on Availability)
- 16.2.1 Solvay
List of Figures
- Figure 1: Global Rail Composites Market Revenue Breakdown (Million, %) by Region 2024 & 2032
- Figure 2: Global Rail Composites Market Volume Breakdown (K Tons, %) by Region 2024 & 2032
- Figure 3: North America Rail Composites Market Revenue (Million), by Country 2024 & 2032
- Figure 4: North America Rail Composites Market Volume (K Tons), by Country 2024 & 2032
- Figure 5: North America Rail Composites Market Revenue Share (%), by Country 2024 & 2032
- Figure 6: North America Rail Composites Market Volume Share (%), by Country 2024 & 2032
- Figure 7: Europe Rail Composites Market Revenue (Million), by Country 2024 & 2032
- Figure 8: Europe Rail Composites Market Volume (K Tons), by Country 2024 & 2032
- Figure 9: Europe Rail Composites Market Revenue Share (%), by Country 2024 & 2032
- Figure 10: Europe Rail Composites Market Volume Share (%), by Country 2024 & 2032
- Figure 11: Asia Pacific Rail Composites Market Revenue (Million), by Country 2024 & 2032
- Figure 12: Asia Pacific Rail Composites Market Volume (K Tons), by Country 2024 & 2032
- Figure 13: Asia Pacific Rail Composites Market Revenue Share (%), by Country 2024 & 2032
- Figure 14: Asia Pacific Rail Composites Market Volume Share (%), by Country 2024 & 2032
- Figure 15: South America Rail Composites Market Revenue (Million), by Country 2024 & 2032
- Figure 16: South America Rail Composites Market Volume (K Tons), by Country 2024 & 2032
- Figure 17: South America Rail Composites Market Revenue Share (%), by Country 2024 & 2032
- Figure 18: South America Rail Composites Market Volume Share (%), by Country 2024 & 2032
- Figure 19: North America Rail Composites Market Revenue (Million), by Country 2024 & 2032
- Figure 20: North America Rail Composites Market Volume (K Tons), by Country 2024 & 2032
- Figure 21: North America Rail Composites Market Revenue Share (%), by Country 2024 & 2032
- Figure 22: North America Rail Composites Market Volume Share (%), by Country 2024 & 2032
- Figure 23: MEA Rail Composites Market Revenue (Million), by Country 2024 & 2032
- Figure 24: MEA Rail Composites Market Volume (K Tons), by Country 2024 & 2032
- Figure 25: MEA Rail Composites Market Revenue Share (%), by Country 2024 & 2032
- Figure 26: MEA Rail Composites Market Volume Share (%), by Country 2024 & 2032
- Figure 27: Asia Pacific Rail Composites Market Revenue (Million), by Resin Type 2024 & 2032
- Figure 28: Asia Pacific Rail Composites Market Volume (K Tons), by Resin Type 2024 & 2032
- Figure 29: Asia Pacific Rail Composites Market Revenue Share (%), by Resin Type 2024 & 2032
- Figure 30: Asia Pacific Rail Composites Market Volume Share (%), by Resin Type 2024 & 2032
- Figure 31: Asia Pacific Rail Composites Market Revenue (Million), by Fiber Type 2024 & 2032
- Figure 32: Asia Pacific Rail Composites Market Volume (K Tons), by Fiber Type 2024 & 2032
- Figure 33: Asia Pacific Rail Composites Market Revenue Share (%), by Fiber Type 2024 & 2032
- Figure 34: Asia Pacific Rail Composites Market Volume Share (%), by Fiber Type 2024 & 2032
- Figure 35: Asia Pacific Rail Composites Market Revenue (Million), by Application 2024 & 2032
- Figure 36: Asia Pacific Rail Composites Market Volume (K Tons), by Application 2024 & 2032
- Figure 37: Asia Pacific Rail Composites Market Revenue Share (%), by Application 2024 & 2032
- Figure 38: Asia Pacific Rail Composites Market Volume Share (%), by Application 2024 & 2032
- Figure 39: Asia Pacific Rail Composites Market Revenue (Million), by Country 2024 & 2032
- Figure 40: Asia Pacific Rail Composites Market Volume (K Tons), by Country 2024 & 2032
- Figure 41: Asia Pacific Rail Composites Market Revenue Share (%), by Country 2024 & 2032
- Figure 42: Asia Pacific Rail Composites Market Volume Share (%), by Country 2024 & 2032
- Figure 43: North America Rail Composites Market Revenue (Million), by Resin Type 2024 & 2032
- Figure 44: North America Rail Composites Market Volume (K Tons), by Resin Type 2024 & 2032
- Figure 45: North America Rail Composites Market Revenue Share (%), by Resin Type 2024 & 2032
- Figure 46: North America Rail Composites Market Volume Share (%), by Resin Type 2024 & 2032
- Figure 47: North America Rail Composites Market Revenue (Million), by Fiber Type 2024 & 2032
- Figure 48: North America Rail Composites Market Volume (K Tons), by Fiber Type 2024 & 2032
- Figure 49: North America Rail Composites Market Revenue Share (%), by Fiber Type 2024 & 2032
- Figure 50: North America Rail Composites Market Volume Share (%), by Fiber Type 2024 & 2032
- Figure 51: North America Rail Composites Market Revenue (Million), by Application 2024 & 2032
- Figure 52: North America Rail Composites Market Volume (K Tons), by Application 2024 & 2032
- Figure 53: North America Rail Composites Market Revenue Share (%), by Application 2024 & 2032
- Figure 54: North America Rail Composites Market Volume Share (%), by Application 2024 & 2032
- Figure 55: North America Rail Composites Market Revenue (Million), by Country 2024 & 2032
- Figure 56: North America Rail Composites Market Volume (K Tons), by Country 2024 & 2032
- Figure 57: North America Rail Composites Market Revenue Share (%), by Country 2024 & 2032
- Figure 58: North America Rail Composites Market Volume Share (%), by Country 2024 & 2032
- Figure 59: Europe Rail Composites Market Revenue (Million), by Resin Type 2024 & 2032
- Figure 60: Europe Rail Composites Market Volume (K Tons), by Resin Type 2024 & 2032
- Figure 61: Europe Rail Composites Market Revenue Share (%), by Resin Type 2024 & 2032
- Figure 62: Europe Rail Composites Market Volume Share (%), by Resin Type 2024 & 2032
- Figure 63: Europe Rail Composites Market Revenue (Million), by Fiber Type 2024 & 2032
- Figure 64: Europe Rail Composites Market Volume (K Tons), by Fiber Type 2024 & 2032
- Figure 65: Europe Rail Composites Market Revenue Share (%), by Fiber Type 2024 & 2032
- Figure 66: Europe Rail Composites Market Volume Share (%), by Fiber Type 2024 & 2032
- Figure 67: Europe Rail Composites Market Revenue (Million), by Application 2024 & 2032
- Figure 68: Europe Rail Composites Market Volume (K Tons), by Application 2024 & 2032
- Figure 69: Europe Rail Composites Market Revenue Share (%), by Application 2024 & 2032
- Figure 70: Europe Rail Composites Market Volume Share (%), by Application 2024 & 2032
- Figure 71: Europe Rail Composites Market Revenue (Million), by Country 2024 & 2032
- Figure 72: Europe Rail Composites Market Volume (K Tons), by Country 2024 & 2032
- Figure 73: Europe Rail Composites Market Revenue Share (%), by Country 2024 & 2032
- Figure 74: Europe Rail Composites Market Volume Share (%), by Country 2024 & 2032
- Figure 75: Rest of the World Rail Composites Market Revenue (Million), by Resin Type 2024 & 2032
- Figure 76: Rest of the World Rail Composites Market Volume (K Tons), by Resin Type 2024 & 2032
- Figure 77: Rest of the World Rail Composites Market Revenue Share (%), by Resin Type 2024 & 2032
- Figure 78: Rest of the World Rail Composites Market Volume Share (%), by Resin Type 2024 & 2032
- Figure 79: Rest of the World Rail Composites Market Revenue (Million), by Fiber Type 2024 & 2032
- Figure 80: Rest of the World Rail Composites Market Volume (K Tons), by Fiber Type 2024 & 2032
- Figure 81: Rest of the World Rail Composites Market Revenue Share (%), by Fiber Type 2024 & 2032
- Figure 82: Rest of the World Rail Composites Market Volume Share (%), by Fiber Type 2024 & 2032
- Figure 83: Rest of the World Rail Composites Market Revenue (Million), by Application 2024 & 2032
- Figure 84: Rest of the World Rail Composites Market Volume (K Tons), by Application 2024 & 2032
- Figure 85: Rest of the World Rail Composites Market Revenue Share (%), by Application 2024 & 2032
- Figure 86: Rest of the World Rail Composites Market Volume Share (%), by Application 2024 & 2032
- Figure 87: Rest of the World Rail Composites Market Revenue (Million), by Country 2024 & 2032
- Figure 88: Rest of the World Rail Composites Market Volume (K Tons), by Country 2024 & 2032
- Figure 89: Rest of the World Rail Composites Market Revenue Share (%), by Country 2024 & 2032
- Figure 90: Rest of the World Rail Composites Market Volume Share (%), by Country 2024 & 2032
List of Tables
- Table 1: Global Rail Composites Market Revenue Million Forecast, by Region 2019 & 2032
- Table 2: Global Rail Composites Market Volume K Tons Forecast, by Region 2019 & 2032
- Table 3: Global Rail Composites Market Revenue Million Forecast, by Resin Type 2019 & 2032
- Table 4: Global Rail Composites Market Volume K Tons Forecast, by Resin Type 2019 & 2032
- Table 5: Global Rail Composites Market Revenue Million Forecast, by Fiber Type 2019 & 2032
- Table 6: Global Rail Composites Market Volume K Tons Forecast, by Fiber Type 2019 & 2032
- Table 7: Global Rail Composites Market Revenue Million Forecast, by Application 2019 & 2032
- Table 8: Global Rail Composites Market Volume K Tons Forecast, by Application 2019 & 2032
- Table 9: Global Rail Composites Market Revenue Million Forecast, by Region 2019 & 2032
- Table 10: Global Rail Composites Market Volume K Tons Forecast, by Region 2019 & 2032
- Table 11: Global Rail Composites Market Revenue Million Forecast, by Country 2019 & 2032
- Table 12: Global Rail Composites Market Volume K Tons Forecast, by Country 2019 & 2032
- Table 13: United States Rail Composites Market Revenue (Million) Forecast, by Application 2019 & 2032
- Table 14: United States Rail Composites Market Volume (K Tons) Forecast, by Application 2019 & 2032
- Table 15: Canada Rail Composites Market Revenue (Million) Forecast, by Application 2019 & 2032
- Table 16: Canada Rail Composites Market Volume (K Tons) Forecast, by Application 2019 & 2032
- Table 17: Mexico Rail Composites Market Revenue (Million) Forecast, by Application 2019 & 2032
- Table 18: Mexico Rail Composites Market Volume (K Tons) Forecast, by Application 2019 & 2032
- Table 19: Global Rail Composites Market Revenue Million Forecast, by Country 2019 & 2032
- Table 20: Global Rail Composites Market Volume K Tons Forecast, by Country 2019 & 2032
- Table 21: Germany Rail Composites Market Revenue (Million) Forecast, by Application 2019 & 2032
- Table 22: Germany Rail Composites Market Volume (K Tons) Forecast, by Application 2019 & 2032
- Table 23: United Kingdom Rail Composites Market Revenue (Million) Forecast, by Application 2019 & 2032
- Table 24: United Kingdom Rail Composites Market Volume (K Tons) Forecast, by Application 2019 & 2032
- Table 25: France Rail Composites Market Revenue (Million) Forecast, by Application 2019 & 2032
- Table 26: France Rail Composites Market Volume (K Tons) Forecast, by Application 2019 & 2032
- Table 27: Spain Rail Composites Market Revenue (Million) Forecast, by Application 2019 & 2032
- Table 28: Spain Rail Composites Market Volume (K Tons) Forecast, by Application 2019 & 2032
- Table 29: Italy Rail Composites Market Revenue (Million) Forecast, by Application 2019 & 2032
- Table 30: Italy Rail Composites Market Volume (K Tons) Forecast, by Application 2019 & 2032
- Table 31: Spain Rail Composites Market Revenue (Million) Forecast, by Application 2019 & 2032
- Table 32: Spain Rail Composites Market Volume (K Tons) Forecast, by Application 2019 & 2032
- Table 33: Belgium Rail Composites Market Revenue (Million) Forecast, by Application 2019 & 2032
- Table 34: Belgium Rail Composites Market Volume (K Tons) Forecast, by Application 2019 & 2032
- Table 35: Netherland Rail Composites Market Revenue (Million) Forecast, by Application 2019 & 2032
- Table 36: Netherland Rail Composites Market Volume (K Tons) Forecast, by Application 2019 & 2032
- Table 37: Nordics Rail Composites Market Revenue (Million) Forecast, by Application 2019 & 2032
- Table 38: Nordics Rail Composites Market Volume (K Tons) Forecast, by Application 2019 & 2032
- Table 39: Rest of Europe Rail Composites Market Revenue (Million) Forecast, by Application 2019 & 2032
- Table 40: Rest of Europe Rail Composites Market Volume (K Tons) Forecast, by Application 2019 & 2032
- Table 41: Global Rail Composites Market Revenue Million Forecast, by Country 2019 & 2032
- Table 42: Global Rail Composites Market Volume K Tons Forecast, by Country 2019 & 2032
- Table 43: China Rail Composites Market Revenue (Million) Forecast, by Application 2019 & 2032
- Table 44: China Rail Composites Market Volume (K Tons) Forecast, by Application 2019 & 2032
- Table 45: Japan Rail Composites Market Revenue (Million) Forecast, by Application 2019 & 2032
- Table 46: Japan Rail Composites Market Volume (K Tons) Forecast, by Application 2019 & 2032
- Table 47: India Rail Composites Market Revenue (Million) Forecast, by Application 2019 & 2032
- Table 48: India Rail Composites Market Volume (K Tons) Forecast, by Application 2019 & 2032
- Table 49: South Korea Rail Composites Market Revenue (Million) Forecast, by Application 2019 & 2032
- Table 50: South Korea Rail Composites Market Volume (K Tons) Forecast, by Application 2019 & 2032
- Table 51: Southeast Asia Rail Composites Market Revenue (Million) Forecast, by Application 2019 & 2032
- Table 52: Southeast Asia Rail Composites Market Volume (K Tons) Forecast, by Application 2019 & 2032
- Table 53: Australia Rail Composites Market Revenue (Million) Forecast, by Application 2019 & 2032
- Table 54: Australia Rail Composites Market Volume (K Tons) Forecast, by Application 2019 & 2032
- Table 55: Indonesia Rail Composites Market Revenue (Million) Forecast, by Application 2019 & 2032
- Table 56: Indonesia Rail Composites Market Volume (K Tons) Forecast, by Application 2019 & 2032
- Table 57: Phillipes Rail Composites Market Revenue (Million) Forecast, by Application 2019 & 2032
- Table 58: Phillipes Rail Composites Market Volume (K Tons) Forecast, by Application 2019 & 2032
- Table 59: Singapore Rail Composites Market Revenue (Million) Forecast, by Application 2019 & 2032
- Table 60: Singapore Rail Composites Market Volume (K Tons) Forecast, by Application 2019 & 2032
- Table 61: Thailandc Rail Composites Market Revenue (Million) Forecast, by Application 2019 & 2032
- Table 62: Thailandc Rail Composites Market Volume (K Tons) Forecast, by Application 2019 & 2032
- Table 63: Rest of Asia Pacific Rail Composites Market Revenue (Million) Forecast, by Application 2019 & 2032
- Table 64: Rest of Asia Pacific Rail Composites Market Volume (K Tons) Forecast, by Application 2019 & 2032
- Table 65: Global Rail Composites Market Revenue Million Forecast, by Country 2019 & 2032
- Table 66: Global Rail Composites Market Volume K Tons Forecast, by Country 2019 & 2032
- Table 67: Brazil Rail Composites Market Revenue (Million) Forecast, by Application 2019 & 2032
- Table 68: Brazil Rail Composites Market Volume (K Tons) Forecast, by Application 2019 & 2032
- Table 69: Argentina Rail Composites Market Revenue (Million) Forecast, by Application 2019 & 2032
- Table 70: Argentina Rail Composites Market Volume (K Tons) Forecast, by Application 2019 & 2032
- Table 71: Peru Rail Composites Market Revenue (Million) Forecast, by Application 2019 & 2032
- Table 72: Peru Rail Composites Market Volume (K Tons) Forecast, by Application 2019 & 2032
- Table 73: Chile Rail Composites Market Revenue (Million) Forecast, by Application 2019 & 2032
- Table 74: Chile Rail Composites Market Volume (K Tons) Forecast, by Application 2019 & 2032
- Table 75: Colombia Rail Composites Market Revenue (Million) Forecast, by Application 2019 & 2032
- Table 76: Colombia Rail Composites Market Volume (K Tons) Forecast, by Application 2019 & 2032
- Table 77: Ecuador Rail Composites Market Revenue (Million) Forecast, by Application 2019 & 2032
- Table 78: Ecuador Rail Composites Market Volume (K Tons) Forecast, by Application 2019 & 2032
- Table 79: Venezuela Rail Composites Market Revenue (Million) Forecast, by Application 2019 & 2032
- Table 80: Venezuela Rail Composites Market Volume (K Tons) Forecast, by Application 2019 & 2032
- Table 81: Rest of South America Rail Composites Market Revenue (Million) Forecast, by Application 2019 & 2032
- Table 82: Rest of South America Rail Composites Market Volume (K Tons) Forecast, by Application 2019 & 2032
- Table 83: Global Rail Composites Market Revenue Million Forecast, by Country 2019 & 2032
- Table 84: Global Rail Composites Market Volume K Tons Forecast, by Country 2019 & 2032
- Table 85: United States Rail Composites Market Revenue (Million) Forecast, by Application 2019 & 2032
- Table 86: United States Rail Composites Market Volume (K Tons) Forecast, by Application 2019 & 2032
- Table 87: Canada Rail Composites Market Revenue (Million) Forecast, by Application 2019 & 2032
- Table 88: Canada Rail Composites Market Volume (K Tons) Forecast, by Application 2019 & 2032
- Table 89: Mexico Rail Composites Market Revenue (Million) Forecast, by Application 2019 & 2032
- Table 90: Mexico Rail Composites Market Volume (K Tons) Forecast, by Application 2019 & 2032
- Table 91: Global Rail Composites Market Revenue Million Forecast, by Country 2019 & 2032
- Table 92: Global Rail Composites Market Volume K Tons Forecast, by Country 2019 & 2032
- Table 93: United Arab Emirates Rail Composites Market Revenue (Million) Forecast, by Application 2019 & 2032
- Table 94: United Arab Emirates Rail Composites Market Volume (K Tons) Forecast, by Application 2019 & 2032
- Table 95: Saudi Arabia Rail Composites Market Revenue (Million) Forecast, by Application 2019 & 2032
- Table 96: Saudi Arabia Rail Composites Market Volume (K Tons) Forecast, by Application 2019 & 2032
- Table 97: South Africa Rail Composites Market Revenue (Million) Forecast, by Application 2019 & 2032
- Table 98: South Africa Rail Composites Market Volume (K Tons) Forecast, by Application 2019 & 2032
- Table 99: Rest of Middle East and Africa Rail Composites Market Revenue (Million) Forecast, by Application 2019 & 2032
- Table 100: Rest of Middle East and Africa Rail Composites Market Volume (K Tons) Forecast, by Application 2019 & 2032
- Table 101: Global Rail Composites Market Revenue Million Forecast, by Resin Type 2019 & 2032
- Table 102: Global Rail Composites Market Volume K Tons Forecast, by Resin Type 2019 & 2032
- Table 103: Global Rail Composites Market Revenue Million Forecast, by Fiber Type 2019 & 2032
- Table 104: Global Rail Composites Market Volume K Tons Forecast, by Fiber Type 2019 & 2032
- Table 105: Global Rail Composites Market Revenue Million Forecast, by Application 2019 & 2032
- Table 106: Global Rail Composites Market Volume K Tons Forecast, by Application 2019 & 2032
- Table 107: Global Rail Composites Market Revenue Million Forecast, by Country 2019 & 2032
- Table 108: Global Rail Composites Market Volume K Tons Forecast, by Country 2019 & 2032
- Table 109: China Rail Composites Market Revenue (Million) Forecast, by Application 2019 & 2032
- Table 110: China Rail Composites Market Volume (K Tons) Forecast, by Application 2019 & 2032
- Table 111: India Rail Composites Market Revenue (Million) Forecast, by Application 2019 & 2032
- Table 112: India Rail Composites Market Volume (K Tons) Forecast, by Application 2019 & 2032
- Table 113: Japan Rail Composites Market Revenue (Million) Forecast, by Application 2019 & 2032
- Table 114: Japan Rail Composites Market Volume (K Tons) Forecast, by Application 2019 & 2032
- Table 115: South Korea Rail Composites Market Revenue (Million) Forecast, by Application 2019 & 2032
- Table 116: South Korea Rail Composites Market Volume (K Tons) Forecast, by Application 2019 & 2032
- Table 117: Rest of Asia Pacific Rail Composites Market Revenue (Million) Forecast, by Application 2019 & 2032
- Table 118: Rest of Asia Pacific Rail Composites Market Volume (K Tons) Forecast, by Application 2019 & 2032
- Table 119: Global Rail Composites Market Revenue Million Forecast, by Resin Type 2019 & 2032
- Table 120: Global Rail Composites Market Volume K Tons Forecast, by Resin Type 2019 & 2032
- Table 121: Global Rail Composites Market Revenue Million Forecast, by Fiber Type 2019 & 2032
- Table 122: Global Rail Composites Market Volume K Tons Forecast, by Fiber Type 2019 & 2032
- Table 123: Global Rail Composites Market Revenue Million Forecast, by Application 2019 & 2032
- Table 124: Global Rail Composites Market Volume K Tons Forecast, by Application 2019 & 2032
- Table 125: Global Rail Composites Market Revenue Million Forecast, by Country 2019 & 2032
- Table 126: Global Rail Composites Market Volume K Tons Forecast, by Country 2019 & 2032
- Table 127: United States Rail Composites Market Revenue (Million) Forecast, by Application 2019 & 2032
- Table 128: United States Rail Composites Market Volume (K Tons) Forecast, by Application 2019 & 2032
- Table 129: Canada Rail Composites Market Revenue (Million) Forecast, by Application 2019 & 2032
- Table 130: Canada Rail Composites Market Volume (K Tons) Forecast, by Application 2019 & 2032
- Table 131: Mexico Rail Composites Market Revenue (Million) Forecast, by Application 2019 & 2032
- Table 132: Mexico Rail Composites Market Volume (K Tons) Forecast, by Application 2019 & 2032
- Table 133: Global Rail Composites Market Revenue Million Forecast, by Resin Type 2019 & 2032
- Table 134: Global Rail Composites Market Volume K Tons Forecast, by Resin Type 2019 & 2032
- Table 135: Global Rail Composites Market Revenue Million Forecast, by Fiber Type 2019 & 2032
- Table 136: Global Rail Composites Market Volume K Tons Forecast, by Fiber Type 2019 & 2032
- Table 137: Global Rail Composites Market Revenue Million Forecast, by Application 2019 & 2032
- Table 138: Global Rail Composites Market Volume K Tons Forecast, by Application 2019 & 2032
- Table 139: Global Rail Composites Market Revenue Million Forecast, by Country 2019 & 2032
- Table 140: Global Rail Composites Market Volume K Tons Forecast, by Country 2019 & 2032
- Table 141: Germany Rail Composites Market Revenue (Million) Forecast, by Application 2019 & 2032
- Table 142: Germany Rail Composites Market Volume (K Tons) Forecast, by Application 2019 & 2032
- Table 143: United Kingdom Rail Composites Market Revenue (Million) Forecast, by Application 2019 & 2032
- Table 144: United Kingdom Rail Composites Market Volume (K Tons) Forecast, by Application 2019 & 2032
- Table 145: Italy Rail Composites Market Revenue (Million) Forecast, by Application 2019 & 2032
- Table 146: Italy Rail Composites Market Volume (K Tons) Forecast, by Application 2019 & 2032
- Table 147: France Rail Composites Market Revenue (Million) Forecast, by Application 2019 & 2032
- Table 148: France Rail Composites Market Volume (K Tons) Forecast, by Application 2019 & 2032
- Table 149: Rest of Europe Rail Composites Market Revenue (Million) Forecast, by Application 2019 & 2032
- Table 150: Rest of Europe Rail Composites Market Volume (K Tons) Forecast, by Application 2019 & 2032
- Table 151: Global Rail Composites Market Revenue Million Forecast, by Resin Type 2019 & 2032
- Table 152: Global Rail Composites Market Volume K Tons Forecast, by Resin Type 2019 & 2032
- Table 153: Global Rail Composites Market Revenue Million Forecast, by Fiber Type 2019 & 2032
- Table 154: Global Rail Composites Market Volume K Tons Forecast, by Fiber Type 2019 & 2032
- Table 155: Global Rail Composites Market Revenue Million Forecast, by Application 2019 & 2032
- Table 156: Global Rail Composites Market Volume K Tons Forecast, by Application 2019 & 2032
- Table 157: Global Rail Composites Market Revenue Million Forecast, by Country 2019 & 2032
- Table 158: Global Rail Composites Market Volume K Tons Forecast, by Country 2019 & 2032
Frequently Asked Questions
1. What is the projected Compound Annual Growth Rate (CAGR) of the Rail Composites Market?
The projected CAGR is approximately > 5.00%.
2. Which companies are prominent players in the Rail Composites Market?
Key companies in the market include Solvay, Celanese Corporation, Avient Corporation, Reliance Industries Limited, Exel Composites, LANXESS, BASF SE, Kineco Limited, Toray Industries Inc , Hexcel Corporation, Gurit, TEIJIN LIMITED, Mitsubishi Chemical Advanced Materials.
3. What are the main segments of the Rail Composites Market?
The market segments include Resin Type, Fiber Type, Application.
4. Can you provide details about the market size?
The market size is estimated to be USD XX Million as of 2022.
5. What are some drivers contributing to market growth?
Increasing Railway Projects in the Asia-Pacific Region; Rapidly Increasing Demand for High-speed Rail.
6. What are the notable trends driving market growth?
Exterior Application to Dominate the Market.
7. Are there any restraints impacting market growth?
Lack of Railway Infrastructure in Vietnam. Indonesia. and Thailand; Restrictions on Composite Materials for Railway Application.
8. Can you provide examples of recent developments in the market?
In May 2021, Celanese announced its plan to initiate a three-year plan to expand its LFT (long-fiber thermoplastics ) capacity in Nanjing, China. This is expected to be completed by the second half of 2023.
9. What pricing options are available for accessing the report?
Pricing options include single-user, multi-user, and enterprise licenses priced at USD 4750, USD 5250, and USD 8750 respectively.
10. Is the market size provided in terms of value or volume?
The market size is provided in terms of value, measured in Million and volume, measured in K Tons.
11. Are there any specific market keywords associated with the report?
Yes, the market keyword associated with the report is "Rail Composites Market," which aids in identifying and referencing the specific market segment covered.
12. How do I determine which pricing option suits my needs best?
The pricing options vary based on user requirements and access needs. Individual users may opt for single-user licenses, while businesses requiring broader access may choose multi-user or enterprise licenses for cost-effective access to the report.
13. Are there any additional resources or data provided in the Rail Composites Market report?
While the report offers comprehensive insights, it's advisable to review the specific contents or supplementary materials provided to ascertain if additional resources or data are available.
14. How can I stay updated on further developments or reports in the Rail Composites Market?
To stay informed about further developments, trends, and reports in the Rail Composites Market, consider subscribing to industry newsletters, following relevant companies and organizations, or regularly checking reputable industry news sources and publications.
Methodology
Step 1 - Identification of Relevant Samples Size from Population Database


Step 2 - Approaches for Defining Global Market Size (Value, Volume* & Price*)

Note*: In applicable scenarios
Step 3 - Data Sources
Primary Research
- Web Analytics
- Survey Reports
- Research Institute
- Latest Research Reports
- Opinion Leaders
Secondary Research
- Annual Reports
- White Paper
- Latest Press Release
- Industry Association
- Paid Database
- Investor Presentations

Step 4 - Data Triangulation
Involves using different sources of information in order to increase the validity of a study
These sources are likely to be stakeholders in a program - participants, other researchers, program staff, other community members, and so on.
Then we put all data in single framework & apply various statistical tools to find out the dynamic on the market.
During the analysis stage, feedback from the stakeholder groups would be compared to determine areas of agreement as well as areas of divergence


