
Key Insights
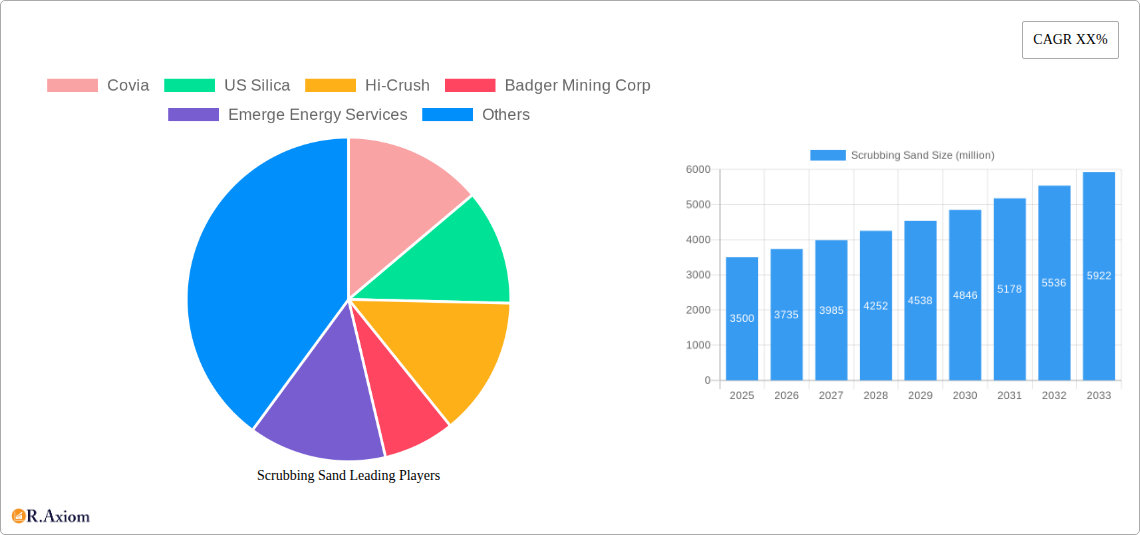
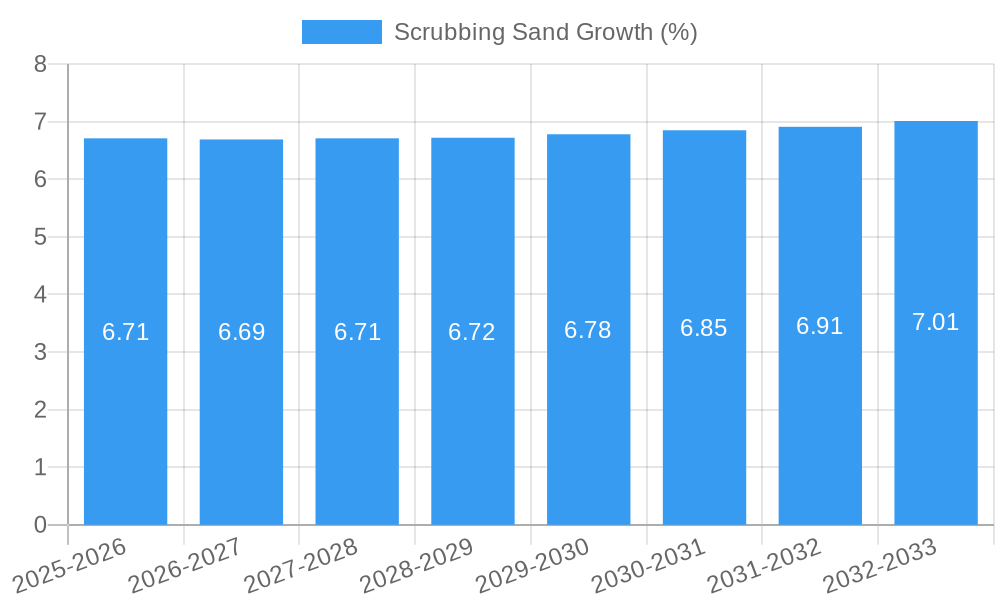
The global Scrubbing Sand market is projected for robust growth, with an estimated market size of approximately USD 3,500 million in 2025, expanding at a Compound Annual Growth Rate (CAGR) of roughly 6.5% through 2033. This expansion is primarily fueled by the escalating demand from key end-use industries, notably glass manufacturing, which relies heavily on high-purity silica sand for its production processes. The foundry sector also represents a significant driver, utilizing scrubbing sand as a crucial molding material due to its thermal stability and flowability. Furthermore, the ceramics and refractory materials industry contributes substantially to market demand, requiring scrubbing sand for its ability to withstand high temperatures and chemical attacks. The increasing industrialization and infrastructure development across emerging economies are also playing a pivotal role in bolstering the consumption of scrubbing sand.
Technological advancements in sand processing and purification techniques are enabling the production of higher-grade scrubbing sand, catering to more stringent application requirements. The market is segmented by mesh size, with the "More than 100 Mesh" category expected to witness the fastest growth, driven by specialized applications demanding finer particle sizes. However, the market faces certain restraints, including fluctuating raw material prices and the environmental impact associated with sand extraction and processing. Nevertheless, the consistent demand from core applications, coupled with emerging uses in niche sectors, positions the scrubbing sand market for sustained positive growth in the coming years. Key players like Covia, US Silica, and Sibelco are actively investing in expanding their production capacities and enhancing their product portfolios to capture a larger market share.
Comprehensive Scrubbing Sand Market Report: Analysis, Trends, and Future Outlook (2019–2033)
This in-depth report provides a thorough analysis of the global scrubbing sand market, covering historical trends, current dynamics, and future projections from 2019 to 2033. With a base year of 2025, the study meticulously examines market segmentation, key growth drivers, prevailing challenges, emerging opportunities, and the competitive landscape. This report is an indispensable resource for industry stakeholders seeking to understand the intricate workings of the scrubbing sand sector, including glass manufacturing, foundry, ceramics and refractory materials, and other applications, as well as various mesh sizes (less than 50 Mesh, 50-100 Mesh, more than 100 Mesh).
Scrubbing Sand Market Concentration & Innovation
The global scrubbing sand market is characterized by a moderate level of concentration, with a mix of large established players and smaller niche operators. Key companies such as Covia, US Silica, Hi-Crush, Badger Mining Corp, Emerge Energy Services, Sibelco, Preferred Proppants, Pattison Sand, Quarzwerke Group, Chongqing Changjiang River Moulding Material, Tongliao Tiancheng Foundry Material, and Tongliao Yongxin Silica Sand are vying for market share. Innovation in the scrubbing sand industry is primarily driven by the demand for higher purity, tailored particle sizes, and improved processing efficiencies. Technological advancements in mining, beneficiation, and quality control are crucial. Regulatory frameworks, particularly concerning environmental impact and product safety, are also shaping innovation strategies. The threat of product substitutes, while present, is limited by the unique properties of scrubbing sand in its core applications. End-user trends are shifting towards sustainable sourcing and products with reduced environmental footprints. Merger and acquisition (M&A) activities, valued in the tens of millions of dollars, are strategic moves aimed at consolidating market position, expanding product portfolios, and achieving economies of scale. For instance, recent M&A deals in the past five years have focused on acquiring companies with specialized processing capabilities or access to high-quality reserves.
Scrubbing Sand Industry Trends & Insights
The scrubbing sand industry is poised for robust growth, driven by an expanding global construction sector, increasing demand for high-quality glass products, and a resurgence in foundry operations. The market is projected to witness a Compound Annual Growth Rate (CAGR) of approximately 5.8% during the forecast period of 2025–2033. Technological disruptions are continuously enhancing the efficiency and sustainability of scrubbing sand extraction and processing. Innovations in automated mining equipment and advanced beneficiation techniques are leading to higher purity sands and reduced waste. Consumer preferences are increasingly leaning towards specialized scrubbing sand grades that offer specific performance characteristics, such as enhanced durability in refractory applications or superior clarity in glass manufacturing. Competitive dynamics are intensifying, with companies focusing on vertical integration, supply chain optimization, and building strong customer relationships. Market penetration is expected to rise significantly in emerging economies as industrialization accelerates. The overall market size for scrubbing sand is estimated to reach an impressive value of over USD 7,500 million by 2033. Key market drivers include the sustained demand from the automotive industry for glass, the growing need for industrial casting in manufacturing, and the continuous development in the construction and infrastructure sectors. Furthermore, the increasing adoption of advanced manufacturing processes in various end-use industries is also a significant contributor to market expansion. The focus on producing environmentally friendly and sustainable sand products is also gaining traction, influencing production methods and product development.
Dominant Markets & Segments in Scrubbing Sand
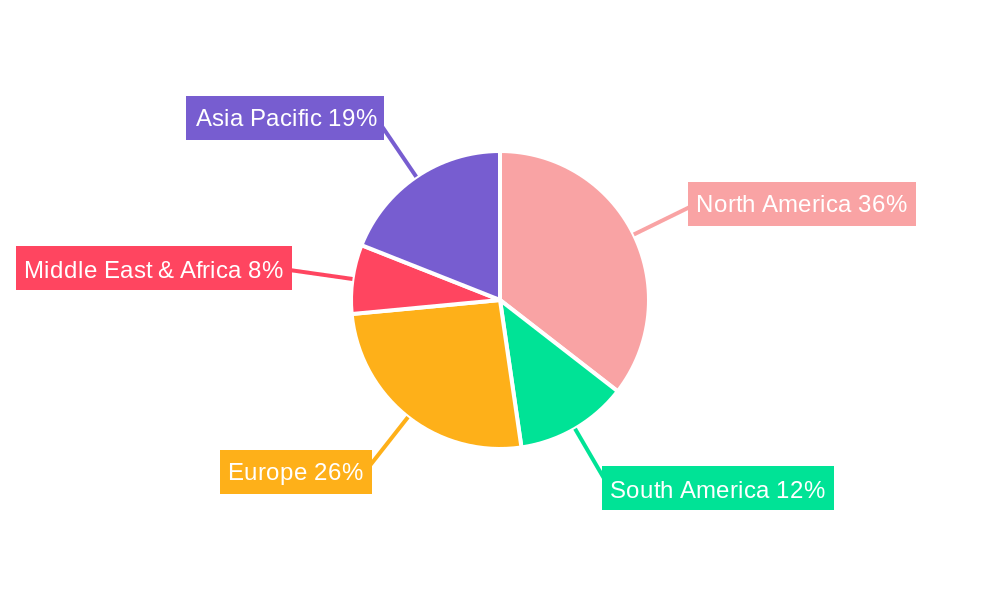
The Glass Manufacturing segment is a dominant force within the global scrubbing sand market, projected to command a substantial market share. This dominance is fueled by the ever-growing demand for flat glass in construction, automotive, and consumer electronics. Countries with strong manufacturing bases and significant construction activity, particularly in Asia-Pacific (e.g., China, India) and North America (USA), are leading the charge. Within the Glass Manufacturing segment, scrubbing sand with Less than 50 Mesh particle size often holds a significant position due to its suitability for various glass production processes requiring fine particles for optimal melting and clarity.
Key Drivers for Dominance:
- Economic Policies: Favorable government policies promoting industrial growth, manufacturing exports, and infrastructure development directly impact the demand for glass and, consequently, scrubbing sand.
- Infrastructure Development: Large-scale construction projects, including residential, commercial, and public infrastructure, are primary consumers of flat glass, thereby driving the demand for high-quality scrubbing sand.
- Automotive Industry Growth: The increasing global vehicle production, including electric vehicles, necessitates a significant volume of automotive glass, further bolstering the demand for scrubbing sand.
- Technological Advancements in Glass Production: Innovations in glass manufacturing, such as energy-efficient furnaces and specialized glass types, often require specific grades of scrubbing sand with defined purity and particle size distribution.
The Foundry segment also represents a significant and growing market for scrubbing sand. Its application as a molding sand and core sand in metal casting processes is critical for industries like automotive, aerospace, and heavy machinery. Regions with robust manufacturing and industrial activity, such as Europe, North America, and parts of Asia, exhibit strong demand in this segment. 50-100 Mesh and More than 100 Mesh scrubbing sand grades are particularly crucial for foundry applications, enabling precise mold creation and smooth casting surfaces.
Key Drivers for Dominance:
- Industrial Manufacturing Output: The overall health and output of the industrial manufacturing sector directly correlate with the demand for castings, thus influencing the scrubbing sand market in foundries.
- Rise of Advanced Casting Techniques: The adoption of advanced casting technologies that require finer and more precisely sized sands to achieve complex geometries and superior surface finishes.
- Automotive and Aerospace Demand: These sectors are major consumers of castings, and their production volumes significantly impact the demand for foundry-grade scrubbing sand.
The Ceramics and Refractory Materials segment, while perhaps smaller in overall volume compared to glass and foundry, is a high-value market for specialized scrubbing sand. Its use in producing heat-resistant materials, tiles, sanitary ware, and insulation is critical. Demand here is driven by industrial furnaces, kilns, and the construction of buildings requiring high-performance materials. The More than 100 Mesh grades are often preferred for their ability to create dense, high-strength ceramic and refractory products.
Key Drivers for Dominance:
- Industrial Furnace and Kiln Demand: The continuous operation and expansion of industrial furnaces and kilns across various sectors, including steel, cement, and glass manufacturing, necessitate refractory materials.
- Construction of High-Temperature Infrastructure: Projects requiring structures capable of withstanding extreme heat, such as power plants and chemical processing facilities, drive the demand for refractory-grade scrubbing sand.
- Growth in the Building Materials Sector: The increasing demand for durable and aesthetically pleasing ceramic tiles and other building materials contributes to the consumption of scrubbing sand.
The Others segment encompasses a diverse range of applications, including water filtration, abrasives, and construction materials. While individually smaller, collectively they contribute to market diversity and growth.
Scrubbing Sand Product Developments
Product developments in the scrubbing sand market are focused on enhancing purity, optimizing particle size distribution, and improving the performance characteristics for specific applications. Innovations include advanced beneficiation processes to remove impurities, leading to higher-grade sands essential for specialized glass and ceramic manufacturing. Tailored particle size grading ensures optimal flowability and packing density for foundry applications, while enhanced durability is achieved for refractory materials. These developments offer competitive advantages by meeting stringent industry standards and end-user demands for specialized, high-performance scrubbing sand.
Report Scope & Segmentation Analysis
This report segments the scrubbing sand market by Application into Glass Manufacturing, Foundry, Ceramics and Refractory Materials, and Others. The Glass Manufacturing segment, expected to reach over USD 3,000 million by 2033 with a CAGR of approximately 5.5%, is driven by construction and automotive demand. The Foundry segment, valued at over USD 2,500 million by 2033 and growing at a CAGR of 6.0%, benefits from industrial manufacturing growth. The Ceramics and Refractory Materials segment, projected to exceed USD 1,500 million by 2033 with a CAGR of 5.7%, is supported by industrial furnace demand. The Others segment, though smaller, is expected to grow steadily. Additionally, the market is segmented by Type: Less than 50 Mesh, 50-100 Mesh, and More than 100 Mesh, each catering to distinct application needs and exhibiting varying growth trajectories based on end-user industry trends.
Key Drivers of Scrubbing Sand Growth
The scrubbing sand market's growth is propelled by several key factors. The burgeoning global construction industry, fueled by urbanization and infrastructure development, directly increases demand for glass and other building materials that utilize scrubbing sand. The automotive sector's consistent expansion, particularly with the rise of electric vehicles, necessitates high-quality glass for production, thereby driving demand for specialized sand. Furthermore, advancements in foundry technology and the continuous need for industrial castings across manufacturing sectors are significant growth catalysts. Regulatory support for sustainable practices in mining and processing also encourages the adoption of more efficient and environmentally friendly scrubbing sand production methods.
Challenges in the Scrubbing Sand Sector
Despite robust growth prospects, the scrubbing sand sector faces several challenges. Stringent environmental regulations regarding mining operations, water usage, and land reclamation can increase operational costs and require significant capital investment for compliance. Supply chain disruptions, often due to logistical complexities, transportation costs, and geopolitical factors, can impact the timely delivery of scrubbing sand to end-users. Intense competition among key players, leading to price pressures, is another significant hurdle. Additionally, the exploration and extraction of high-purity silica deposits, essential for premium scrubbing sand grades, are becoming increasingly challenging and resource-intensive.
Emerging Opportunities in Scrubbing Sand
Emerging opportunities in the scrubbing sand market lie in the development of specialized, high-purity grades for advanced applications. The growing demand for sustainable and eco-friendly construction materials presents an opportunity for scrubbing sand producers to innovate in processing and sourcing. The expanding electronics industry, with its increasing need for high-purity silica in various components, offers a niche growth avenue. Furthermore, the development of novel applications in areas like advanced filtration and specialized coatings can unlock new market potential. The increasing focus on recycling and circular economy principles within end-user industries also presents opportunities for companies that can align their operations with these trends.
Leading Players in the Scrubbing Sand Market
- Covia
- US Silica
- Hi-Crush
- Badger Mining Corp
- Emerge Energy Services
- Sibelco
- Preferred Proppants
- Pattison Sand
- Quarzwerke Group
- Chongqing Changjiang River Moulding Material
- Tongliao Tiancheng Foundry Material
- Tongliao Yongxin Silica Sand
Key Developments in Scrubbing Sand Industry
- 2023: Covia's acquisition of Preferred Proppants expanded its proppant portfolio and geographical reach.
- 2023: US Silica announced plans for significant investment in upgrading its processing facilities to enhance product quality and sustainability.
- 2022: Hi-Crush completed a strategic divestment of non-core assets to focus on its core silica sand business.
- 2022: Badger Mining Corp launched a new range of highly purified silica sands for specialized industrial applications.
- 2021: Emerge Energy Services underwent financial restructuring to streamline its operations and strengthen its market position.
- 2021: Sibelco invested in new beneficiation technologies to improve the purity and consistency of its industrial sand products.
Strategic Outlook for Scrubbing Sand Market
The strategic outlook for the scrubbing sand market is highly positive, driven by sustained demand from fundamental industries like construction and manufacturing. Companies are expected to focus on technological innovation to produce higher-purity, specialized grades of sand that command premium pricing. Strategic partnerships and targeted acquisitions will continue to play a crucial role in consolidating market share and expanding capabilities. Emphasis on sustainable mining practices and environmentally friendly processing will become increasingly important for long-term success and brand reputation. Exploring opportunities in emerging markets and diversifying applications beyond traditional uses will be key growth catalysts for the future.
Scrubbing Sand Segmentation
-
1. Application
- 1.1. Glass Manufacturing
- 1.2. Foundry
- 1.3. Ceramics and Refractory Materials
- 1.4. Others
-
2. Types
- 2.1. Less than 50 Mesh
- 2.2. 50-100 Mesh
- 2.3. More than 100 Mesh
Scrubbing Sand Segmentation By Geography
-
1. North America
- 1.1. United States
- 1.2. Canada
- 1.3. Mexico
-
2. South America
- 2.1. Brazil
- 2.2. Argentina
- 2.3. Rest of South America
-
3. Europe
- 3.1. United Kingdom
- 3.2. Germany
- 3.3. France
- 3.4. Italy
- 3.5. Spain
- 3.6. Russia
- 3.7. Benelux
- 3.8. Nordics
- 3.9. Rest of Europe
-
4. Middle East & Africa
- 4.1. Turkey
- 4.2. Israel
- 4.3. GCC
- 4.4. North Africa
- 4.5. South Africa
- 4.6. Rest of Middle East & Africa
-
5. Asia Pacific
- 5.1. China
- 5.2. India
- 5.3. Japan
- 5.4. South Korea
- 5.5. ASEAN
- 5.6. Oceania
- 5.7. Rest of Asia Pacific
Scrubbing Sand REPORT HIGHLIGHTS
| Aspects | Details |
|---|---|
| Study Period | 2019-2033 |
| Base Year | 2024 |
| Estimated Year | 2025 |
| Forecast Period | 2025-2033 |
| Historical Period | 2019-2024 |
| Growth Rate | CAGR of XX% from 2019-2033 |
| Segmentation |
|
Table of Contents
- 1. Introduction
- 1.1. Research Scope
- 1.2. Market Segmentation
- 1.3. Research Methodology
- 1.4. Definitions and Assumptions
- 2. Executive Summary
- 2.1. Introduction
- 3. Market Dynamics
- 3.1. Introduction
- 3.2. Market Drivers
- 3.3. Market Restrains
- 3.4. Market Trends
- 4. Market Factor Analysis
- 4.1. Porters Five Forces
- 4.2. Supply/Value Chain
- 4.3. PESTEL analysis
- 4.4. Market Entropy
- 4.5. Patent/Trademark Analysis
- 5. Global Scrubbing Sand Analysis, Insights and Forecast, 2019-2031
- 5.1. Market Analysis, Insights and Forecast - by Application
- 5.1.1. Glass Manufacturing
- 5.1.2. Foundry
- 5.1.3. Ceramics and Refractory Materials
- 5.1.4. Others
- 5.2. Market Analysis, Insights and Forecast - by Types
- 5.2.1. Less than 50 Mesh
- 5.2.2. 50-100 Mesh
- 5.2.3. More than 100 Mesh
- 5.3. Market Analysis, Insights and Forecast - by Region
- 5.3.1. North America
- 5.3.2. South America
- 5.3.3. Europe
- 5.3.4. Middle East & Africa
- 5.3.5. Asia Pacific
- 5.1. Market Analysis, Insights and Forecast - by Application
- 6. North America Scrubbing Sand Analysis, Insights and Forecast, 2019-2031
- 6.1. Market Analysis, Insights and Forecast - by Application
- 6.1.1. Glass Manufacturing
- 6.1.2. Foundry
- 6.1.3. Ceramics and Refractory Materials
- 6.1.4. Others
- 6.2. Market Analysis, Insights and Forecast - by Types
- 6.2.1. Less than 50 Mesh
- 6.2.2. 50-100 Mesh
- 6.2.3. More than 100 Mesh
- 6.1. Market Analysis, Insights and Forecast - by Application
- 7. South America Scrubbing Sand Analysis, Insights and Forecast, 2019-2031
- 7.1. Market Analysis, Insights and Forecast - by Application
- 7.1.1. Glass Manufacturing
- 7.1.2. Foundry
- 7.1.3. Ceramics and Refractory Materials
- 7.1.4. Others
- 7.2. Market Analysis, Insights and Forecast - by Types
- 7.2.1. Less than 50 Mesh
- 7.2.2. 50-100 Mesh
- 7.2.3. More than 100 Mesh
- 7.1. Market Analysis, Insights and Forecast - by Application
- 8. Europe Scrubbing Sand Analysis, Insights and Forecast, 2019-2031
- 8.1. Market Analysis, Insights and Forecast - by Application
- 8.1.1. Glass Manufacturing
- 8.1.2. Foundry
- 8.1.3. Ceramics and Refractory Materials
- 8.1.4. Others
- 8.2. Market Analysis, Insights and Forecast - by Types
- 8.2.1. Less than 50 Mesh
- 8.2.2. 50-100 Mesh
- 8.2.3. More than 100 Mesh
- 8.1. Market Analysis, Insights and Forecast - by Application
- 9. Middle East & Africa Scrubbing Sand Analysis, Insights and Forecast, 2019-2031
- 9.1. Market Analysis, Insights and Forecast - by Application
- 9.1.1. Glass Manufacturing
- 9.1.2. Foundry
- 9.1.3. Ceramics and Refractory Materials
- 9.1.4. Others
- 9.2. Market Analysis, Insights and Forecast - by Types
- 9.2.1. Less than 50 Mesh
- 9.2.2. 50-100 Mesh
- 9.2.3. More than 100 Mesh
- 9.1. Market Analysis, Insights and Forecast - by Application
- 10. Asia Pacific Scrubbing Sand Analysis, Insights and Forecast, 2019-2031
- 10.1. Market Analysis, Insights and Forecast - by Application
- 10.1.1. Glass Manufacturing
- 10.1.2. Foundry
- 10.1.3. Ceramics and Refractory Materials
- 10.1.4. Others
- 10.2. Market Analysis, Insights and Forecast - by Types
- 10.2.1. Less than 50 Mesh
- 10.2.2. 50-100 Mesh
- 10.2.3. More than 100 Mesh
- 10.1. Market Analysis, Insights and Forecast - by Application
- 11. Competitive Analysis
- 11.1. Global Market Share Analysis 2024
- 11.2. Company Profiles
- 11.2.1 Covia
- 11.2.1.1. Overview
- 11.2.1.2. Products
- 11.2.1.3. SWOT Analysis
- 11.2.1.4. Recent Developments
- 11.2.1.5. Financials (Based on Availability)
- 11.2.2 US Silica
- 11.2.2.1. Overview
- 11.2.2.2. Products
- 11.2.2.3. SWOT Analysis
- 11.2.2.4. Recent Developments
- 11.2.2.5. Financials (Based on Availability)
- 11.2.3 Hi-Crush
- 11.2.3.1. Overview
- 11.2.3.2. Products
- 11.2.3.3. SWOT Analysis
- 11.2.3.4. Recent Developments
- 11.2.3.5. Financials (Based on Availability)
- 11.2.4 Badger Mining Corp
- 11.2.4.1. Overview
- 11.2.4.2. Products
- 11.2.4.3. SWOT Analysis
- 11.2.4.4. Recent Developments
- 11.2.4.5. Financials (Based on Availability)
- 11.2.5 Emerge Energy Services
- 11.2.5.1. Overview
- 11.2.5.2. Products
- 11.2.5.3. SWOT Analysis
- 11.2.5.4. Recent Developments
- 11.2.5.5. Financials (Based on Availability)
- 11.2.6 Sibelco
- 11.2.6.1. Overview
- 11.2.6.2. Products
- 11.2.6.3. SWOT Analysis
- 11.2.6.4. Recent Developments
- 11.2.6.5. Financials (Based on Availability)
- 11.2.7 Preferred Proppants
- 11.2.7.1. Overview
- 11.2.7.2. Products
- 11.2.7.3. SWOT Analysis
- 11.2.7.4. Recent Developments
- 11.2.7.5. Financials (Based on Availability)
- 11.2.8 Pattison Sand
- 11.2.8.1. Overview
- 11.2.8.2. Products
- 11.2.8.3. SWOT Analysis
- 11.2.8.4. Recent Developments
- 11.2.8.5. Financials (Based on Availability)
- 11.2.9 Quarzwerke Group
- 11.2.9.1. Overview
- 11.2.9.2. Products
- 11.2.9.3. SWOT Analysis
- 11.2.9.4. Recent Developments
- 11.2.9.5. Financials (Based on Availability)
- 11.2.10 Chongqing Changjiang River Moulding Material
- 11.2.10.1. Overview
- 11.2.10.2. Products
- 11.2.10.3. SWOT Analysis
- 11.2.10.4. Recent Developments
- 11.2.10.5. Financials (Based on Availability)
- 11.2.11 Tongliao Tiancheng Foundry Material
- 11.2.11.1. Overview
- 11.2.11.2. Products
- 11.2.11.3. SWOT Analysis
- 11.2.11.4. Recent Developments
- 11.2.11.5. Financials (Based on Availability)
- 11.2.12 Tongliao Yongxin Silica Sand
- 11.2.12.1. Overview
- 11.2.12.2. Products
- 11.2.12.3. SWOT Analysis
- 11.2.12.4. Recent Developments
- 11.2.12.5. Financials (Based on Availability)
- 11.2.1 Covia
List of Figures
- Figure 1: Global Scrubbing Sand Revenue Breakdown (million, %) by Region 2024 & 2032
- Figure 2: North America Scrubbing Sand Revenue (million), by Application 2024 & 2032
- Figure 3: North America Scrubbing Sand Revenue Share (%), by Application 2024 & 2032
- Figure 4: North America Scrubbing Sand Revenue (million), by Types 2024 & 2032
- Figure 5: North America Scrubbing Sand Revenue Share (%), by Types 2024 & 2032
- Figure 6: North America Scrubbing Sand Revenue (million), by Country 2024 & 2032
- Figure 7: North America Scrubbing Sand Revenue Share (%), by Country 2024 & 2032
- Figure 8: South America Scrubbing Sand Revenue (million), by Application 2024 & 2032
- Figure 9: South America Scrubbing Sand Revenue Share (%), by Application 2024 & 2032
- Figure 10: South America Scrubbing Sand Revenue (million), by Types 2024 & 2032
- Figure 11: South America Scrubbing Sand Revenue Share (%), by Types 2024 & 2032
- Figure 12: South America Scrubbing Sand Revenue (million), by Country 2024 & 2032
- Figure 13: South America Scrubbing Sand Revenue Share (%), by Country 2024 & 2032
- Figure 14: Europe Scrubbing Sand Revenue (million), by Application 2024 & 2032
- Figure 15: Europe Scrubbing Sand Revenue Share (%), by Application 2024 & 2032
- Figure 16: Europe Scrubbing Sand Revenue (million), by Types 2024 & 2032
- Figure 17: Europe Scrubbing Sand Revenue Share (%), by Types 2024 & 2032
- Figure 18: Europe Scrubbing Sand Revenue (million), by Country 2024 & 2032
- Figure 19: Europe Scrubbing Sand Revenue Share (%), by Country 2024 & 2032
- Figure 20: Middle East & Africa Scrubbing Sand Revenue (million), by Application 2024 & 2032
- Figure 21: Middle East & Africa Scrubbing Sand Revenue Share (%), by Application 2024 & 2032
- Figure 22: Middle East & Africa Scrubbing Sand Revenue (million), by Types 2024 & 2032
- Figure 23: Middle East & Africa Scrubbing Sand Revenue Share (%), by Types 2024 & 2032
- Figure 24: Middle East & Africa Scrubbing Sand Revenue (million), by Country 2024 & 2032
- Figure 25: Middle East & Africa Scrubbing Sand Revenue Share (%), by Country 2024 & 2032
- Figure 26: Asia Pacific Scrubbing Sand Revenue (million), by Application 2024 & 2032
- Figure 27: Asia Pacific Scrubbing Sand Revenue Share (%), by Application 2024 & 2032
- Figure 28: Asia Pacific Scrubbing Sand Revenue (million), by Types 2024 & 2032
- Figure 29: Asia Pacific Scrubbing Sand Revenue Share (%), by Types 2024 & 2032
- Figure 30: Asia Pacific Scrubbing Sand Revenue (million), by Country 2024 & 2032
- Figure 31: Asia Pacific Scrubbing Sand Revenue Share (%), by Country 2024 & 2032
List of Tables
- Table 1: Global Scrubbing Sand Revenue million Forecast, by Region 2019 & 2032
- Table 2: Global Scrubbing Sand Revenue million Forecast, by Application 2019 & 2032
- Table 3: Global Scrubbing Sand Revenue million Forecast, by Types 2019 & 2032
- Table 4: Global Scrubbing Sand Revenue million Forecast, by Region 2019 & 2032
- Table 5: Global Scrubbing Sand Revenue million Forecast, by Application 2019 & 2032
- Table 6: Global Scrubbing Sand Revenue million Forecast, by Types 2019 & 2032
- Table 7: Global Scrubbing Sand Revenue million Forecast, by Country 2019 & 2032
- Table 8: United States Scrubbing Sand Revenue (million) Forecast, by Application 2019 & 2032
- Table 9: Canada Scrubbing Sand Revenue (million) Forecast, by Application 2019 & 2032
- Table 10: Mexico Scrubbing Sand Revenue (million) Forecast, by Application 2019 & 2032
- Table 11: Global Scrubbing Sand Revenue million Forecast, by Application 2019 & 2032
- Table 12: Global Scrubbing Sand Revenue million Forecast, by Types 2019 & 2032
- Table 13: Global Scrubbing Sand Revenue million Forecast, by Country 2019 & 2032
- Table 14: Brazil Scrubbing Sand Revenue (million) Forecast, by Application 2019 & 2032
- Table 15: Argentina Scrubbing Sand Revenue (million) Forecast, by Application 2019 & 2032
- Table 16: Rest of South America Scrubbing Sand Revenue (million) Forecast, by Application 2019 & 2032
- Table 17: Global Scrubbing Sand Revenue million Forecast, by Application 2019 & 2032
- Table 18: Global Scrubbing Sand Revenue million Forecast, by Types 2019 & 2032
- Table 19: Global Scrubbing Sand Revenue million Forecast, by Country 2019 & 2032
- Table 20: United Kingdom Scrubbing Sand Revenue (million) Forecast, by Application 2019 & 2032
- Table 21: Germany Scrubbing Sand Revenue (million) Forecast, by Application 2019 & 2032
- Table 22: France Scrubbing Sand Revenue (million) Forecast, by Application 2019 & 2032
- Table 23: Italy Scrubbing Sand Revenue (million) Forecast, by Application 2019 & 2032
- Table 24: Spain Scrubbing Sand Revenue (million) Forecast, by Application 2019 & 2032
- Table 25: Russia Scrubbing Sand Revenue (million) Forecast, by Application 2019 & 2032
- Table 26: Benelux Scrubbing Sand Revenue (million) Forecast, by Application 2019 & 2032
- Table 27: Nordics Scrubbing Sand Revenue (million) Forecast, by Application 2019 & 2032
- Table 28: Rest of Europe Scrubbing Sand Revenue (million) Forecast, by Application 2019 & 2032
- Table 29: Global Scrubbing Sand Revenue million Forecast, by Application 2019 & 2032
- Table 30: Global Scrubbing Sand Revenue million Forecast, by Types 2019 & 2032
- Table 31: Global Scrubbing Sand Revenue million Forecast, by Country 2019 & 2032
- Table 32: Turkey Scrubbing Sand Revenue (million) Forecast, by Application 2019 & 2032
- Table 33: Israel Scrubbing Sand Revenue (million) Forecast, by Application 2019 & 2032
- Table 34: GCC Scrubbing Sand Revenue (million) Forecast, by Application 2019 & 2032
- Table 35: North Africa Scrubbing Sand Revenue (million) Forecast, by Application 2019 & 2032
- Table 36: South Africa Scrubbing Sand Revenue (million) Forecast, by Application 2019 & 2032
- Table 37: Rest of Middle East & Africa Scrubbing Sand Revenue (million) Forecast, by Application 2019 & 2032
- Table 38: Global Scrubbing Sand Revenue million Forecast, by Application 2019 & 2032
- Table 39: Global Scrubbing Sand Revenue million Forecast, by Types 2019 & 2032
- Table 40: Global Scrubbing Sand Revenue million Forecast, by Country 2019 & 2032
- Table 41: China Scrubbing Sand Revenue (million) Forecast, by Application 2019 & 2032
- Table 42: India Scrubbing Sand Revenue (million) Forecast, by Application 2019 & 2032
- Table 43: Japan Scrubbing Sand Revenue (million) Forecast, by Application 2019 & 2032
- Table 44: South Korea Scrubbing Sand Revenue (million) Forecast, by Application 2019 & 2032
- Table 45: ASEAN Scrubbing Sand Revenue (million) Forecast, by Application 2019 & 2032
- Table 46: Oceania Scrubbing Sand Revenue (million) Forecast, by Application 2019 & 2032
- Table 47: Rest of Asia Pacific Scrubbing Sand Revenue (million) Forecast, by Application 2019 & 2032
Frequently Asked Questions
1. What is the projected Compound Annual Growth Rate (CAGR) of the Scrubbing Sand?
The projected CAGR is approximately XX%.
2. Which companies are prominent players in the Scrubbing Sand?
Key companies in the market include Covia, US Silica, Hi-Crush, Badger Mining Corp, Emerge Energy Services, Sibelco, Preferred Proppants, Pattison Sand, Quarzwerke Group, Chongqing Changjiang River Moulding Material, Tongliao Tiancheng Foundry Material, Tongliao Yongxin Silica Sand.
3. What are the main segments of the Scrubbing Sand?
The market segments include Application, Types.
4. Can you provide details about the market size?
The market size is estimated to be USD XXX million as of 2022.
5. What are some drivers contributing to market growth?
N/A
6. What are the notable trends driving market growth?
N/A
7. Are there any restraints impacting market growth?
N/A
8. Can you provide examples of recent developments in the market?
N/A
9. What pricing options are available for accessing the report?
Pricing options include single-user, multi-user, and enterprise licenses priced at USD 4900.00, USD 7350.00, and USD 9800.00 respectively.
10. Is the market size provided in terms of value or volume?
The market size is provided in terms of value, measured in million.
11. Are there any specific market keywords associated with the report?
Yes, the market keyword associated with the report is "Scrubbing Sand," which aids in identifying and referencing the specific market segment covered.
12. How do I determine which pricing option suits my needs best?
The pricing options vary based on user requirements and access needs. Individual users may opt for single-user licenses, while businesses requiring broader access may choose multi-user or enterprise licenses for cost-effective access to the report.
13. Are there any additional resources or data provided in the Scrubbing Sand report?
While the report offers comprehensive insights, it's advisable to review the specific contents or supplementary materials provided to ascertain if additional resources or data are available.
14. How can I stay updated on further developments or reports in the Scrubbing Sand?
To stay informed about further developments, trends, and reports in the Scrubbing Sand, consider subscribing to industry newsletters, following relevant companies and organizations, or regularly checking reputable industry news sources and publications.
Methodology
Step 1 - Identification of Relevant Samples Size from Population Database


Step 2 - Approaches for Defining Global Market Size (Value, Volume* & Price*)

Note*: In applicable scenarios
Step 3 - Data Sources
Primary Research
- Web Analytics
- Survey Reports
- Research Institute
- Latest Research Reports
- Opinion Leaders
Secondary Research
- Annual Reports
- White Paper
- Latest Press Release
- Industry Association
- Paid Database
- Investor Presentations

Step 4 - Data Triangulation
Involves using different sources of information in order to increase the validity of a study
These sources are likely to be stakeholders in a program - participants, other researchers, program staff, other community members, and so on.
Then we put all data in single framework & apply various statistical tools to find out the dynamic on the market.
During the analysis stage, feedback from the stakeholder groups would be compared to determine areas of agreement as well as areas of divergence


