
Key Insights
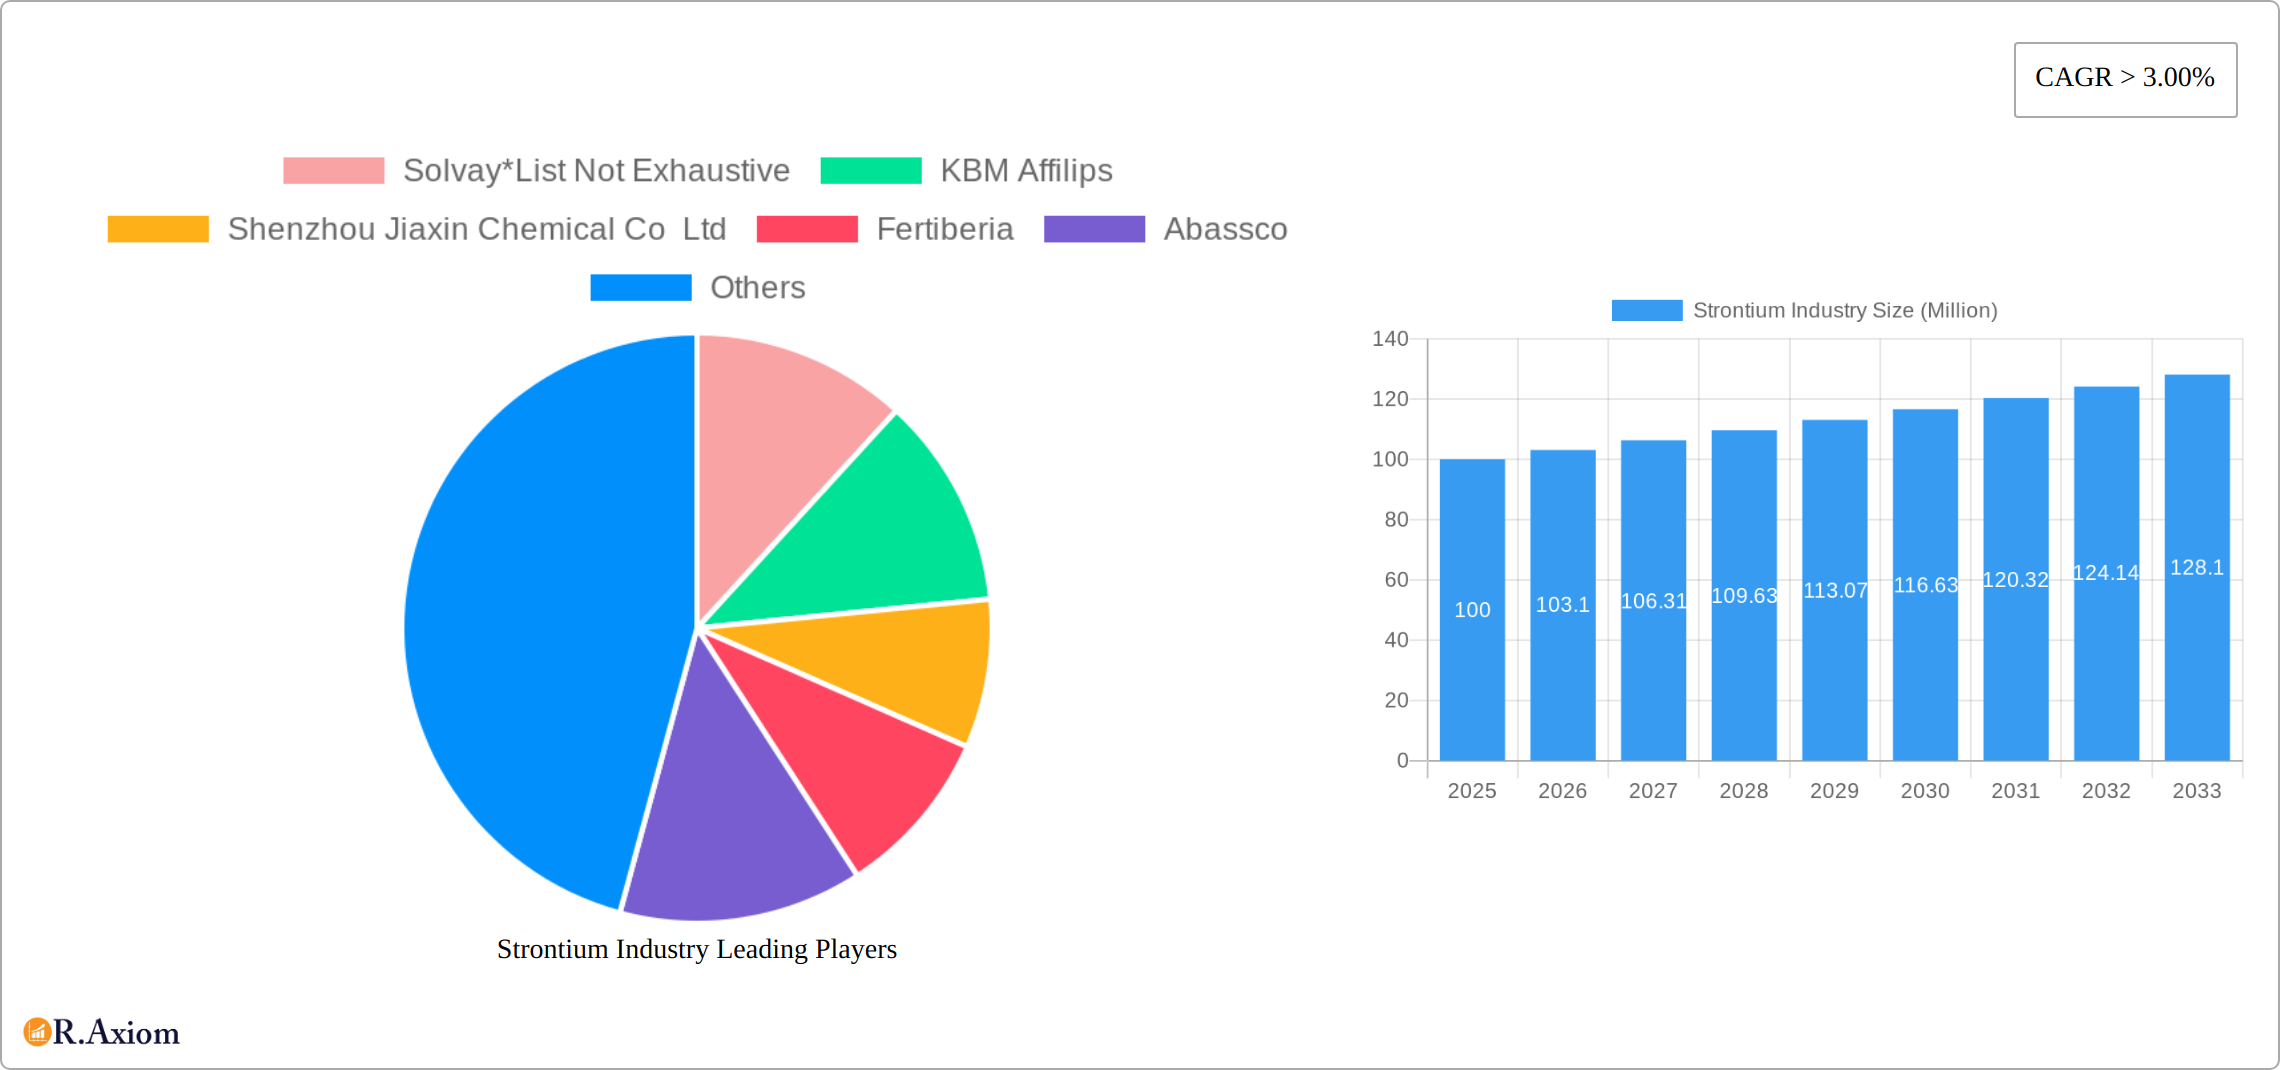
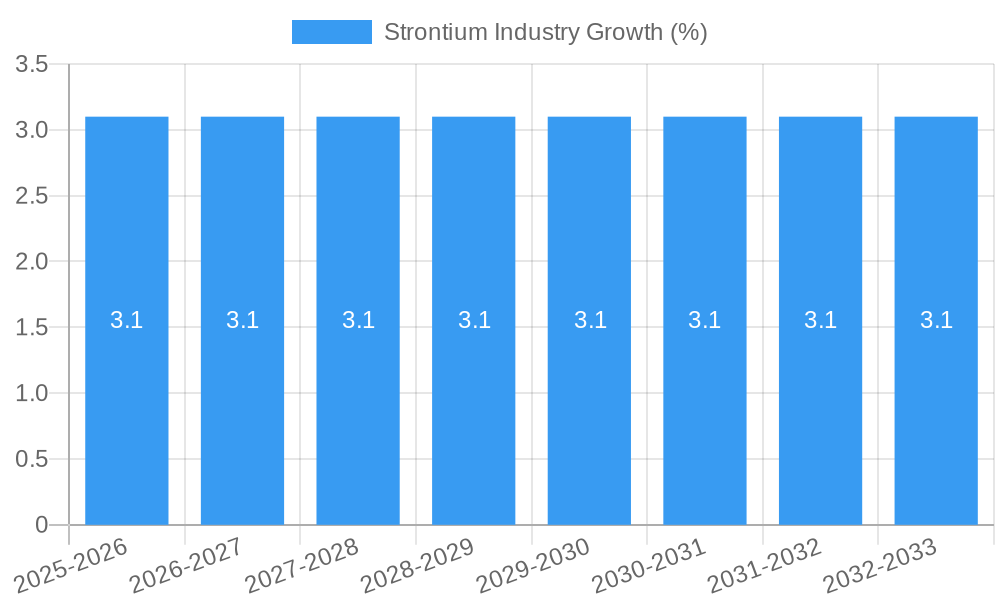
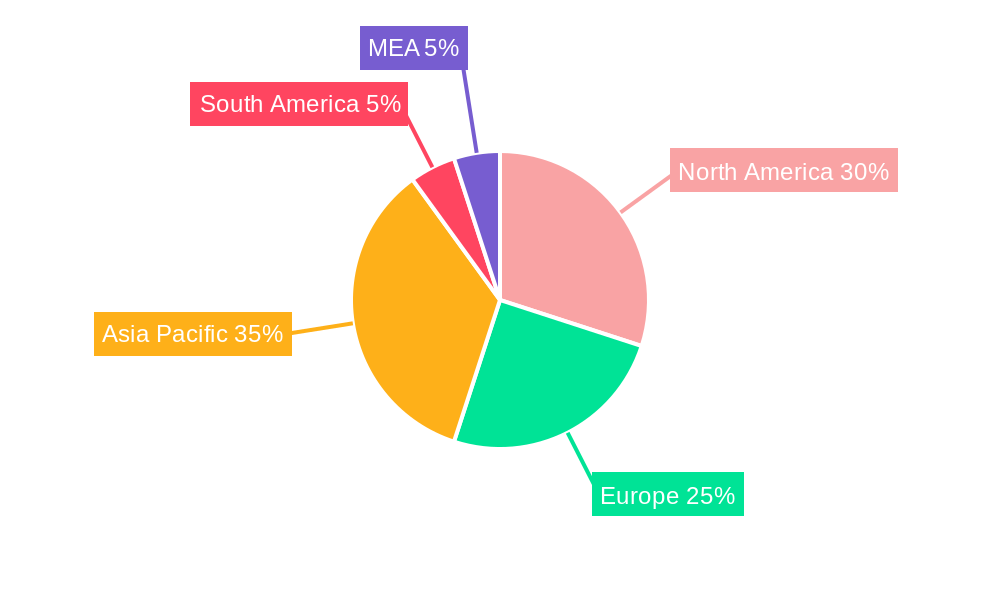
The strontium market, currently valued at $100 million in 2025, exhibits robust growth potential, projected to expand at a CAGR exceeding 3% from 2025 to 2033. This growth is fueled by increasing demand across diverse applications, primarily driven by the electronics and medical sectors. The rising adoption of strontium carbonate and strontium sulfate in electronic components, such as capacitors and cathode ray tubes, significantly contributes to market expansion. Simultaneously, the growing use of strontium compounds in medical applications, including dental materials and diagnostic imaging, further fuels market growth. While the paints and coatings sector provides a notable application segment, the relatively slower growth in this area compared to electronics and medical applications might slightly moderate the overall market CAGR. Other contributing factors include the use of strontium in pyrotechnics and certain specialized glass and ceramic applications. However, potential supply chain disruptions and fluctuations in raw material prices pose challenges that could slightly restrain market growth. The market is segmented by product type (strontium carbonate, strontium sulfate, strontium nitrate, and other products like strontium hydroxide) and application (electrical & electronics, medical & dental, paints & coatings, personal care, pyrotechnics, and other applications). Geographical distribution shows a diverse landscape, with North America and Asia Pacific anticipated to be major contributors to the market's overall growth, driven by strong technological advancements and burgeoning industrial activities in these regions.
The competitive landscape of the strontium market is moderately concentrated, with key players such as Solvay, KBM Affilips, and several Chinese manufacturers holding significant market share. However, the presence of numerous smaller players suggests opportunities for market entrants with specialized products or regional focus. Future market growth will likely be shaped by technological advancements leading to more efficient strontium extraction and processing methods, alongside the development of new applications in emerging sectors. Regulatory landscape and environmental considerations concerning strontium mining and processing will also play a significant role in shaping the industry's trajectory. Continued investment in research and development focused on sustainable and environmentally friendly strontium production methods is expected to further enhance market growth and sustainability.
Strontium Industry: A Comprehensive Market Report (2019-2033)
This in-depth report provides a comprehensive analysis of the Strontium industry, covering market size, segmentation, growth drivers, challenges, and key players. The study period spans from 2019 to 2033, with a base year of 2025 and a forecast period of 2025-2033. The report leverages extensive primary and secondary research to deliver actionable insights for industry stakeholders, investors, and businesses operating within this dynamic sector. The market is valued at xx Million in 2025 and is projected to reach xx Million by 2033, exhibiting a CAGR of xx%.
Strontium Industry Market Concentration & Innovation
The Strontium industry exhibits a moderately concentrated market structure, with a few major players holding significant market share. Solvay, for example, commands a substantial portion, while other key players such as KBM Affilips, Shenzhou Jiaxin Chemical Co Ltd, and Fertiberia contribute significantly. However, the market also accommodates several smaller, regional players, resulting in a diverse competitive landscape.
- Market Share: Solvay holds an estimated xx% market share in 2025. The top 5 players collectively account for approximately xx% of the global market.
- Innovation Drivers: Ongoing research and development in materials science, coupled with the demand for advanced materials in various applications, drive innovation. This includes the development of high-purity Strontium compounds and novel applications tailored to specific industry needs.
- Regulatory Frameworks: Stringent environmental regulations concerning the production and disposal of Strontium-based materials influence industry practices and encourage the adoption of sustainable production methods.
- Product Substitutes: While few direct substitutes exist for Strontium in specific applications, alternative materials may be considered based on cost or performance characteristics in some niche markets.
- End-User Trends: Growing demand from the electrical and electronics sector, driven by advancements in technology and the expansion of the global electronics market, is a major driver of Strontium consumption.
- M&A Activities: While the frequency of mergers and acquisitions (M&A) may vary, the industry has witnessed several significant deals in recent years, primarily driven by strategies to expand market reach, enhance product portfolios, and achieve cost synergies. The average M&A deal value is estimated to be around xx Million.
Strontium Industry Industry Trends & Insights
The Strontium industry is experiencing robust growth, propelled by several key factors. The increasing demand for high-performance materials in electronics, especially in energy storage applications, fuels significant growth. Technological advancements lead to innovations in Strontium compound synthesis and processing, resulting in improved product performance and cost-effectiveness. Consumer preferences for eco-friendly products are driving the demand for sustainable Strontium production processes. Furthermore, competitive dynamics, characterized by both collaboration and rivalry among key players, contribute to market expansion and innovation. The market exhibits a notable shift towards specialized applications, leading to increased product diversification and market segmentation.
Dominant Markets & Segments in Strontium Industry
Leading Region/Country: China dominates the Strontium market due to its large-scale production capacity and substantial downstream industries.
Dominant Product Segments:
- Strontium Carbonate: This remains the largest segment, primarily due to its extensive use in the glass and ceramics industries and as a precursor for other Strontium compounds.
- Strontium Sulfate: Significant growth is observed in this segment, driven by increased demand from the paints and coatings sector.
- Strontium Nitrate: This segment exhibits moderate growth, primarily fueled by demand from pyrotechnic applications.
- Other Products (Strontium Hydroxide): This segment shows steady growth, driven by applications in niche areas.
Dominant Application Segments:
- Electrical and Electronics: This is the fastest-growing application segment, driven by the expansion of the electronics industry and the adoption of Strontium-based materials in high-performance components.
- Medical and Dental: This segment showcases steady growth, attributable to the use of Strontium compounds in dental materials and medical imaging.
- Paints and Coatings: Demand for Strontium sulfate in this sector contributes to consistent growth.
- Personal Care: This segment holds a niche market share.
- Pyrotechnics: The pyrotechnic industry contributes significantly to Strontium nitrate consumption.
- Other Applications (Glass and Ceramics): This is a substantial segment, driven by traditional applications in glass manufacturing.
Key drivers for these dominant segments include favorable economic policies supporting industrial growth in key regions, and advancements in manufacturing technologies leading to cost reduction and improved product quality.
Strontium Industry Product Developments
Recent innovations in the strontium industry are focused on significantly enhancing the purity and performance characteristics of strontium compounds. This drive is fueled by the increasingly stringent demands of high-tech applications, particularly within the electronics and medical sectors. New synthesis methods are enabling the production of strontium materials with precisely tailored properties, resulting in superior product performance and a stronger competitive edge. This includes advancements in nanoparticle synthesis for enhanced functionality in specialized applications. The focus is not only on improved purity but also on developing more cost-effective and sustainable production processes.
Report Scope & Segmentation Analysis
This report provides a comprehensive segmentation of the strontium market, categorized by product type (Strontium Carbonate, Strontium Sulfate, Strontium Nitrate, and Other Products) and application (Electrical and electronics, Medical and Dental, Paints and Coatings, Personal Care, Pyrotechnics, and Other Applications). Each segment undergoes detailed analysis, encompassing market size estimations, growth projections, and a thorough examination of the competitive landscape. The report highlights the significant growth potential within the electronics sector, particularly in applications requiring high-purity strontium compounds, as well as the expanding medical and renewable energy markets. Specific market share data for key players and regional breakdowns are also included.
Key Drivers of Strontium Industry Growth
Several factors drive the Strontium industry's growth: increasing demand from the electronics industry, particularly for energy storage solutions; technological advancements in materials science leading to the development of high-performance Strontium-based materials; expansion of application areas in niche sectors like medicine and personal care; and favorable government policies supporting the development of the chemical industry in certain regions.
Challenges in the Strontium Industry Sector
Challenges include fluctuating raw material prices, environmental regulations regarding Strontium compound production and disposal, intense competition from other materials in specific applications, and potential supply chain disruptions due to geopolitical factors. These factors can significantly impact profitability and market stability.
Emerging Opportunities in Strontium Industry
The strontium industry is witnessing the emergence of exciting new opportunities. These include the development of innovative strontium-based materials for next-generation electronics, such as advanced energy storage solutions and high-performance displays. Expanding into emerging markets, particularly in Asia and developing economies, presents significant growth potential. Furthermore, a strong focus on sustainable and environmentally friendly production methods is crucial for compliance with increasingly strict environmental regulations and for attracting environmentally conscious customers. The potential for new applications in advanced materials, green technologies, and even within the realm of quantum computing offers incredibly promising prospects for the future of the industry. Research and development efforts focusing on these areas are key to unlocking this potential.
Leading Players in the Strontium Industry Market
- Solvay
- KBM Affilips
- Shenzhou Jiaxin Chemical Co Ltd
- Fertiberia
- Abassco
- Shijiazhuang Zhengding JINSHI Chemical Co Ltd
- Nanjing Jinyan Strontium Industry Co Ltd
- Joyieng Chemical Limited
- SAKAI CHEMICAL INDUSTRY CO LTD
- Hebei Xinji Chemical Group Co Ltd
- ProChem Inc
- Barium & Chemicals Inc
- Noah Chemicals
- Chongqing Yuanhe Fine Chemicals Inc
Key Developments in Strontium Industry Industry
- October 2023: ProChem Inc. joined the Society of Chemical Manufacturers & Affiliates (SOCMA). This membership significantly enhances ProChem's access to industry best practices, crucial regulatory support, and valuable networking opportunities. This strategic move is expected to improve its market position and competitiveness within the specialty chemicals sector, fostering growth and collaboration.
- [Add other key developments here with dates and brief descriptions. For example, new product launches, partnerships, acquisitions, etc.]
Strategic Outlook for Strontium Industry Market
The strontium industry is poised for sustained growth, driven by several key factors. Technological advancements are continuously expanding the applications of strontium compounds, and the demand for high-performance materials continues to rise across diverse sectors. Developing sustainable production processes and exploring innovative applications in areas such as electronics and renewable energy technologies are critical for long-term success. Strategic partnerships, collaborations, and substantial investments in research and development will be essential for companies to thrive in this increasingly competitive landscape. The industry's future hinges on adapting to evolving market needs and embracing innovation to maintain a leading position.
Strontium Industry Segmentation
-
1. Product
- 1.1. Strontium Carbonate
- 1.2. Strontium Sulfate
- 1.3. Strontium Nitrate
- 1.4. Other Products (Strontium Hydroxide)
-
2. Application
- 2.1. Electrical and electronics
- 2.2. Medical and Dental
- 2.3. Paints and Coatings
- 2.4. Personal Care
- 2.5. Pyrotechnic
- 2.6. Other Applications (Glass and Ceramics)
Strontium Industry Segmentation By Geography
- 1. China
- 2. India
- 3. Japan
- 4. South Korea
- 5. Thailand
- 6. Malaysia
- 7. Indonesia
- 8. Vietnam
-
9. Rest of Asia Pacific
- 9.1. North America
- 10. United States
- 11. Canada
-
12. Mexico
- 12.1. Europe
- 13. Germany
- 14. United Kingdom
- 15. Italy
- 16. France
- 17. Spain
- 18. Turkey
- 19. Russia
- 20. NORDIC
-
21. Rest of Europe
- 21.1. South America
- 22. Brazil
- 23. Argentina
- 24. Colombia
-
25. Rest of South America
- 25.1. Middle East and Africa
- 26. Saudi Arabia
- 27. South Africa
- 28. Nigeria
- 29. Egypt
- 30. Qatar
- 31. United Arab Emirates
- 32. Rest of Middle East and Africa
Strontium Industry REPORT HIGHLIGHTS
| Aspects | Details |
|---|---|
| Study Period | 2019-2033 |
| Base Year | 2024 |
| Estimated Year | 2025 |
| Forecast Period | 2025-2033 |
| Historical Period | 2019-2024 |
| Growth Rate | CAGR of > 3.00% from 2019-2033 |
| Segmentation |
|
Table of Contents
- 1. Introduction
- 1.1. Research Scope
- 1.2. Market Segmentation
- 1.3. Research Methodology
- 1.4. Definitions and Assumptions
- 2. Executive Summary
- 2.1. Introduction
- 3. Market Dynamics
- 3.1. Introduction
- 3.2. Market Drivers
- 3.2.1. Increased Demand from the Paints and Coatings Segment; Increasing Construction Activities in Emerging Economies of Asia-Pacific
- 3.3. Market Restrains
- 3.3.1. Risk of Explosion and Fire Hazards Associated with Strontium; Other Restraints
- 3.4. Market Trends
- 3.4.1. Paints and Coatings Segment to Dominate the Market
- 4. Market Factor Analysis
- 4.1. Porters Five Forces
- 4.2. Supply/Value Chain
- 4.3. PESTEL analysis
- 4.4. Market Entropy
- 4.5. Patent/Trademark Analysis
- 5. Global Strontium Industry Analysis, Insights and Forecast, 2019-2031
- 5.1. Market Analysis, Insights and Forecast - by Product
- 5.1.1. Strontium Carbonate
- 5.1.2. Strontium Sulfate
- 5.1.3. Strontium Nitrate
- 5.1.4. Other Products (Strontium Hydroxide)
- 5.2. Market Analysis, Insights and Forecast - by Application
- 5.2.1. Electrical and electronics
- 5.2.2. Medical and Dental
- 5.2.3. Paints and Coatings
- 5.2.4. Personal Care
- 5.2.5. Pyrotechnic
- 5.2.6. Other Applications (Glass and Ceramics)
- 5.3. Market Analysis, Insights and Forecast - by Region
- 5.3.1. China
- 5.3.2. India
- 5.3.3. Japan
- 5.3.4. South Korea
- 5.3.5. Thailand
- 5.3.6. Malaysia
- 5.3.7. Indonesia
- 5.3.8. Vietnam
- 5.3.9. Rest of Asia Pacific
- 5.3.10. United States
- 5.3.11. Canada
- 5.3.12. Mexico
- 5.3.13. Germany
- 5.3.14. United Kingdom
- 5.3.15. Italy
- 5.3.16. France
- 5.3.17. Spain
- 5.3.18. Turkey
- 5.3.19. Russia
- 5.3.20. NORDIC
- 5.3.21. Rest of Europe
- 5.3.22. Brazil
- 5.3.23. Argentina
- 5.3.24. Colombia
- 5.3.25. Rest of South America
- 5.3.26. Saudi Arabia
- 5.3.27. South Africa
- 5.3.28. Nigeria
- 5.3.29. Egypt
- 5.3.30. Qatar
- 5.3.31. United Arab Emirates
- 5.3.32. Rest of Middle East and Africa
- 5.1. Market Analysis, Insights and Forecast - by Product
- 6. China Strontium Industry Analysis, Insights and Forecast, 2019-2031
- 6.1. Market Analysis, Insights and Forecast - by Product
- 6.1.1. Strontium Carbonate
- 6.1.2. Strontium Sulfate
- 6.1.3. Strontium Nitrate
- 6.1.4. Other Products (Strontium Hydroxide)
- 6.2. Market Analysis, Insights and Forecast - by Application
- 6.2.1. Electrical and electronics
- 6.2.2. Medical and Dental
- 6.2.3. Paints and Coatings
- 6.2.4. Personal Care
- 6.2.5. Pyrotechnic
- 6.2.6. Other Applications (Glass and Ceramics)
- 6.1. Market Analysis, Insights and Forecast - by Product
- 7. India Strontium Industry Analysis, Insights and Forecast, 2019-2031
- 7.1. Market Analysis, Insights and Forecast - by Product
- 7.1.1. Strontium Carbonate
- 7.1.2. Strontium Sulfate
- 7.1.3. Strontium Nitrate
- 7.1.4. Other Products (Strontium Hydroxide)
- 7.2. Market Analysis, Insights and Forecast - by Application
- 7.2.1. Electrical and electronics
- 7.2.2. Medical and Dental
- 7.2.3. Paints and Coatings
- 7.2.4. Personal Care
- 7.2.5. Pyrotechnic
- 7.2.6. Other Applications (Glass and Ceramics)
- 7.1. Market Analysis, Insights and Forecast - by Product
- 8. Japan Strontium Industry Analysis, Insights and Forecast, 2019-2031
- 8.1. Market Analysis, Insights and Forecast - by Product
- 8.1.1. Strontium Carbonate
- 8.1.2. Strontium Sulfate
- 8.1.3. Strontium Nitrate
- 8.1.4. Other Products (Strontium Hydroxide)
- 8.2. Market Analysis, Insights and Forecast - by Application
- 8.2.1. Electrical and electronics
- 8.2.2. Medical and Dental
- 8.2.3. Paints and Coatings
- 8.2.4. Personal Care
- 8.2.5. Pyrotechnic
- 8.2.6. Other Applications (Glass and Ceramics)
- 8.1. Market Analysis, Insights and Forecast - by Product
- 9. South Korea Strontium Industry Analysis, Insights and Forecast, 2019-2031
- 9.1. Market Analysis, Insights and Forecast - by Product
- 9.1.1. Strontium Carbonate
- 9.1.2. Strontium Sulfate
- 9.1.3. Strontium Nitrate
- 9.1.4. Other Products (Strontium Hydroxide)
- 9.2. Market Analysis, Insights and Forecast - by Application
- 9.2.1. Electrical and electronics
- 9.2.2. Medical and Dental
- 9.2.3. Paints and Coatings
- 9.2.4. Personal Care
- 9.2.5. Pyrotechnic
- 9.2.6. Other Applications (Glass and Ceramics)
- 9.1. Market Analysis, Insights and Forecast - by Product
- 10. Thailand Strontium Industry Analysis, Insights and Forecast, 2019-2031
- 10.1. Market Analysis, Insights and Forecast - by Product
- 10.1.1. Strontium Carbonate
- 10.1.2. Strontium Sulfate
- 10.1.3. Strontium Nitrate
- 10.1.4. Other Products (Strontium Hydroxide)
- 10.2. Market Analysis, Insights and Forecast - by Application
- 10.2.1. Electrical and electronics
- 10.2.2. Medical and Dental
- 10.2.3. Paints and Coatings
- 10.2.4. Personal Care
- 10.2.5. Pyrotechnic
- 10.2.6. Other Applications (Glass and Ceramics)
- 10.1. Market Analysis, Insights and Forecast - by Product
- 11. Malaysia Strontium Industry Analysis, Insights and Forecast, 2019-2031
- 11.1. Market Analysis, Insights and Forecast - by Product
- 11.1.1. Strontium Carbonate
- 11.1.2. Strontium Sulfate
- 11.1.3. Strontium Nitrate
- 11.1.4. Other Products (Strontium Hydroxide)
- 11.2. Market Analysis, Insights and Forecast - by Application
- 11.2.1. Electrical and electronics
- 11.2.2. Medical and Dental
- 11.2.3. Paints and Coatings
- 11.2.4. Personal Care
- 11.2.5. Pyrotechnic
- 11.2.6. Other Applications (Glass and Ceramics)
- 11.1. Market Analysis, Insights and Forecast - by Product
- 12. Indonesia Strontium Industry Analysis, Insights and Forecast, 2019-2031
- 12.1. Market Analysis, Insights and Forecast - by Product
- 12.1.1. Strontium Carbonate
- 12.1.2. Strontium Sulfate
- 12.1.3. Strontium Nitrate
- 12.1.4. Other Products (Strontium Hydroxide)
- 12.2. Market Analysis, Insights and Forecast - by Application
- 12.2.1. Electrical and electronics
- 12.2.2. Medical and Dental
- 12.2.3. Paints and Coatings
- 12.2.4. Personal Care
- 12.2.5. Pyrotechnic
- 12.2.6. Other Applications (Glass and Ceramics)
- 12.1. Market Analysis, Insights and Forecast - by Product
- 13. Vietnam Strontium Industry Analysis, Insights and Forecast, 2019-2031
- 13.1. Market Analysis, Insights and Forecast - by Product
- 13.1.1. Strontium Carbonate
- 13.1.2. Strontium Sulfate
- 13.1.3. Strontium Nitrate
- 13.1.4. Other Products (Strontium Hydroxide)
- 13.2. Market Analysis, Insights and Forecast - by Application
- 13.2.1. Electrical and electronics
- 13.2.2. Medical and Dental
- 13.2.3. Paints and Coatings
- 13.2.4. Personal Care
- 13.2.5. Pyrotechnic
- 13.2.6. Other Applications (Glass and Ceramics)
- 13.1. Market Analysis, Insights and Forecast - by Product
- 14. Rest of Asia Pacific Strontium Industry Analysis, Insights and Forecast, 2019-2031
- 14.1. Market Analysis, Insights and Forecast - by Product
- 14.1.1. Strontium Carbonate
- 14.1.2. Strontium Sulfate
- 14.1.3. Strontium Nitrate
- 14.1.4. Other Products (Strontium Hydroxide)
- 14.2. Market Analysis, Insights and Forecast - by Application
- 14.2.1. Electrical and electronics
- 14.2.2. Medical and Dental
- 14.2.3. Paints and Coatings
- 14.2.4. Personal Care
- 14.2.5. Pyrotechnic
- 14.2.6. Other Applications (Glass and Ceramics)
- 14.1. Market Analysis, Insights and Forecast - by Product
- 15. United States Strontium Industry Analysis, Insights and Forecast, 2019-2031
- 15.1. Market Analysis, Insights and Forecast - by Product
- 15.1.1. Strontium Carbonate
- 15.1.2. Strontium Sulfate
- 15.1.3. Strontium Nitrate
- 15.1.4. Other Products (Strontium Hydroxide)
- 15.2. Market Analysis, Insights and Forecast - by Application
- 15.2.1. Electrical and electronics
- 15.2.2. Medical and Dental
- 15.2.3. Paints and Coatings
- 15.2.4. Personal Care
- 15.2.5. Pyrotechnic
- 15.2.6. Other Applications (Glass and Ceramics)
- 15.1. Market Analysis, Insights and Forecast - by Product
- 16. Canada Strontium Industry Analysis, Insights and Forecast, 2019-2031
- 16.1. Market Analysis, Insights and Forecast - by Product
- 16.1.1. Strontium Carbonate
- 16.1.2. Strontium Sulfate
- 16.1.3. Strontium Nitrate
- 16.1.4. Other Products (Strontium Hydroxide)
- 16.2. Market Analysis, Insights and Forecast - by Application
- 16.2.1. Electrical and electronics
- 16.2.2. Medical and Dental
- 16.2.3. Paints and Coatings
- 16.2.4. Personal Care
- 16.2.5. Pyrotechnic
- 16.2.6. Other Applications (Glass and Ceramics)
- 16.1. Market Analysis, Insights and Forecast - by Product
- 17. Mexico Strontium Industry Analysis, Insights and Forecast, 2019-2031
- 17.1. Market Analysis, Insights and Forecast - by Product
- 17.1.1. Strontium Carbonate
- 17.1.2. Strontium Sulfate
- 17.1.3. Strontium Nitrate
- 17.1.4. Other Products (Strontium Hydroxide)
- 17.2. Market Analysis, Insights and Forecast - by Application
- 17.2.1. Electrical and electronics
- 17.2.2. Medical and Dental
- 17.2.3. Paints and Coatings
- 17.2.4. Personal Care
- 17.2.5. Pyrotechnic
- 17.2.6. Other Applications (Glass and Ceramics)
- 17.1. Market Analysis, Insights and Forecast - by Product
- 18. Germany Strontium Industry Analysis, Insights and Forecast, 2019-2031
- 18.1. Market Analysis, Insights and Forecast - by Product
- 18.1.1. Strontium Carbonate
- 18.1.2. Strontium Sulfate
- 18.1.3. Strontium Nitrate
- 18.1.4. Other Products (Strontium Hydroxide)
- 18.2. Market Analysis, Insights and Forecast - by Application
- 18.2.1. Electrical and electronics
- 18.2.2. Medical and Dental
- 18.2.3. Paints and Coatings
- 18.2.4. Personal Care
- 18.2.5. Pyrotechnic
- 18.2.6. Other Applications (Glass and Ceramics)
- 18.1. Market Analysis, Insights and Forecast - by Product
- 19. United Kingdom Strontium Industry Analysis, Insights and Forecast, 2019-2031
- 19.1. Market Analysis, Insights and Forecast - by Product
- 19.1.1. Strontium Carbonate
- 19.1.2. Strontium Sulfate
- 19.1.3. Strontium Nitrate
- 19.1.4. Other Products (Strontium Hydroxide)
- 19.2. Market Analysis, Insights and Forecast - by Application
- 19.2.1. Electrical and electronics
- 19.2.2. Medical and Dental
- 19.2.3. Paints and Coatings
- 19.2.4. Personal Care
- 19.2.5. Pyrotechnic
- 19.2.6. Other Applications (Glass and Ceramics)
- 19.1. Market Analysis, Insights and Forecast - by Product
- 20. Italy Strontium Industry Analysis, Insights and Forecast, 2019-2031
- 20.1. Market Analysis, Insights and Forecast - by Product
- 20.1.1. Strontium Carbonate
- 20.1.2. Strontium Sulfate
- 20.1.3. Strontium Nitrate
- 20.1.4. Other Products (Strontium Hydroxide)
- 20.2. Market Analysis, Insights and Forecast - by Application
- 20.2.1. Electrical and electronics
- 20.2.2. Medical and Dental
- 20.2.3. Paints and Coatings
- 20.2.4. Personal Care
- 20.2.5. Pyrotechnic
- 20.2.6. Other Applications (Glass and Ceramics)
- 20.1. Market Analysis, Insights and Forecast - by Product
- 21. France Strontium Industry Analysis, Insights and Forecast, 2019-2031
- 21.1. Market Analysis, Insights and Forecast - by Product
- 21.1.1. Strontium Carbonate
- 21.1.2. Strontium Sulfate
- 21.1.3. Strontium Nitrate
- 21.1.4. Other Products (Strontium Hydroxide)
- 21.2. Market Analysis, Insights and Forecast - by Application
- 21.2.1. Electrical and electronics
- 21.2.2. Medical and Dental
- 21.2.3. Paints and Coatings
- 21.2.4. Personal Care
- 21.2.5. Pyrotechnic
- 21.2.6. Other Applications (Glass and Ceramics)
- 21.1. Market Analysis, Insights and Forecast - by Product
- 22. Spain Strontium Industry Analysis, Insights and Forecast, 2019-2031
- 22.1. Market Analysis, Insights and Forecast - by Product
- 22.1.1. Strontium Carbonate
- 22.1.2. Strontium Sulfate
- 22.1.3. Strontium Nitrate
- 22.1.4. Other Products (Strontium Hydroxide)
- 22.2. Market Analysis, Insights and Forecast - by Application
- 22.2.1. Electrical and electronics
- 22.2.2. Medical and Dental
- 22.2.3. Paints and Coatings
- 22.2.4. Personal Care
- 22.2.5. Pyrotechnic
- 22.2.6. Other Applications (Glass and Ceramics)
- 22.1. Market Analysis, Insights and Forecast - by Product
- 23. Turkey Strontium Industry Analysis, Insights and Forecast, 2019-2031
- 23.1. Market Analysis, Insights and Forecast - by Product
- 23.1.1. Strontium Carbonate
- 23.1.2. Strontium Sulfate
- 23.1.3. Strontium Nitrate
- 23.1.4. Other Products (Strontium Hydroxide)
- 23.2. Market Analysis, Insights and Forecast - by Application
- 23.2.1. Electrical and electronics
- 23.2.2. Medical and Dental
- 23.2.3. Paints and Coatings
- 23.2.4. Personal Care
- 23.2.5. Pyrotechnic
- 23.2.6. Other Applications (Glass and Ceramics)
- 23.1. Market Analysis, Insights and Forecast - by Product
- 24. Russia Strontium Industry Analysis, Insights and Forecast, 2019-2031
- 24.1. Market Analysis, Insights and Forecast - by Product
- 24.1.1. Strontium Carbonate
- 24.1.2. Strontium Sulfate
- 24.1.3. Strontium Nitrate
- 24.1.4. Other Products (Strontium Hydroxide)
- 24.2. Market Analysis, Insights and Forecast - by Application
- 24.2.1. Electrical and electronics
- 24.2.2. Medical and Dental
- 24.2.3. Paints and Coatings
- 24.2.4. Personal Care
- 24.2.5. Pyrotechnic
- 24.2.6. Other Applications (Glass and Ceramics)
- 24.1. Market Analysis, Insights and Forecast - by Product
- 25. NORDIC Strontium Industry Analysis, Insights and Forecast, 2019-2031
- 25.1. Market Analysis, Insights and Forecast - by Product
- 25.1.1. Strontium Carbonate
- 25.1.2. Strontium Sulfate
- 25.1.3. Strontium Nitrate
- 25.1.4. Other Products (Strontium Hydroxide)
- 25.2. Market Analysis, Insights and Forecast - by Application
- 25.2.1. Electrical and electronics
- 25.2.2. Medical and Dental
- 25.2.3. Paints and Coatings
- 25.2.4. Personal Care
- 25.2.5. Pyrotechnic
- 25.2.6. Other Applications (Glass and Ceramics)
- 25.1. Market Analysis, Insights and Forecast - by Product
- 26. Rest of Europe Strontium Industry Analysis, Insights and Forecast, 2019-2031
- 26.1. Market Analysis, Insights and Forecast - by Product
- 26.1.1. Strontium Carbonate
- 26.1.2. Strontium Sulfate
- 26.1.3. Strontium Nitrate
- 26.1.4. Other Products (Strontium Hydroxide)
- 26.2. Market Analysis, Insights and Forecast - by Application
- 26.2.1. Electrical and electronics
- 26.2.2. Medical and Dental
- 26.2.3. Paints and Coatings
- 26.2.4. Personal Care
- 26.2.5. Pyrotechnic
- 26.2.6. Other Applications (Glass and Ceramics)
- 26.1. Market Analysis, Insights and Forecast - by Product
- 27. Brazil Strontium Industry Analysis, Insights and Forecast, 2019-2031
- 27.1. Market Analysis, Insights and Forecast - by Product
- 27.1.1. Strontium Carbonate
- 27.1.2. Strontium Sulfate
- 27.1.3. Strontium Nitrate
- 27.1.4. Other Products (Strontium Hydroxide)
- 27.2. Market Analysis, Insights and Forecast - by Application
- 27.2.1. Electrical and electronics
- 27.2.2. Medical and Dental
- 27.2.3. Paints and Coatings
- 27.2.4. Personal Care
- 27.2.5. Pyrotechnic
- 27.2.6. Other Applications (Glass and Ceramics)
- 27.1. Market Analysis, Insights and Forecast - by Product
- 28. Argentina Strontium Industry Analysis, Insights and Forecast, 2019-2031
- 28.1. Market Analysis, Insights and Forecast - by Product
- 28.1.1. Strontium Carbonate
- 28.1.2. Strontium Sulfate
- 28.1.3. Strontium Nitrate
- 28.1.4. Other Products (Strontium Hydroxide)
- 28.2. Market Analysis, Insights and Forecast - by Application
- 28.2.1. Electrical and electronics
- 28.2.2. Medical and Dental
- 28.2.3. Paints and Coatings
- 28.2.4. Personal Care
- 28.2.5. Pyrotechnic
- 28.2.6. Other Applications (Glass and Ceramics)
- 28.1. Market Analysis, Insights and Forecast - by Product
- 29. Colombia Strontium Industry Analysis, Insights and Forecast, 2019-2031
- 29.1. Market Analysis, Insights and Forecast - by Product
- 29.1.1. Strontium Carbonate
- 29.1.2. Strontium Sulfate
- 29.1.3. Strontium Nitrate
- 29.1.4. Other Products (Strontium Hydroxide)
- 29.2. Market Analysis, Insights and Forecast - by Application
- 29.2.1. Electrical and electronics
- 29.2.2. Medical and Dental
- 29.2.3. Paints and Coatings
- 29.2.4. Personal Care
- 29.2.5. Pyrotechnic
- 29.2.6. Other Applications (Glass and Ceramics)
- 29.1. Market Analysis, Insights and Forecast - by Product
- 30. Rest of South America Strontium Industry Analysis, Insights and Forecast, 2019-2031
- 30.1. Market Analysis, Insights and Forecast - by Product
- 30.1.1. Strontium Carbonate
- 30.1.2. Strontium Sulfate
- 30.1.3. Strontium Nitrate
- 30.1.4. Other Products (Strontium Hydroxide)
- 30.2. Market Analysis, Insights and Forecast - by Application
- 30.2.1. Electrical and electronics
- 30.2.2. Medical and Dental
- 30.2.3. Paints and Coatings
- 30.2.4. Personal Care
- 30.2.5. Pyrotechnic
- 30.2.6. Other Applications (Glass and Ceramics)
- 30.1. Market Analysis, Insights and Forecast - by Product
- 31. Saudi Arabia Strontium Industry Analysis, Insights and Forecast, 2019-2031
- 31.1. Market Analysis, Insights and Forecast - by Product
- 31.1.1. Strontium Carbonate
- 31.1.2. Strontium Sulfate
- 31.1.3. Strontium Nitrate
- 31.1.4. Other Products (Strontium Hydroxide)
- 31.2. Market Analysis, Insights and Forecast - by Application
- 31.2.1. Electrical and electronics
- 31.2.2. Medical and Dental
- 31.2.3. Paints and Coatings
- 31.2.4. Personal Care
- 31.2.5. Pyrotechnic
- 31.2.6. Other Applications (Glass and Ceramics)
- 31.1. Market Analysis, Insights and Forecast - by Product
- 32. South Africa Strontium Industry Analysis, Insights and Forecast, 2019-2031
- 32.1. Market Analysis, Insights and Forecast - by Product
- 32.1.1. Strontium Carbonate
- 32.1.2. Strontium Sulfate
- 32.1.3. Strontium Nitrate
- 32.1.4. Other Products (Strontium Hydroxide)
- 32.2. Market Analysis, Insights and Forecast - by Application
- 32.2.1. Electrical and electronics
- 32.2.2. Medical and Dental
- 32.2.3. Paints and Coatings
- 32.2.4. Personal Care
- 32.2.5. Pyrotechnic
- 32.2.6. Other Applications (Glass and Ceramics)
- 32.1. Market Analysis, Insights and Forecast - by Product
- 33. Nigeria Strontium Industry Analysis, Insights and Forecast, 2019-2031
- 33.1. Market Analysis, Insights and Forecast - by Product
- 33.1.1. Strontium Carbonate
- 33.1.2. Strontium Sulfate
- 33.1.3. Strontium Nitrate
- 33.1.4. Other Products (Strontium Hydroxide)
- 33.2. Market Analysis, Insights and Forecast - by Application
- 33.2.1. Electrical and electronics
- 33.2.2. Medical and Dental
- 33.2.3. Paints and Coatings
- 33.2.4. Personal Care
- 33.2.5. Pyrotechnic
- 33.2.6. Other Applications (Glass and Ceramics)
- 33.1. Market Analysis, Insights and Forecast - by Product
- 34. Egypt Strontium Industry Analysis, Insights and Forecast, 2019-2031
- 34.1. Market Analysis, Insights and Forecast - by Product
- 34.1.1. Strontium Carbonate
- 34.1.2. Strontium Sulfate
- 34.1.3. Strontium Nitrate
- 34.1.4. Other Products (Strontium Hydroxide)
- 34.2. Market Analysis, Insights and Forecast - by Application
- 34.2.1. Electrical and electronics
- 34.2.2. Medical and Dental
- 34.2.3. Paints and Coatings
- 34.2.4. Personal Care
- 34.2.5. Pyrotechnic
- 34.2.6. Other Applications (Glass and Ceramics)
- 34.1. Market Analysis, Insights and Forecast - by Product
- 35. Qatar Strontium Industry Analysis, Insights and Forecast, 2019-2031
- 35.1. Market Analysis, Insights and Forecast - by Product
- 35.1.1. Strontium Carbonate
- 35.1.2. Strontium Sulfate
- 35.1.3. Strontium Nitrate
- 35.1.4. Other Products (Strontium Hydroxide)
- 35.2. Market Analysis, Insights and Forecast - by Application
- 35.2.1. Electrical and electronics
- 35.2.2. Medical and Dental
- 35.2.3. Paints and Coatings
- 35.2.4. Personal Care
- 35.2.5. Pyrotechnic
- 35.2.6. Other Applications (Glass and Ceramics)
- 35.1. Market Analysis, Insights and Forecast - by Product
- 36. United Arab Emirates Strontium Industry Analysis, Insights and Forecast, 2019-2031
- 36.1. Market Analysis, Insights and Forecast - by Product
- 36.1.1. Strontium Carbonate
- 36.1.2. Strontium Sulfate
- 36.1.3. Strontium Nitrate
- 36.1.4. Other Products (Strontium Hydroxide)
- 36.2. Market Analysis, Insights and Forecast - by Application
- 36.2.1. Electrical and electronics
- 36.2.2. Medical and Dental
- 36.2.3. Paints and Coatings
- 36.2.4. Personal Care
- 36.2.5. Pyrotechnic
- 36.2.6. Other Applications (Glass and Ceramics)
- 36.1. Market Analysis, Insights and Forecast - by Product
- 37. Rest of Middle East and Africa Strontium Industry Analysis, Insights and Forecast, 2019-2031
- 37.1. Market Analysis, Insights and Forecast - by Product
- 37.1.1. Strontium Carbonate
- 37.1.2. Strontium Sulfate
- 37.1.3. Strontium Nitrate
- 37.1.4. Other Products (Strontium Hydroxide)
- 37.2. Market Analysis, Insights and Forecast - by Application
- 37.2.1. Electrical and electronics
- 37.2.2. Medical and Dental
- 37.2.3. Paints and Coatings
- 37.2.4. Personal Care
- 37.2.5. Pyrotechnic
- 37.2.6. Other Applications (Glass and Ceramics)
- 37.1. Market Analysis, Insights and Forecast - by Product
- 38. North America Strontium Industry Analysis, Insights and Forecast, 2019-2031
- 38.1. Market Analysis, Insights and Forecast - By Country/Sub-region
- 38.1.1 United States
- 38.1.2 Canada
- 38.1.3 Mexico
- 39. Europe Strontium Industry Analysis, Insights and Forecast, 2019-2031
- 39.1. Market Analysis, Insights and Forecast - By Country/Sub-region
- 39.1.1 Germany
- 39.1.2 United Kingdom
- 39.1.3 France
- 39.1.4 Spain
- 39.1.5 Italy
- 39.1.6 Spain
- 39.1.7 Belgium
- 39.1.8 Netherland
- 39.1.9 Nordics
- 39.1.10 Rest of Europe
- 40. Asia Pacific Strontium Industry Analysis, Insights and Forecast, 2019-2031
- 40.1. Market Analysis, Insights and Forecast - By Country/Sub-region
- 40.1.1 China
- 40.1.2 Japan
- 40.1.3 India
- 40.1.4 South Korea
- 40.1.5 Southeast Asia
- 40.1.6 Australia
- 40.1.7 Indonesia
- 40.1.8 Phillipes
- 40.1.9 Singapore
- 40.1.10 Thailandc
- 40.1.11 Rest of Asia Pacific
- 41. South America Strontium Industry Analysis, Insights and Forecast, 2019-2031
- 41.1. Market Analysis, Insights and Forecast - By Country/Sub-region
- 41.1.1 Brazil
- 41.1.2 Argentina
- 41.1.3 Peru
- 41.1.4 Chile
- 41.1.5 Colombia
- 41.1.6 Ecuador
- 41.1.7 Venezuela
- 41.1.8 Rest of South America
- 42. North America Strontium Industry Analysis, Insights and Forecast, 2019-2031
- 42.1. Market Analysis, Insights and Forecast - By Country/Sub-region
- 42.1.1 United States
- 42.1.2 Canada
- 42.1.3 Mexico
- 43. MEA Strontium Industry Analysis, Insights and Forecast, 2019-2031
- 43.1. Market Analysis, Insights and Forecast - By Country/Sub-region
- 43.1.1 United Arab Emirates
- 43.1.2 Saudi Arabia
- 43.1.3 South Africa
- 43.1.4 Rest of Middle East and Africa
- 44. Competitive Analysis
- 44.1. Global Market Share Analysis 2024
- 44.2. Company Profiles
- 44.2.1 Solvay*List Not Exhaustive
- 44.2.1.1. Overview
- 44.2.1.2. Products
- 44.2.1.3. SWOT Analysis
- 44.2.1.4. Recent Developments
- 44.2.1.5. Financials (Based on Availability)
- 44.2.2 KBM Affilips
- 44.2.2.1. Overview
- 44.2.2.2. Products
- 44.2.2.3. SWOT Analysis
- 44.2.2.4. Recent Developments
- 44.2.2.5. Financials (Based on Availability)
- 44.2.3 Shenzhou Jiaxin Chemical Co Ltd
- 44.2.3.1. Overview
- 44.2.3.2. Products
- 44.2.3.3. SWOT Analysis
- 44.2.3.4. Recent Developments
- 44.2.3.5. Financials (Based on Availability)
- 44.2.4 Fertiberia
- 44.2.4.1. Overview
- 44.2.4.2. Products
- 44.2.4.3. SWOT Analysis
- 44.2.4.4. Recent Developments
- 44.2.4.5. Financials (Based on Availability)
- 44.2.5 Abassco
- 44.2.5.1. Overview
- 44.2.5.2. Products
- 44.2.5.3. SWOT Analysis
- 44.2.5.4. Recent Developments
- 44.2.5.5. Financials (Based on Availability)
- 44.2.6 Shijiazhuang Zhengding JINSHI Chemical Co Ltd
- 44.2.6.1. Overview
- 44.2.6.2. Products
- 44.2.6.3. SWOT Analysis
- 44.2.6.4. Recent Developments
- 44.2.6.5. Financials (Based on Availability)
- 44.2.7 Nanjing Jinyan Strontium Industry Co Ltd
- 44.2.7.1. Overview
- 44.2.7.2. Products
- 44.2.7.3. SWOT Analysis
- 44.2.7.4. Recent Developments
- 44.2.7.5. Financials (Based on Availability)
- 44.2.8 Joyieng Chemical Limited
- 44.2.8.1. Overview
- 44.2.8.2. Products
- 44.2.8.3. SWOT Analysis
- 44.2.8.4. Recent Developments
- 44.2.8.5. Financials (Based on Availability)
- 44.2.9 SAKAI CHEMICAL INDUSTRY CO LTD
- 44.2.9.1. Overview
- 44.2.9.2. Products
- 44.2.9.3. SWOT Analysis
- 44.2.9.4. Recent Developments
- 44.2.9.5. Financials (Based on Availability)
- 44.2.10 Hebei Xinji Chemical Group Co Ltd
- 44.2.10.1. Overview
- 44.2.10.2. Products
- 44.2.10.3. SWOT Analysis
- 44.2.10.4. Recent Developments
- 44.2.10.5. Financials (Based on Availability)
- 44.2.11 ProChem Inc
- 44.2.11.1. Overview
- 44.2.11.2. Products
- 44.2.11.3. SWOT Analysis
- 44.2.11.4. Recent Developments
- 44.2.11.5. Financials (Based on Availability)
- 44.2.12 Barium & Chemicals Inc
- 44.2.12.1. Overview
- 44.2.12.2. Products
- 44.2.12.3. SWOT Analysis
- 44.2.12.4. Recent Developments
- 44.2.12.5. Financials (Based on Availability)
- 44.2.13 Noah Chemicals
- 44.2.13.1. Overview
- 44.2.13.2. Products
- 44.2.13.3. SWOT Analysis
- 44.2.13.4. Recent Developments
- 44.2.13.5. Financials (Based on Availability)
- 44.2.14 Chongqing Yuanhe Fine Chemicals Inc
- 44.2.14.1. Overview
- 44.2.14.2. Products
- 44.2.14.3. SWOT Analysis
- 44.2.14.4. Recent Developments
- 44.2.14.5. Financials (Based on Availability)
- 44.2.1 Solvay*List Not Exhaustive
List of Figures
- Figure 1: Global Strontium Industry Revenue Breakdown (Million, %) by Region 2024 & 2032
- Figure 2: North America Strontium Industry Revenue (Million), by Country 2024 & 2032
- Figure 3: North America Strontium Industry Revenue Share (%), by Country 2024 & 2032
- Figure 4: Europe Strontium Industry Revenue (Million), by Country 2024 & 2032
- Figure 5: Europe Strontium Industry Revenue Share (%), by Country 2024 & 2032
- Figure 6: Asia Pacific Strontium Industry Revenue (Million), by Country 2024 & 2032
- Figure 7: Asia Pacific Strontium Industry Revenue Share (%), by Country 2024 & 2032
- Figure 8: South America Strontium Industry Revenue (Million), by Country 2024 & 2032
- Figure 9: South America Strontium Industry Revenue Share (%), by Country 2024 & 2032
- Figure 10: North America Strontium Industry Revenue (Million), by Country 2024 & 2032
- Figure 11: North America Strontium Industry Revenue Share (%), by Country 2024 & 2032
- Figure 12: MEA Strontium Industry Revenue (Million), by Country 2024 & 2032
- Figure 13: MEA Strontium Industry Revenue Share (%), by Country 2024 & 2032
- Figure 14: China Strontium Industry Revenue (Million), by Product 2024 & 2032
- Figure 15: China Strontium Industry Revenue Share (%), by Product 2024 & 2032
- Figure 16: China Strontium Industry Revenue (Million), by Application 2024 & 2032
- Figure 17: China Strontium Industry Revenue Share (%), by Application 2024 & 2032
- Figure 18: China Strontium Industry Revenue (Million), by Country 2024 & 2032
- Figure 19: China Strontium Industry Revenue Share (%), by Country 2024 & 2032
- Figure 20: India Strontium Industry Revenue (Million), by Product 2024 & 2032
- Figure 21: India Strontium Industry Revenue Share (%), by Product 2024 & 2032
- Figure 22: India Strontium Industry Revenue (Million), by Application 2024 & 2032
- Figure 23: India Strontium Industry Revenue Share (%), by Application 2024 & 2032
- Figure 24: India Strontium Industry Revenue (Million), by Country 2024 & 2032
- Figure 25: India Strontium Industry Revenue Share (%), by Country 2024 & 2032
- Figure 26: Japan Strontium Industry Revenue (Million), by Product 2024 & 2032
- Figure 27: Japan Strontium Industry Revenue Share (%), by Product 2024 & 2032
- Figure 28: Japan Strontium Industry Revenue (Million), by Application 2024 & 2032
- Figure 29: Japan Strontium Industry Revenue Share (%), by Application 2024 & 2032
- Figure 30: Japan Strontium Industry Revenue (Million), by Country 2024 & 2032
- Figure 31: Japan Strontium Industry Revenue Share (%), by Country 2024 & 2032
- Figure 32: South Korea Strontium Industry Revenue (Million), by Product 2024 & 2032
- Figure 33: South Korea Strontium Industry Revenue Share (%), by Product 2024 & 2032
- Figure 34: South Korea Strontium Industry Revenue (Million), by Application 2024 & 2032
- Figure 35: South Korea Strontium Industry Revenue Share (%), by Application 2024 & 2032
- Figure 36: South Korea Strontium Industry Revenue (Million), by Country 2024 & 2032
- Figure 37: South Korea Strontium Industry Revenue Share (%), by Country 2024 & 2032
- Figure 38: Thailand Strontium Industry Revenue (Million), by Product 2024 & 2032
- Figure 39: Thailand Strontium Industry Revenue Share (%), by Product 2024 & 2032
- Figure 40: Thailand Strontium Industry Revenue (Million), by Application 2024 & 2032
- Figure 41: Thailand Strontium Industry Revenue Share (%), by Application 2024 & 2032
- Figure 42: Thailand Strontium Industry Revenue (Million), by Country 2024 & 2032
- Figure 43: Thailand Strontium Industry Revenue Share (%), by Country 2024 & 2032
- Figure 44: Malaysia Strontium Industry Revenue (Million), by Product 2024 & 2032
- Figure 45: Malaysia Strontium Industry Revenue Share (%), by Product 2024 & 2032
- Figure 46: Malaysia Strontium Industry Revenue (Million), by Application 2024 & 2032
- Figure 47: Malaysia Strontium Industry Revenue Share (%), by Application 2024 & 2032
- Figure 48: Malaysia Strontium Industry Revenue (Million), by Country 2024 & 2032
- Figure 49: Malaysia Strontium Industry Revenue Share (%), by Country 2024 & 2032
- Figure 50: Indonesia Strontium Industry Revenue (Million), by Product 2024 & 2032
- Figure 51: Indonesia Strontium Industry Revenue Share (%), by Product 2024 & 2032
- Figure 52: Indonesia Strontium Industry Revenue (Million), by Application 2024 & 2032
- Figure 53: Indonesia Strontium Industry Revenue Share (%), by Application 2024 & 2032
- Figure 54: Indonesia Strontium Industry Revenue (Million), by Country 2024 & 2032
- Figure 55: Indonesia Strontium Industry Revenue Share (%), by Country 2024 & 2032
- Figure 56: Vietnam Strontium Industry Revenue (Million), by Product 2024 & 2032
- Figure 57: Vietnam Strontium Industry Revenue Share (%), by Product 2024 & 2032
- Figure 58: Vietnam Strontium Industry Revenue (Million), by Application 2024 & 2032
- Figure 59: Vietnam Strontium Industry Revenue Share (%), by Application 2024 & 2032
- Figure 60: Vietnam Strontium Industry Revenue (Million), by Country 2024 & 2032
- Figure 61: Vietnam Strontium Industry Revenue Share (%), by Country 2024 & 2032
- Figure 62: Rest of Asia Pacific Strontium Industry Revenue (Million), by Product 2024 & 2032
- Figure 63: Rest of Asia Pacific Strontium Industry Revenue Share (%), by Product 2024 & 2032
- Figure 64: Rest of Asia Pacific Strontium Industry Revenue (Million), by Application 2024 & 2032
- Figure 65: Rest of Asia Pacific Strontium Industry Revenue Share (%), by Application 2024 & 2032
- Figure 66: Rest of Asia Pacific Strontium Industry Revenue (Million), by Country 2024 & 2032
- Figure 67: Rest of Asia Pacific Strontium Industry Revenue Share (%), by Country 2024 & 2032
- Figure 68: United States Strontium Industry Revenue (Million), by Product 2024 & 2032
- Figure 69: United States Strontium Industry Revenue Share (%), by Product 2024 & 2032
- Figure 70: United States Strontium Industry Revenue (Million), by Application 2024 & 2032
- Figure 71: United States Strontium Industry Revenue Share (%), by Application 2024 & 2032
- Figure 72: United States Strontium Industry Revenue (Million), by Country 2024 & 2032
- Figure 73: United States Strontium Industry Revenue Share (%), by Country 2024 & 2032
- Figure 74: Canada Strontium Industry Revenue (Million), by Product 2024 & 2032
- Figure 75: Canada Strontium Industry Revenue Share (%), by Product 2024 & 2032
- Figure 76: Canada Strontium Industry Revenue (Million), by Application 2024 & 2032
- Figure 77: Canada Strontium Industry Revenue Share (%), by Application 2024 & 2032
- Figure 78: Canada Strontium Industry Revenue (Million), by Country 2024 & 2032
- Figure 79: Canada Strontium Industry Revenue Share (%), by Country 2024 & 2032
- Figure 80: Mexico Strontium Industry Revenue (Million), by Product 2024 & 2032
- Figure 81: Mexico Strontium Industry Revenue Share (%), by Product 2024 & 2032
- Figure 82: Mexico Strontium Industry Revenue (Million), by Application 2024 & 2032
- Figure 83: Mexico Strontium Industry Revenue Share (%), by Application 2024 & 2032
- Figure 84: Mexico Strontium Industry Revenue (Million), by Country 2024 & 2032
- Figure 85: Mexico Strontium Industry Revenue Share (%), by Country 2024 & 2032
- Figure 86: Germany Strontium Industry Revenue (Million), by Product 2024 & 2032
- Figure 87: Germany Strontium Industry Revenue Share (%), by Product 2024 & 2032
- Figure 88: Germany Strontium Industry Revenue (Million), by Application 2024 & 2032
- Figure 89: Germany Strontium Industry Revenue Share (%), by Application 2024 & 2032
- Figure 90: Germany Strontium Industry Revenue (Million), by Country 2024 & 2032
- Figure 91: Germany Strontium Industry Revenue Share (%), by Country 2024 & 2032
- Figure 92: United Kingdom Strontium Industry Revenue (Million), by Product 2024 & 2032
- Figure 93: United Kingdom Strontium Industry Revenue Share (%), by Product 2024 & 2032
- Figure 94: United Kingdom Strontium Industry Revenue (Million), by Application 2024 & 2032
- Figure 95: United Kingdom Strontium Industry Revenue Share (%), by Application 2024 & 2032
- Figure 96: United Kingdom Strontium Industry Revenue (Million), by Country 2024 & 2032
- Figure 97: United Kingdom Strontium Industry Revenue Share (%), by Country 2024 & 2032
- Figure 98: Italy Strontium Industry Revenue (Million), by Product 2024 & 2032
- Figure 99: Italy Strontium Industry Revenue Share (%), by Product 2024 & 2032
- Figure 100: Italy Strontium Industry Revenue (Million), by Application 2024 & 2032
- Figure 101: Italy Strontium Industry Revenue Share (%), by Application 2024 & 2032
- Figure 102: Italy Strontium Industry Revenue (Million), by Country 2024 & 2032
- Figure 103: Italy Strontium Industry Revenue Share (%), by Country 2024 & 2032
- Figure 104: France Strontium Industry Revenue (Million), by Product 2024 & 2032
- Figure 105: France Strontium Industry Revenue Share (%), by Product 2024 & 2032
- Figure 106: France Strontium Industry Revenue (Million), by Application 2024 & 2032
- Figure 107: France Strontium Industry Revenue Share (%), by Application 2024 & 2032
- Figure 108: France Strontium Industry Revenue (Million), by Country 2024 & 2032
- Figure 109: France Strontium Industry Revenue Share (%), by Country 2024 & 2032
- Figure 110: Spain Strontium Industry Revenue (Million), by Product 2024 & 2032
- Figure 111: Spain Strontium Industry Revenue Share (%), by Product 2024 & 2032
- Figure 112: Spain Strontium Industry Revenue (Million), by Application 2024 & 2032
- Figure 113: Spain Strontium Industry Revenue Share (%), by Application 2024 & 2032
- Figure 114: Spain Strontium Industry Revenue (Million), by Country 2024 & 2032
- Figure 115: Spain Strontium Industry Revenue Share (%), by Country 2024 & 2032
- Figure 116: Turkey Strontium Industry Revenue (Million), by Product 2024 & 2032
- Figure 117: Turkey Strontium Industry Revenue Share (%), by Product 2024 & 2032
- Figure 118: Turkey Strontium Industry Revenue (Million), by Application 2024 & 2032
- Figure 119: Turkey Strontium Industry Revenue Share (%), by Application 2024 & 2032
- Figure 120: Turkey Strontium Industry Revenue (Million), by Country 2024 & 2032
- Figure 121: Turkey Strontium Industry Revenue Share (%), by Country 2024 & 2032
- Figure 122: Russia Strontium Industry Revenue (Million), by Product 2024 & 2032
- Figure 123: Russia Strontium Industry Revenue Share (%), by Product 2024 & 2032
- Figure 124: Russia Strontium Industry Revenue (Million), by Application 2024 & 2032
- Figure 125: Russia Strontium Industry Revenue Share (%), by Application 2024 & 2032
- Figure 126: Russia Strontium Industry Revenue (Million), by Country 2024 & 2032
- Figure 127: Russia Strontium Industry Revenue Share (%), by Country 2024 & 2032
- Figure 128: NORDIC Strontium Industry Revenue (Million), by Product 2024 & 2032
- Figure 129: NORDIC Strontium Industry Revenue Share (%), by Product 2024 & 2032
- Figure 130: NORDIC Strontium Industry Revenue (Million), by Application 2024 & 2032
- Figure 131: NORDIC Strontium Industry Revenue Share (%), by Application 2024 & 2032
- Figure 132: NORDIC Strontium Industry Revenue (Million), by Country 2024 & 2032
- Figure 133: NORDIC Strontium Industry Revenue Share (%), by Country 2024 & 2032
- Figure 134: Rest of Europe Strontium Industry Revenue (Million), by Product 2024 & 2032
- Figure 135: Rest of Europe Strontium Industry Revenue Share (%), by Product 2024 & 2032
- Figure 136: Rest of Europe Strontium Industry Revenue (Million), by Application 2024 & 2032
- Figure 137: Rest of Europe Strontium Industry Revenue Share (%), by Application 2024 & 2032
- Figure 138: Rest of Europe Strontium Industry Revenue (Million), by Country 2024 & 2032
- Figure 139: Rest of Europe Strontium Industry Revenue Share (%), by Country 2024 & 2032
- Figure 140: Brazil Strontium Industry Revenue (Million), by Product 2024 & 2032
- Figure 141: Brazil Strontium Industry Revenue Share (%), by Product 2024 & 2032
- Figure 142: Brazil Strontium Industry Revenue (Million), by Application 2024 & 2032
- Figure 143: Brazil Strontium Industry Revenue Share (%), by Application 2024 & 2032
- Figure 144: Brazil Strontium Industry Revenue (Million), by Country 2024 & 2032
- Figure 145: Brazil Strontium Industry Revenue Share (%), by Country 2024 & 2032
- Figure 146: Argentina Strontium Industry Revenue (Million), by Product 2024 & 2032
- Figure 147: Argentina Strontium Industry Revenue Share (%), by Product 2024 & 2032
- Figure 148: Argentina Strontium Industry Revenue (Million), by Application 2024 & 2032
- Figure 149: Argentina Strontium Industry Revenue Share (%), by Application 2024 & 2032
- Figure 150: Argentina Strontium Industry Revenue (Million), by Country 2024 & 2032
- Figure 151: Argentina Strontium Industry Revenue Share (%), by Country 2024 & 2032
- Figure 152: Colombia Strontium Industry Revenue (Million), by Product 2024 & 2032
- Figure 153: Colombia Strontium Industry Revenue Share (%), by Product 2024 & 2032
- Figure 154: Colombia Strontium Industry Revenue (Million), by Application 2024 & 2032
- Figure 155: Colombia Strontium Industry Revenue Share (%), by Application 2024 & 2032
- Figure 156: Colombia Strontium Industry Revenue (Million), by Country 2024 & 2032
- Figure 157: Colombia Strontium Industry Revenue Share (%), by Country 2024 & 2032
- Figure 158: Rest of South America Strontium Industry Revenue (Million), by Product 2024 & 2032
- Figure 159: Rest of South America Strontium Industry Revenue Share (%), by Product 2024 & 2032
- Figure 160: Rest of South America Strontium Industry Revenue (Million), by Application 2024 & 2032
- Figure 161: Rest of South America Strontium Industry Revenue Share (%), by Application 2024 & 2032
- Figure 162: Rest of South America Strontium Industry Revenue (Million), by Country 2024 & 2032
- Figure 163: Rest of South America Strontium Industry Revenue Share (%), by Country 2024 & 2032
- Figure 164: Saudi Arabia Strontium Industry Revenue (Million), by Product 2024 & 2032
- Figure 165: Saudi Arabia Strontium Industry Revenue Share (%), by Product 2024 & 2032
- Figure 166: Saudi Arabia Strontium Industry Revenue (Million), by Application 2024 & 2032
- Figure 167: Saudi Arabia Strontium Industry Revenue Share (%), by Application 2024 & 2032
- Figure 168: Saudi Arabia Strontium Industry Revenue (Million), by Country 2024 & 2032
- Figure 169: Saudi Arabia Strontium Industry Revenue Share (%), by Country 2024 & 2032
- Figure 170: South Africa Strontium Industry Revenue (Million), by Product 2024 & 2032
- Figure 171: South Africa Strontium Industry Revenue Share (%), by Product 2024 & 2032
- Figure 172: South Africa Strontium Industry Revenue (Million), by Application 2024 & 2032
- Figure 173: South Africa Strontium Industry Revenue Share (%), by Application 2024 & 2032
- Figure 174: South Africa Strontium Industry Revenue (Million), by Country 2024 & 2032
- Figure 175: South Africa Strontium Industry Revenue Share (%), by Country 2024 & 2032
- Figure 176: Nigeria Strontium Industry Revenue (Million), by Product 2024 & 2032
- Figure 177: Nigeria Strontium Industry Revenue Share (%), by Product 2024 & 2032
- Figure 178: Nigeria Strontium Industry Revenue (Million), by Application 2024 & 2032
- Figure 179: Nigeria Strontium Industry Revenue Share (%), by Application 2024 & 2032
- Figure 180: Nigeria Strontium Industry Revenue (Million), by Country 2024 & 2032
- Figure 181: Nigeria Strontium Industry Revenue Share (%), by Country 2024 & 2032
- Figure 182: Egypt Strontium Industry Revenue (Million), by Product 2024 & 2032
- Figure 183: Egypt Strontium Industry Revenue Share (%), by Product 2024 & 2032
- Figure 184: Egypt Strontium Industry Revenue (Million), by Application 2024 & 2032
- Figure 185: Egypt Strontium Industry Revenue Share (%), by Application 2024 & 2032
- Figure 186: Egypt Strontium Industry Revenue (Million), by Country 2024 & 2032
- Figure 187: Egypt Strontium Industry Revenue Share (%), by Country 2024 & 2032
- Figure 188: Qatar Strontium Industry Revenue (Million), by Product 2024 & 2032
- Figure 189: Qatar Strontium Industry Revenue Share (%), by Product 2024 & 2032
- Figure 190: Qatar Strontium Industry Revenue (Million), by Application 2024 & 2032
- Figure 191: Qatar Strontium Industry Revenue Share (%), by Application 2024 & 2032
- Figure 192: Qatar Strontium Industry Revenue (Million), by Country 2024 & 2032
- Figure 193: Qatar Strontium Industry Revenue Share (%), by Country 2024 & 2032
- Figure 194: United Arab Emirates Strontium Industry Revenue (Million), by Product 2024 & 2032
- Figure 195: United Arab Emirates Strontium Industry Revenue Share (%), by Product 2024 & 2032
- Figure 196: United Arab Emirates Strontium Industry Revenue (Million), by Application 2024 & 2032
- Figure 197: United Arab Emirates Strontium Industry Revenue Share (%), by Application 2024 & 2032
- Figure 198: United Arab Emirates Strontium Industry Revenue (Million), by Country 2024 & 2032
- Figure 199: United Arab Emirates Strontium Industry Revenue Share (%), by Country 2024 & 2032
- Figure 200: Rest of Middle East and Africa Strontium Industry Revenue (Million), by Product 2024 & 2032
- Figure 201: Rest of Middle East and Africa Strontium Industry Revenue Share (%), by Product 2024 & 2032
- Figure 202: Rest of Middle East and Africa Strontium Industry Revenue (Million), by Application 2024 & 2032
- Figure 203: Rest of Middle East and Africa Strontium Industry Revenue Share (%), by Application 2024 & 2032
- Figure 204: Rest of Middle East and Africa Strontium Industry Revenue (Million), by Country 2024 & 2032
- Figure 205: Rest of Middle East and Africa Strontium Industry Revenue Share (%), by Country 2024 & 2032
List of Tables
- Table 1: Global Strontium Industry Revenue Million Forecast, by Region 2019 & 2032
- Table 2: Global Strontium Industry Revenue Million Forecast, by Product 2019 & 2032
- Table 3: Global Strontium Industry Revenue Million Forecast, by Application 2019 & 2032
- Table 4: Global Strontium Industry Revenue Million Forecast, by Region 2019 & 2032
- Table 5: Global Strontium Industry Revenue Million Forecast, by Country 2019 & 2032
- Table 6: United States Strontium Industry Revenue (Million) Forecast, by Application 2019 & 2032
- Table 7: Canada Strontium Industry Revenue (Million) Forecast, by Application 2019 & 2032
- Table 8: Mexico Strontium Industry Revenue (Million) Forecast, by Application 2019 & 2032
- Table 9: Global Strontium Industry Revenue Million Forecast, by Country 2019 & 2032
- Table 10: Germany Strontium Industry Revenue (Million) Forecast, by Application 2019 & 2032
- Table 11: United Kingdom Strontium Industry Revenue (Million) Forecast, by Application 2019 & 2032
- Table 12: France Strontium Industry Revenue (Million) Forecast, by Application 2019 & 2032
- Table 13: Spain Strontium Industry Revenue (Million) Forecast, by Application 2019 & 2032
- Table 14: Italy Strontium Industry Revenue (Million) Forecast, by Application 2019 & 2032
- Table 15: Spain Strontium Industry Revenue (Million) Forecast, by Application 2019 & 2032
- Table 16: Belgium Strontium Industry Revenue (Million) Forecast, by Application 2019 & 2032
- Table 17: Netherland Strontium Industry Revenue (Million) Forecast, by Application 2019 & 2032
- Table 18: Nordics Strontium Industry Revenue (Million) Forecast, by Application 2019 & 2032
- Table 19: Rest of Europe Strontium Industry Revenue (Million) Forecast, by Application 2019 & 2032
- Table 20: Global Strontium Industry Revenue Million Forecast, by Country 2019 & 2032
- Table 21: China Strontium Industry Revenue (Million) Forecast, by Application 2019 & 2032
- Table 22: Japan Strontium Industry Revenue (Million) Forecast, by Application 2019 & 2032
- Table 23: India Strontium Industry Revenue (Million) Forecast, by Application 2019 & 2032
- Table 24: South Korea Strontium Industry Revenue (Million) Forecast, by Application 2019 & 2032
- Table 25: Southeast Asia Strontium Industry Revenue (Million) Forecast, by Application 2019 & 2032
- Table 26: Australia Strontium Industry Revenue (Million) Forecast, by Application 2019 & 2032
- Table 27: Indonesia Strontium Industry Revenue (Million) Forecast, by Application 2019 & 2032
- Table 28: Phillipes Strontium Industry Revenue (Million) Forecast, by Application 2019 & 2032
- Table 29: Singapore Strontium Industry Revenue (Million) Forecast, by Application 2019 & 2032
- Table 30: Thailandc Strontium Industry Revenue (Million) Forecast, by Application 2019 & 2032
- Table 31: Rest of Asia Pacific Strontium Industry Revenue (Million) Forecast, by Application 2019 & 2032
- Table 32: Global Strontium Industry Revenue Million Forecast, by Country 2019 & 2032
- Table 33: Brazil Strontium Industry Revenue (Million) Forecast, by Application 2019 & 2032
- Table 34: Argentina Strontium Industry Revenue (Million) Forecast, by Application 2019 & 2032
- Table 35: Peru Strontium Industry Revenue (Million) Forecast, by Application 2019 & 2032
- Table 36: Chile Strontium Industry Revenue (Million) Forecast, by Application 2019 & 2032
- Table 37: Colombia Strontium Industry Revenue (Million) Forecast, by Application 2019 & 2032
- Table 38: Ecuador Strontium Industry Revenue (Million) Forecast, by Application 2019 & 2032
- Table 39: Venezuela Strontium Industry Revenue (Million) Forecast, by Application 2019 & 2032
- Table 40: Rest of South America Strontium Industry Revenue (Million) Forecast, by Application 2019 & 2032
- Table 41: Global Strontium Industry Revenue Million Forecast, by Country 2019 & 2032
- Table 42: United States Strontium Industry Revenue (Million) Forecast, by Application 2019 & 2032
- Table 43: Canada Strontium Industry Revenue (Million) Forecast, by Application 2019 & 2032
- Table 44: Mexico Strontium Industry Revenue (Million) Forecast, by Application 2019 & 2032
- Table 45: Global Strontium Industry Revenue Million Forecast, by Country 2019 & 2032
- Table 46: United Arab Emirates Strontium Industry Revenue (Million) Forecast, by Application 2019 & 2032
- Table 47: Saudi Arabia Strontium Industry Revenue (Million) Forecast, by Application 2019 & 2032
- Table 48: South Africa Strontium Industry Revenue (Million) Forecast, by Application 2019 & 2032
- Table 49: Rest of Middle East and Africa Strontium Industry Revenue (Million) Forecast, by Application 2019 & 2032
- Table 50: Global Strontium Industry Revenue Million Forecast, by Product 2019 & 2032
- Table 51: Global Strontium Industry Revenue Million Forecast, by Application 2019 & 2032
- Table 52: Global Strontium Industry Revenue Million Forecast, by Country 2019 & 2032
- Table 53: Global Strontium Industry Revenue Million Forecast, by Product 2019 & 2032
- Table 54: Global Strontium Industry Revenue Million Forecast, by Application 2019 & 2032
- Table 55: Global Strontium Industry Revenue Million Forecast, by Country 2019 & 2032
- Table 56: Global Strontium Industry Revenue Million Forecast, by Product 2019 & 2032
- Table 57: Global Strontium Industry Revenue Million Forecast, by Application 2019 & 2032
- Table 58: Global Strontium Industry Revenue Million Forecast, by Country 2019 & 2032
- Table 59: Global Strontium Industry Revenue Million Forecast, by Product 2019 & 2032
- Table 60: Global Strontium Industry Revenue Million Forecast, by Application 2019 & 2032
- Table 61: Global Strontium Industry Revenue Million Forecast, by Country 2019 & 2032
- Table 62: Global Strontium Industry Revenue Million Forecast, by Product 2019 & 2032
- Table 63: Global Strontium Industry Revenue Million Forecast, by Application 2019 & 2032
- Table 64: Global Strontium Industry Revenue Million Forecast, by Country 2019 & 2032
- Table 65: Global Strontium Industry Revenue Million Forecast, by Product 2019 & 2032
- Table 66: Global Strontium Industry Revenue Million Forecast, by Application 2019 & 2032
- Table 67: Global Strontium Industry Revenue Million Forecast, by Country 2019 & 2032
- Table 68: Global Strontium Industry Revenue Million Forecast, by Product 2019 & 2032
- Table 69: Global Strontium Industry Revenue Million Forecast, by Application 2019 & 2032
- Table 70: Global Strontium Industry Revenue Million Forecast, by Country 2019 & 2032
- Table 71: Global Strontium Industry Revenue Million Forecast, by Product 2019 & 2032
- Table 72: Global Strontium Industry Revenue Million Forecast, by Application 2019 & 2032
- Table 73: Global Strontium Industry Revenue Million Forecast, by Country 2019 & 2032
- Table 74: Global Strontium Industry Revenue Million Forecast, by Product 2019 & 2032
- Table 75: Global Strontium Industry Revenue Million Forecast, by Application 2019 & 2032
- Table 76: Global Strontium Industry Revenue Million Forecast, by Country 2019 & 2032
- Table 77: North America Strontium Industry Revenue (Million) Forecast, by Application 2019 & 2032
- Table 78: Global Strontium Industry Revenue Million Forecast, by Product 2019 & 2032
- Table 79: Global Strontium Industry Revenue Million Forecast, by Application 2019 & 2032
- Table 80: Global Strontium Industry Revenue Million Forecast, by Country 2019 & 2032
- Table 81: Global Strontium Industry Revenue Million Forecast, by Product 2019 & 2032
- Table 82: Global Strontium Industry Revenue Million Forecast, by Application 2019 & 2032
- Table 83: Global Strontium Industry Revenue Million Forecast, by Country 2019 & 2032
- Table 84: Global Strontium Industry Revenue Million Forecast, by Product 2019 & 2032
- Table 85: Global Strontium Industry Revenue Million Forecast, by Application 2019 & 2032
- Table 86: Global Strontium Industry Revenue Million Forecast, by Country 2019 & 2032
- Table 87: Europe Strontium Industry Revenue (Million) Forecast, by Application 2019 & 2032
- Table 88: Global Strontium Industry Revenue Million Forecast, by Product 2019 & 2032
- Table 89: Global Strontium Industry Revenue Million Forecast, by Application 2019 & 2032
- Table 90: Global Strontium Industry Revenue Million Forecast, by Country 2019 & 2032
- Table 91: Global Strontium Industry Revenue Million Forecast, by Product 2019 & 2032
- Table 92: Global Strontium Industry Revenue Million Forecast, by Application 2019 & 2032
- Table 93: Global Strontium Industry Revenue Million Forecast, by Country 2019 & 2032
- Table 94: Global Strontium Industry Revenue Million Forecast, by Product 2019 & 2032
- Table 95: Global Strontium Industry Revenue Million Forecast, by Application 2019 & 2032
- Table 96: Global Strontium Industry Revenue Million Forecast, by Country 2019 & 2032
- Table 97: Global Strontium Industry Revenue Million Forecast, by Product 2019 & 2032
- Table 98: Global Strontium Industry Revenue Million Forecast, by Application 2019 & 2032
- Table 99: Global Strontium Industry Revenue Million Forecast, by Country 2019 & 2032
- Table 100: Global Strontium Industry Revenue Million Forecast, by Product 2019 & 2032
- Table 101: Global Strontium Industry Revenue Million Forecast, by Application 2019 & 2032
- Table 102: Global Strontium Industry Revenue Million Forecast, by Country 2019 & 2032
- Table 103: Global Strontium Industry Revenue Million Forecast, by Product 2019 & 2032
- Table 104: Global Strontium Industry Revenue Million Forecast, by Application 2019 & 2032
- Table 105: Global Strontium Industry Revenue Million Forecast, by Country 2019 & 2032
- Table 106: Global Strontium Industry Revenue Million Forecast, by Product 2019 & 2032
- Table 107: Global Strontium Industry Revenue Million Forecast, by Application 2019 & 2032
- Table 108: Global Strontium Industry Revenue Million Forecast, by Country 2019 & 2032
- Table 109: Global Strontium Industry Revenue Million Forecast, by Product 2019 & 2032
- Table 110: Global Strontium Industry Revenue Million Forecast, by Application 2019 & 2032
- Table 111: Global Strontium Industry Revenue Million Forecast, by Country 2019 & 2032
- Table 112: Global Strontium Industry Revenue Million Forecast, by Product 2019 & 2032
- Table 113: Global Strontium Industry Revenue Million Forecast, by Application 2019 & 2032
- Table 114: Global Strontium Industry Revenue Million Forecast, by Country 2019 & 2032
- Table 115: South America Strontium Industry Revenue (Million) Forecast, by Application 2019 & 2032
- Table 116: Global Strontium Industry Revenue Million Forecast, by Product 2019 & 2032
- Table 117: Global Strontium Industry Revenue Million Forecast, by Application 2019 & 2032
- Table 118: Global Strontium Industry Revenue Million Forecast, by Country 2019 & 2032
- Table 119: Global Strontium Industry Revenue Million Forecast, by Product 2019 & 2032
- Table 120: Global Strontium Industry Revenue Million Forecast, by Application 2019 & 2032
- Table 121: Global Strontium Industry Revenue Million Forecast, by Country 2019 & 2032
- Table 122: Global Strontium Industry Revenue Million Forecast, by Product 2019 & 2032
- Table 123: Global Strontium Industry Revenue Million Forecast, by Application 2019 & 2032
- Table 124: Global Strontium Industry Revenue Million Forecast, by Country 2019 & 2032
- Table 125: Global Strontium Industry Revenue Million Forecast, by Product 2019 & 2032
- Table 126: Global Strontium Industry Revenue Million Forecast, by Application 2019 & 2032
- Table 127: Global Strontium Industry Revenue Million Forecast, by Country 2019 & 2032
- Table 128: Middle East and Africa Strontium Industry Revenue (Million) Forecast, by Application 2019 & 2032
- Table 129: Global Strontium Industry Revenue Million Forecast, by Product 2019 & 2032
- Table 130: Global Strontium Industry Revenue Million Forecast, by Application 2019 & 2032
- Table 131: Global Strontium Industry Revenue Million Forecast, by Country 2019 & 2032
- Table 132: Global Strontium Industry Revenue Million Forecast, by Product 2019 & 2032
- Table 133: Global Strontium Industry Revenue Million Forecast, by Application 2019 & 2032
- Table 134: Global Strontium Industry Revenue Million Forecast, by Country 2019 & 2032
- Table 135: Global Strontium Industry Revenue Million Forecast, by Product 2019 & 2032
- Table 136: Global Strontium Industry Revenue Million Forecast, by Application 2019 & 2032
- Table 137: Global Strontium Industry Revenue Million Forecast, by Country 2019 & 2032
- Table 138: Global Strontium Industry Revenue Million Forecast, by Product 2019 & 2032
- Table 139: Global Strontium Industry Revenue Million Forecast, by Application 2019 & 2032
- Table 140: Global Strontium Industry Revenue Million Forecast, by Country 2019 & 2032
- Table 141: Global Strontium Industry Revenue Million Forecast, by Product 2019 & 2032
- Table 142: Global Strontium Industry Revenue Million Forecast, by Application 2019 & 2032
- Table 143: Global Strontium Industry Revenue Million Forecast, by Country 2019 & 2032
- Table 144: Global Strontium Industry Revenue Million Forecast, by Product 2019 & 2032
- Table 145: Global Strontium Industry Revenue Million Forecast, by Application 2019 & 2032
- Table 146: Global Strontium Industry Revenue Million Forecast, by Country 2019 & 2032
- Table 147: Global Strontium Industry Revenue Million Forecast, by Product 2019 & 2032
- Table 148: Global Strontium Industry Revenue Million Forecast, by Application 2019 & 2032
- Table 149: Global Strontium Industry Revenue Million Forecast, by Country 2019 & 2032
Frequently Asked Questions
1. What is the projected Compound Annual Growth Rate (CAGR) of the Strontium Industry?
The projected CAGR is approximately > 3.00%.
2. Which companies are prominent players in the Strontium Industry?
Key companies in the market include Solvay*List Not Exhaustive, KBM Affilips, Shenzhou Jiaxin Chemical Co Ltd, Fertiberia, Abassco, Shijiazhuang Zhengding JINSHI Chemical Co Ltd, Nanjing Jinyan Strontium Industry Co Ltd, Joyieng Chemical Limited, SAKAI CHEMICAL INDUSTRY CO LTD, Hebei Xinji Chemical Group Co Ltd, ProChem Inc, Barium & Chemicals Inc, Noah Chemicals, Chongqing Yuanhe Fine Chemicals Inc.
3. What are the main segments of the Strontium Industry?
The market segments include Product, Application.
4. Can you provide details about the market size?
The market size is estimated to be USD 100 Million as of 2022.
5. What are some drivers contributing to market growth?
Increased Demand from the Paints and Coatings Segment; Increasing Construction Activities in Emerging Economies of Asia-Pacific.
6. What are the notable trends driving market growth?
Paints and Coatings Segment to Dominate the Market.
7. Are there any restraints impacting market growth?
Risk of Explosion and Fire Hazards Associated with Strontium; Other Restraints.
8. Can you provide examples of recent developments in the market?
October 2023: ProChem joined the Society of Chemical Manufacturers & Affiliates (SOCMA). SOCMA is the only US-based trade association that is completely dedicated to the specialty and fine chemicals industry. SOCMA provides a legislative and regulatory advocate, promotes the highest level of safety, and strengthens business intelligence and production operations to support and stimulate growth in the specialty chemicals sector.
9. What pricing options are available for accessing the report?
Pricing options include single-user, multi-user, and enterprise licenses priced at USD 4750, USD 5250, and USD 8750 respectively.
10. Is the market size provided in terms of value or volume?
The market size is provided in terms of value, measured in Million.
11. Are there any specific market keywords associated with the report?
Yes, the market keyword associated with the report is "Strontium Industry," which aids in identifying and referencing the specific market segment covered.
12. How do I determine which pricing option suits my needs best?
The pricing options vary based on user requirements and access needs. Individual users may opt for single-user licenses, while businesses requiring broader access may choose multi-user or enterprise licenses for cost-effective access to the report.
13. Are there any additional resources or data provided in the Strontium Industry report?
While the report offers comprehensive insights, it's advisable to review the specific contents or supplementary materials provided to ascertain if additional resources or data are available.
14. How can I stay updated on further developments or reports in the Strontium Industry?
To stay informed about further developments, trends, and reports in the Strontium Industry, consider subscribing to industry newsletters, following relevant companies and organizations, or regularly checking reputable industry news sources and publications.
Methodology
Step 1 - Identification of Relevant Samples Size from Population Database


Step 2 - Approaches for Defining Global Market Size (Value, Volume* & Price*)

Note*: In applicable scenarios
Step 3 - Data Sources
Primary Research
- Web Analytics
- Survey Reports
- Research Institute
- Latest Research Reports
- Opinion Leaders
Secondary Research
- Annual Reports
- White Paper
- Latest Press Release
- Industry Association
- Paid Database
- Investor Presentations

Step 4 - Data Triangulation
Involves using different sources of information in order to increase the validity of a study
These sources are likely to be stakeholders in a program - participants, other researchers, program staff, other community members, and so on.
Then we put all data in single framework & apply various statistical tools to find out the dynamic on the market.
During the analysis stage, feedback from the stakeholder groups would be compared to determine areas of agreement as well as areas of divergence


