
Key Insights
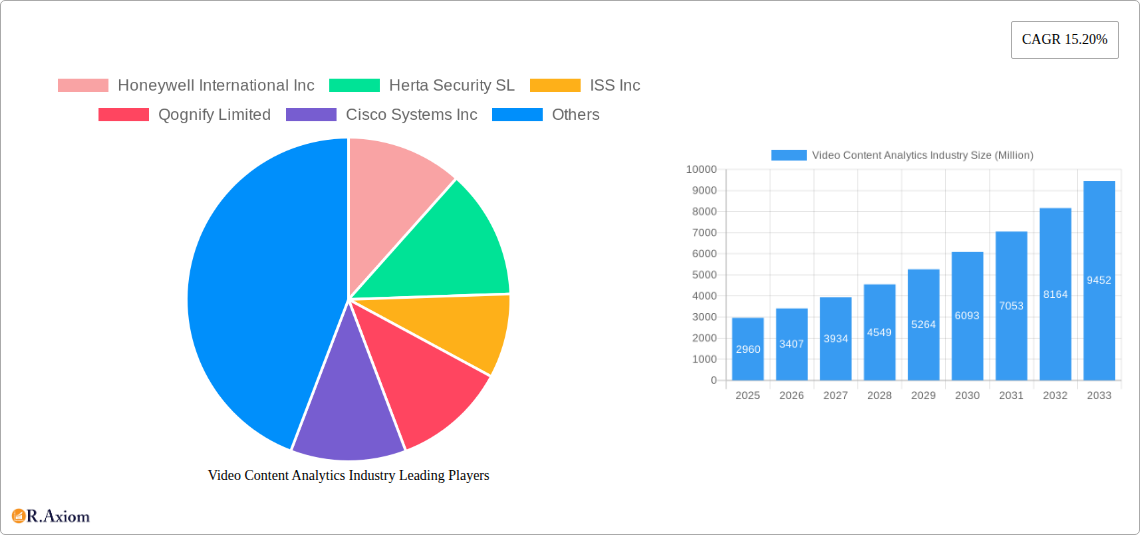
The global Video Content Analytics market is experiencing robust growth, projected to reach $2.96 billion in 2025 and exhibiting a Compound Annual Growth Rate (CAGR) of 15.20% from 2025 to 2033. This expansion is driven by several key factors. The increasing adoption of cloud-based solutions offers scalability and cost-effectiveness, attracting businesses across diverse sectors. Furthermore, the rising need for enhanced security surveillance in critical infrastructure, BFSI (Banking, Financial Services, and Insurance), and retail & logistics fuels market demand. Advancements in artificial intelligence (AI) and machine learning (ML) are enabling more sophisticated video analytics capabilities, leading to improved accuracy and efficiency in threat detection, customer behavior analysis, and operational optimization. The proliferation of connected devices and the growth of high-resolution video data are also contributing factors. While data privacy concerns and the complexities of integrating legacy systems may present challenges, the overall market outlook remains positive due to the continuous innovation in video analytics technologies and their increasing strategic importance across various industries.
The market segmentation reveals a strong preference for cloud-based software solutions, reflecting the industry-wide shift towards flexible and scalable technologies. North America currently holds a significant market share, driven by early adoption and strong technological infrastructure. However, the Asia-Pacific region is expected to witness rapid growth in the coming years due to increasing investments in smart city initiatives and rising demand for security solutions. The diverse end-user segments, including healthcare, transportation, and defense, highlight the versatility of video analytics applications and the broad potential for future market expansion. Competitive landscape analysis indicates a mix of established players like Honeywell and Cisco and emerging innovative companies, fostering a dynamic and innovative market environment. Continued technological advancements and strategic partnerships will be critical to maintaining a competitive edge in this rapidly evolving market.
Video Content Analytics Industry: A Comprehensive Market Report (2019-2033)
This detailed report provides a comprehensive analysis of the Video Content Analytics industry, offering invaluable insights for stakeholders, investors, and industry professionals. The study period covers 2019-2033, with 2025 as the base and estimated year, and a forecast period of 2025-2033. The report leverages extensive data analysis from the historical period (2019-2024) to project future market trends and opportunities. The global market value is predicted to reach xx Million by 2033.
Video Content Analytics Industry Market Concentration & Innovation
The Video Content Analytics market exhibits a moderately concentrated landscape, with key players such as Honeywell International Inc, Herta Security SL, ISS Inc, Qognify Limited, and Cisco Systems Inc holding significant market share. However, the emergence of innovative startups and the continuous technological advancements are fostering a competitive environment. Market share data for 2024 indicates that the top five players collectively hold approximately 40% of the market, leaving substantial opportunity for growth among smaller players and new entrants. M&A activity has been relatively robust in recent years, with deal values exceeding xx Million in 2024 alone, driven primarily by the need to acquire technological capabilities and expand market reach. Regulatory frameworks, particularly concerning data privacy and security, significantly influence market dynamics. Product substitutes, such as traditional manual video monitoring systems, are gradually losing ground due to the superior efficiency and analytical capabilities of video content analytics solutions. End-user trends are shifting towards cloud-based solutions and AI-powered analytics to enhance operational efficiency and gain actionable insights.
- Market Share (2024): Top 5 Players – 40%
- M&A Deal Value (2024): xx Million
- Key Innovation Drivers: AI, Machine Learning, Cloud Computing, Big Data Analytics
- Regulatory Impact: GDPR, CCPA, other regional data protection laws
Video Content Analytics Industry Industry Trends & Insights
The Video Content Analytics industry is experiencing robust growth, driven by increasing demand for enhanced security, operational efficiency, and data-driven insights across various sectors. The market is projected to register a CAGR of xx% during the forecast period (2025-2033). Technological disruptions, particularly the adoption of advanced AI and machine learning algorithms, are transforming the landscape, enabling more sophisticated video analysis and real-time insights. Consumer preferences are shifting towards scalable, cloud-based solutions that offer flexible pricing models and seamless integration with existing infrastructure. The competitive dynamics are characterized by intense rivalry among established players and the emergence of new players offering innovative solutions. Market penetration remains high in developed regions, with significant growth potential in emerging economies.

Dominant Markets & Segments in Video Content Analytics Industry
The North American region currently holds the largest market share in the Video Content Analytics industry, followed by Europe and Asia-Pacific. This dominance is attributable to high technological adoption rates, robust security infrastructure, and strong regulatory support. Within the segments:
By Type: The Software segment (both on-premise and cloud) dominates the market, driven by the increasing preference for scalable and cost-effective solutions. Cloud-based solutions show the most rapid growth. Services are essential for successful implementation, integration, and ongoing support of video analytics platforms.
By End-User: The BFSI (Banking, Financial Services, and Insurance) sector is a significant end-user, primarily due to the need for robust security and fraud prevention measures. Other key segments include Retail & Logistics (inventory management, loss prevention), Critical Infrastructure (surveillance and monitoring), and Healthcare (patient monitoring, security). The Defense and Security sector also represents substantial market growth due to the need for advanced surveillance and threat detection capabilities.
Key Drivers for Dominant Markets:
- North America: Strong technological infrastructure, high adoption rates, and stringent security regulations.
- Europe: Growing investments in smart cities, public safety, and advanced security systems.
- BFSI: High demand for fraud detection and prevention, risk management, and enhanced security measures.
Video Content Analytics Industry Product Developments
Recent product innovations focus on enhancing accuracy, speed, and efficiency of video analysis through advanced AI algorithms and machine learning techniques. New applications include predictive analytics, real-time threat detection, and automated incident reporting. Competitive advantages are increasingly driven by the ability to integrate with existing systems, offer seamless user experiences, and provide actionable insights that improve operational efficiency and business outcomes. The market is witnessing a trend toward edge computing and the development of smaller, more energy-efficient devices for video analytics applications.
Report Scope & Segmentation Analysis
This report provides a detailed segmentation analysis of the Video Content Analytics market, broken down by Type (Software - On-premise and Cloud; Services) and by End-User (BFSI, Healthcare, Retail & Logistics, Critical Infrastructure, Hospitality and Transportation, Defense and Security, Other End-user verticals). Each segment's growth projection, market size, and competitive landscape are comprehensively analyzed, providing a clear understanding of the market dynamics within each sector. For example, the cloud-based software segment is anticipated to exhibit significant growth due to increased flexibility and cost-effectiveness. Meanwhile, the BFSI sector is likely to remain a dominant end-user due to its heightened security and regulatory compliance requirements.
Key Drivers of Video Content Analytics Growth
The growth of the Video Content Analytics market is propelled by several key factors:
- Technological advancements: AI, ML, and deep learning are enabling more accurate and efficient video analysis.
- Increased security concerns: Rising crime rates and terrorist threats drive demand for advanced surveillance systems.
- Growing need for operational efficiency: Video analytics help optimize processes across various industries.
- Government initiatives: Investments in smart city projects and infrastructure upgrades are fueling market growth.
Challenges in the Video Content Analytics Industry Sector
The industry faces challenges such as:
- Data privacy and security concerns: Stringent regulations and ethical considerations impact data usage and storage.
- High implementation costs: Deploying and maintaining video analytics systems can be expensive.
- Lack of skilled professionals: A shortage of qualified personnel hinders market growth.
- Competition from established players and new entrants: The market is becoming increasingly competitive.
Emerging Opportunities in Video Content Analytics Industry
The Video Content Analytics industry offers several promising opportunities:
- Expansion into new markets: Emerging economies present significant growth potential.
- Integration with IoT devices: Connecting video analytics with IoT devices expands application possibilities.
- Development of specialized analytics solutions: Tailoring solutions for specific industry needs creates new market niches.
- Advancements in edge computing: Processing video data closer to the source enhances real-time capabilities.
Leading Players in the Video Content Analytics Industry Market
- Honeywell International Inc
- Herta Security SL
- ISS Inc
- Qognify Limited
- Cisco Systems Inc
- Genetec Inc
- Verint Systems Inc
- NEC Corporation
- Agent Video Intelligence Ltd
- Identiv Inc
- Aventura Technologies Inc
- International Business Machines Corporation
- Objectvideo Labs LLC
Key Developments in Video Content Analytics Industry
November 2022: Servian and VisualCortex signed a referral and services agreement, expanding VisualCortex's reach in Australia and New Zealand. This partnership significantly enhances market penetration and service offerings within the region.
October 2022: Awiros provided advanced video analytics for the Bengaluru Safe City project, demonstrating the technology's effectiveness in large-scale public safety initiatives. This showcases the technology's impact on public safety and smart city development.
Strategic Outlook for Video Content Analytics Market
The Video Content Analytics market is poised for sustained growth, driven by technological advancements, increased security concerns, and the growing need for operational efficiency across diverse sectors. The focus on AI-powered solutions, cloud-based deployments, and the integration with IoT devices will shape future market trends. Opportunities exist in emerging economies, specialized industry solutions, and advanced analytics capabilities. The market is expected to witness continued consolidation through mergers and acquisitions, further driving innovation and market concentration.
Video Content Analytics Industry Segmentation
-
1. Type
- 1.1. Software (On-premise and Cloud)
- 1.2. Services
-
2. End User
- 2.1. BFSI
- 2.2. Healthcare
- 2.3. Retail & Logistics
- 2.4. Critical Infrastructure
- 2.5. Hospitality and Transportation
- 2.6. Defense and Security
- 2.7. Other End-user verticals (Manufacturing, etc.)
Video Content Analytics Industry Segmentation By Geography
- 1. North America
- 2. Europe
- 3. Asia Pacific
- 4. Latin America
- 5. Middle East

Video Content Analytics Industry REPORT HIGHLIGHTS
| Aspects | Details |
|---|---|
| Study Period | 2019-2033 |
| Base Year | 2024 |
| Estimated Year | 2025 |
| Forecast Period | 2025-2033 |
| Historical Period | 2019-2024 |
| Growth Rate | CAGR of 15.20% from 2019-2033 |
| Segmentation |
|
Table of Contents
- 1. Introduction
- 1.1. Research Scope
- 1.2. Market Segmentation
- 1.3. Research Methodology
- 1.4. Definitions and Assumptions
- 2. Executive Summary
- 2.1. Introduction
- 3. Market Dynamics
- 3.1. Introduction
- 3.2. Market Drivers
- 3.2.1. Growing Emphasis among Enterprises on Obtaining Actionable Insights; Technological Advancements coupled with High Investments in City Surveillance
- 3.3. Market Restrains
- 3.3.1. Steep Learning Curve Regarding Connected Agriculture
- 3.4. Market Trends
- 3.4.1. Retail Industry is expected to Hold a Major Share
- 4. Market Factor Analysis
- 4.1. Porters Five Forces
- 4.2. Supply/Value Chain
- 4.3. PESTEL analysis
- 4.4. Market Entropy
- 4.5. Patent/Trademark Analysis
- 5. Global Video Content Analytics Industry Analysis, Insights and Forecast, 2019-2031
- 5.1. Market Analysis, Insights and Forecast - by Type
- 5.1.1. Software (On-premise and Cloud)
- 5.1.2. Services
- 5.2. Market Analysis, Insights and Forecast - by End User
- 5.2.1. BFSI
- 5.2.2. Healthcare
- 5.2.3. Retail & Logistics
- 5.2.4. Critical Infrastructure
- 5.2.5. Hospitality and Transportation
- 5.2.6. Defense and Security
- 5.2.7. Other End-user verticals (Manufacturing, etc.)
- 5.3. Market Analysis, Insights and Forecast - by Region
- 5.3.1. North America
- 5.3.2. Europe
- 5.3.3. Asia Pacific
- 5.3.4. Latin America
- 5.3.5. Middle East
- 5.1. Market Analysis, Insights and Forecast - by Type
- 6. North America Video Content Analytics Industry Analysis, Insights and Forecast, 2019-2031
- 6.1. Market Analysis, Insights and Forecast - by Type
- 6.1.1. Software (On-premise and Cloud)
- 6.1.2. Services
- 6.2. Market Analysis, Insights and Forecast - by End User
- 6.2.1. BFSI
- 6.2.2. Healthcare
- 6.2.3. Retail & Logistics
- 6.2.4. Critical Infrastructure
- 6.2.5. Hospitality and Transportation
- 6.2.6. Defense and Security
- 6.2.7. Other End-user verticals (Manufacturing, etc.)
- 6.1. Market Analysis, Insights and Forecast - by Type
- 7. Europe Video Content Analytics Industry Analysis, Insights and Forecast, 2019-2031
- 7.1. Market Analysis, Insights and Forecast - by Type
- 7.1.1. Software (On-premise and Cloud)
- 7.1.2. Services
- 7.2. Market Analysis, Insights and Forecast - by End User
- 7.2.1. BFSI
- 7.2.2. Healthcare
- 7.2.3. Retail & Logistics
- 7.2.4. Critical Infrastructure
- 7.2.5. Hospitality and Transportation
- 7.2.6. Defense and Security
- 7.2.7. Other End-user verticals (Manufacturing, etc.)
- 7.1. Market Analysis, Insights and Forecast - by Type
- 8. Asia Pacific Video Content Analytics Industry Analysis, Insights and Forecast, 2019-2031
- 8.1. Market Analysis, Insights and Forecast - by Type
- 8.1.1. Software (On-premise and Cloud)
- 8.1.2. Services
- 8.2. Market Analysis, Insights and Forecast - by End User
- 8.2.1. BFSI
- 8.2.2. Healthcare
- 8.2.3. Retail & Logistics
- 8.2.4. Critical Infrastructure
- 8.2.5. Hospitality and Transportation
- 8.2.6. Defense and Security
- 8.2.7. Other End-user verticals (Manufacturing, etc.)
- 8.1. Market Analysis, Insights and Forecast - by Type
- 9. Latin America Video Content Analytics Industry Analysis, Insights and Forecast, 2019-2031
- 9.1. Market Analysis, Insights and Forecast - by Type
- 9.1.1. Software (On-premise and Cloud)
- 9.1.2. Services
- 9.2. Market Analysis, Insights and Forecast - by End User
- 9.2.1. BFSI
- 9.2.2. Healthcare
- 9.2.3. Retail & Logistics
- 9.2.4. Critical Infrastructure
- 9.2.5. Hospitality and Transportation
- 9.2.6. Defense and Security
- 9.2.7. Other End-user verticals (Manufacturing, etc.)
- 9.1. Market Analysis, Insights and Forecast - by Type
- 10. Middle East Video Content Analytics Industry Analysis, Insights and Forecast, 2019-2031
- 10.1. Market Analysis, Insights and Forecast - by Type
- 10.1.1. Software (On-premise and Cloud)
- 10.1.2. Services
- 10.2. Market Analysis, Insights and Forecast - by End User
- 10.2.1. BFSI
- 10.2.2. Healthcare
- 10.2.3. Retail & Logistics
- 10.2.4. Critical Infrastructure
- 10.2.5. Hospitality and Transportation
- 10.2.6. Defense and Security
- 10.2.7. Other End-user verticals (Manufacturing, etc.)
- 10.1. Market Analysis, Insights and Forecast - by Type
- 11. North America Video Content Analytics Industry Analysis, Insights and Forecast, 2019-2031
- 11.1. Market Analysis, Insights and Forecast - By Country/Sub-region
- 11.1.1 United States
- 11.1.2 Canada
- 11.1.3 Mexico
- 12. Europe Video Content Analytics Industry Analysis, Insights and Forecast, 2019-2031
- 12.1. Market Analysis, Insights and Forecast - By Country/Sub-region
- 12.1.1 Germany
- 12.1.2 United Kingdom
- 12.1.3 France
- 12.1.4 Spain
- 12.1.5 Italy
- 12.1.6 Spain
- 12.1.7 Belgium
- 12.1.8 Netherland
- 12.1.9 Nordics
- 12.1.10 Rest of Europe
- 13. Asia Pacific Video Content Analytics Industry Analysis, Insights and Forecast, 2019-2031
- 13.1. Market Analysis, Insights and Forecast - By Country/Sub-region
- 13.1.1 China
- 13.1.2 Japan
- 13.1.3 India
- 13.1.4 South Korea
- 13.1.5 Southeast Asia
- 13.1.6 Australia
- 13.1.7 Indonesia
- 13.1.8 Phillipes
- 13.1.9 Singapore
- 13.1.10 Thailandc
- 13.1.11 Rest of Asia Pacific
- 14. South America Video Content Analytics Industry Analysis, Insights and Forecast, 2019-2031
- 14.1. Market Analysis, Insights and Forecast - By Country/Sub-region
- 14.1.1 Brazil
- 14.1.2 Argentina
- 14.1.3 Peru
- 14.1.4 Chile
- 14.1.5 Colombia
- 14.1.6 Ecuador
- 14.1.7 Venezuela
- 14.1.8 Rest of South America
- 15. North America Video Content Analytics Industry Analysis, Insights and Forecast, 2019-2031
- 15.1. Market Analysis, Insights and Forecast - By Country/Sub-region
- 15.1.1 United States
- 15.1.2 Canada
- 15.1.3 Mexico
- 16. MEA Video Content Analytics Industry Analysis, Insights and Forecast, 2019-2031
- 16.1. Market Analysis, Insights and Forecast - By Country/Sub-region
- 16.1.1 United Arab Emirates
- 16.1.2 Saudi Arabia
- 16.1.3 South Africa
- 16.1.4 Rest of Middle East and Africa
- 17. Competitive Analysis
- 17.1. Global Market Share Analysis 2024
- 17.2. Company Profiles
- 17.2.1 Honeywell International Inc
- 17.2.1.1. Overview
- 17.2.1.2. Products
- 17.2.1.3. SWOT Analysis
- 17.2.1.4. Recent Developments
- 17.2.1.5. Financials (Based on Availability)
- 17.2.2 Herta Security SL
- 17.2.2.1. Overview
- 17.2.2.2. Products
- 17.2.2.3. SWOT Analysis
- 17.2.2.4. Recent Developments
- 17.2.2.5. Financials (Based on Availability)
- 17.2.3 ISS Inc
- 17.2.3.1. Overview
- 17.2.3.2. Products
- 17.2.3.3. SWOT Analysis
- 17.2.3.4. Recent Developments
- 17.2.3.5. Financials (Based on Availability)
- 17.2.4 Qognify Limited
- 17.2.4.1. Overview
- 17.2.4.2. Products
- 17.2.4.3. SWOT Analysis
- 17.2.4.4. Recent Developments
- 17.2.4.5. Financials (Based on Availability)
- 17.2.5 Cisco Systems Inc
- 17.2.5.1. Overview
- 17.2.5.2. Products
- 17.2.5.3. SWOT Analysis
- 17.2.5.4. Recent Developments
- 17.2.5.5. Financials (Based on Availability)
- 17.2.6 Genetec Inc
- 17.2.6.1. Overview
- 17.2.6.2. Products
- 17.2.6.3. SWOT Analysis
- 17.2.6.4. Recent Developments
- 17.2.6.5. Financials (Based on Availability)
- 17.2.7 Verint Systems Inc
- 17.2.7.1. Overview
- 17.2.7.2. Products
- 17.2.7.3. SWOT Analysis
- 17.2.7.4. Recent Developments
- 17.2.7.5. Financials (Based on Availability)
- 17.2.8 NEC Corporation
- 17.2.8.1. Overview
- 17.2.8.2. Products
- 17.2.8.3. SWOT Analysis
- 17.2.8.4. Recent Developments
- 17.2.8.5. Financials (Based on Availability)
- 17.2.9 Agent Video Intelligence Ltd
- 17.2.9.1. Overview
- 17.2.9.2. Products
- 17.2.9.3. SWOT Analysis
- 17.2.9.4. Recent Developments
- 17.2.9.5. Financials (Based on Availability)
- 17.2.10 Identiv Inc
- 17.2.10.1. Overview
- 17.2.10.2. Products
- 17.2.10.3. SWOT Analysis
- 17.2.10.4. Recent Developments
- 17.2.10.5. Financials (Based on Availability)
- 17.2.11 Aventura Technologies Inc
- 17.2.11.1. Overview
- 17.2.11.2. Products
- 17.2.11.3. SWOT Analysis
- 17.2.11.4. Recent Developments
- 17.2.11.5. Financials (Based on Availability)
- 17.2.12 International Business Machines Corporation
- 17.2.12.1. Overview
- 17.2.12.2. Products
- 17.2.12.3. SWOT Analysis
- 17.2.12.4. Recent Developments
- 17.2.12.5. Financials (Based on Availability)
- 17.2.13 Objectvideo Labs LLC
- 17.2.13.1. Overview
- 17.2.13.2. Products
- 17.2.13.3. SWOT Analysis
- 17.2.13.4. Recent Developments
- 17.2.13.5. Financials (Based on Availability)
- 17.2.1 Honeywell International Inc
List of Figures
- Figure 1: Global Video Content Analytics Industry Revenue Breakdown (Million, %) by Region 2024 & 2032
- Figure 2: North America Video Content Analytics Industry Revenue (Million), by Country 2024 & 2032
- Figure 3: North America Video Content Analytics Industry Revenue Share (%), by Country 2024 & 2032
- Figure 4: Europe Video Content Analytics Industry Revenue (Million), by Country 2024 & 2032
- Figure 5: Europe Video Content Analytics Industry Revenue Share (%), by Country 2024 & 2032
- Figure 6: Asia Pacific Video Content Analytics Industry Revenue (Million), by Country 2024 & 2032
- Figure 7: Asia Pacific Video Content Analytics Industry Revenue Share (%), by Country 2024 & 2032
- Figure 8: South America Video Content Analytics Industry Revenue (Million), by Country 2024 & 2032
- Figure 9: South America Video Content Analytics Industry Revenue Share (%), by Country 2024 & 2032
- Figure 10: North America Video Content Analytics Industry Revenue (Million), by Country 2024 & 2032
- Figure 11: North America Video Content Analytics Industry Revenue Share (%), by Country 2024 & 2032
- Figure 12: MEA Video Content Analytics Industry Revenue (Million), by Country 2024 & 2032
- Figure 13: MEA Video Content Analytics Industry Revenue Share (%), by Country 2024 & 2032
- Figure 14: North America Video Content Analytics Industry Revenue (Million), by Type 2024 & 2032
- Figure 15: North America Video Content Analytics Industry Revenue Share (%), by Type 2024 & 2032
- Figure 16: North America Video Content Analytics Industry Revenue (Million), by End User 2024 & 2032
- Figure 17: North America Video Content Analytics Industry Revenue Share (%), by End User 2024 & 2032
- Figure 18: North America Video Content Analytics Industry Revenue (Million), by Country 2024 & 2032
- Figure 19: North America Video Content Analytics Industry Revenue Share (%), by Country 2024 & 2032
- Figure 20: Europe Video Content Analytics Industry Revenue (Million), by Type 2024 & 2032
- Figure 21: Europe Video Content Analytics Industry Revenue Share (%), by Type 2024 & 2032
- Figure 22: Europe Video Content Analytics Industry Revenue (Million), by End User 2024 & 2032
- Figure 23: Europe Video Content Analytics Industry Revenue Share (%), by End User 2024 & 2032
- Figure 24: Europe Video Content Analytics Industry Revenue (Million), by Country 2024 & 2032
- Figure 25: Europe Video Content Analytics Industry Revenue Share (%), by Country 2024 & 2032
- Figure 26: Asia Pacific Video Content Analytics Industry Revenue (Million), by Type 2024 & 2032
- Figure 27: Asia Pacific Video Content Analytics Industry Revenue Share (%), by Type 2024 & 2032
- Figure 28: Asia Pacific Video Content Analytics Industry Revenue (Million), by End User 2024 & 2032
- Figure 29: Asia Pacific Video Content Analytics Industry Revenue Share (%), by End User 2024 & 2032
- Figure 30: Asia Pacific Video Content Analytics Industry Revenue (Million), by Country 2024 & 2032
- Figure 31: Asia Pacific Video Content Analytics Industry Revenue Share (%), by Country 2024 & 2032
- Figure 32: Latin America Video Content Analytics Industry Revenue (Million), by Type 2024 & 2032
- Figure 33: Latin America Video Content Analytics Industry Revenue Share (%), by Type 2024 & 2032
- Figure 34: Latin America Video Content Analytics Industry Revenue (Million), by End User 2024 & 2032
- Figure 35: Latin America Video Content Analytics Industry Revenue Share (%), by End User 2024 & 2032
- Figure 36: Latin America Video Content Analytics Industry Revenue (Million), by Country 2024 & 2032
- Figure 37: Latin America Video Content Analytics Industry Revenue Share (%), by Country 2024 & 2032
- Figure 38: Middle East Video Content Analytics Industry Revenue (Million), by Type 2024 & 2032
- Figure 39: Middle East Video Content Analytics Industry Revenue Share (%), by Type 2024 & 2032
- Figure 40: Middle East Video Content Analytics Industry Revenue (Million), by End User 2024 & 2032
- Figure 41: Middle East Video Content Analytics Industry Revenue Share (%), by End User 2024 & 2032
- Figure 42: Middle East Video Content Analytics Industry Revenue (Million), by Country 2024 & 2032
- Figure 43: Middle East Video Content Analytics Industry Revenue Share (%), by Country 2024 & 2032
List of Tables
- Table 1: Global Video Content Analytics Industry Revenue Million Forecast, by Region 2019 & 2032
- Table 2: Global Video Content Analytics Industry Revenue Million Forecast, by Type 2019 & 2032
- Table 3: Global Video Content Analytics Industry Revenue Million Forecast, by End User 2019 & 2032
- Table 4: Global Video Content Analytics Industry Revenue Million Forecast, by Region 2019 & 2032
- Table 5: Global Video Content Analytics Industry Revenue Million Forecast, by Country 2019 & 2032
- Table 6: United States Video Content Analytics Industry Revenue (Million) Forecast, by Application 2019 & 2032
- Table 7: Canada Video Content Analytics Industry Revenue (Million) Forecast, by Application 2019 & 2032
- Table 8: Mexico Video Content Analytics Industry Revenue (Million) Forecast, by Application 2019 & 2032
- Table 9: Global Video Content Analytics Industry Revenue Million Forecast, by Country 2019 & 2032
- Table 10: Germany Video Content Analytics Industry Revenue (Million) Forecast, by Application 2019 & 2032
- Table 11: United Kingdom Video Content Analytics Industry Revenue (Million) Forecast, by Application 2019 & 2032
- Table 12: France Video Content Analytics Industry Revenue (Million) Forecast, by Application 2019 & 2032
- Table 13: Spain Video Content Analytics Industry Revenue (Million) Forecast, by Application 2019 & 2032
- Table 14: Italy Video Content Analytics Industry Revenue (Million) Forecast, by Application 2019 & 2032
- Table 15: Spain Video Content Analytics Industry Revenue (Million) Forecast, by Application 2019 & 2032
- Table 16: Belgium Video Content Analytics Industry Revenue (Million) Forecast, by Application 2019 & 2032
- Table 17: Netherland Video Content Analytics Industry Revenue (Million) Forecast, by Application 2019 & 2032
- Table 18: Nordics Video Content Analytics Industry Revenue (Million) Forecast, by Application 2019 & 2032
- Table 19: Rest of Europe Video Content Analytics Industry Revenue (Million) Forecast, by Application 2019 & 2032
- Table 20: Global Video Content Analytics Industry Revenue Million Forecast, by Country 2019 & 2032
- Table 21: China Video Content Analytics Industry Revenue (Million) Forecast, by Application 2019 & 2032
- Table 22: Japan Video Content Analytics Industry Revenue (Million) Forecast, by Application 2019 & 2032
- Table 23: India Video Content Analytics Industry Revenue (Million) Forecast, by Application 2019 & 2032
- Table 24: South Korea Video Content Analytics Industry Revenue (Million) Forecast, by Application 2019 & 2032
- Table 25: Southeast Asia Video Content Analytics Industry Revenue (Million) Forecast, by Application 2019 & 2032
- Table 26: Australia Video Content Analytics Industry Revenue (Million) Forecast, by Application 2019 & 2032
- Table 27: Indonesia Video Content Analytics Industry Revenue (Million) Forecast, by Application 2019 & 2032
- Table 28: Phillipes Video Content Analytics Industry Revenue (Million) Forecast, by Application 2019 & 2032
- Table 29: Singapore Video Content Analytics Industry Revenue (Million) Forecast, by Application 2019 & 2032
- Table 30: Thailandc Video Content Analytics Industry Revenue (Million) Forecast, by Application 2019 & 2032
- Table 31: Rest of Asia Pacific Video Content Analytics Industry Revenue (Million) Forecast, by Application 2019 & 2032
- Table 32: Global Video Content Analytics Industry Revenue Million Forecast, by Country 2019 & 2032
- Table 33: Brazil Video Content Analytics Industry Revenue (Million) Forecast, by Application 2019 & 2032
- Table 34: Argentina Video Content Analytics Industry Revenue (Million) Forecast, by Application 2019 & 2032
- Table 35: Peru Video Content Analytics Industry Revenue (Million) Forecast, by Application 2019 & 2032
- Table 36: Chile Video Content Analytics Industry Revenue (Million) Forecast, by Application 2019 & 2032
- Table 37: Colombia Video Content Analytics Industry Revenue (Million) Forecast, by Application 2019 & 2032
- Table 38: Ecuador Video Content Analytics Industry Revenue (Million) Forecast, by Application 2019 & 2032
- Table 39: Venezuela Video Content Analytics Industry Revenue (Million) Forecast, by Application 2019 & 2032
- Table 40: Rest of South America Video Content Analytics Industry Revenue (Million) Forecast, by Application 2019 & 2032
- Table 41: Global Video Content Analytics Industry Revenue Million Forecast, by Country 2019 & 2032
- Table 42: United States Video Content Analytics Industry Revenue (Million) Forecast, by Application 2019 & 2032
- Table 43: Canada Video Content Analytics Industry Revenue (Million) Forecast, by Application 2019 & 2032
- Table 44: Mexico Video Content Analytics Industry Revenue (Million) Forecast, by Application 2019 & 2032
- Table 45: Global Video Content Analytics Industry Revenue Million Forecast, by Country 2019 & 2032
- Table 46: United Arab Emirates Video Content Analytics Industry Revenue (Million) Forecast, by Application 2019 & 2032
- Table 47: Saudi Arabia Video Content Analytics Industry Revenue (Million) Forecast, by Application 2019 & 2032
- Table 48: South Africa Video Content Analytics Industry Revenue (Million) Forecast, by Application 2019 & 2032
- Table 49: Rest of Middle East and Africa Video Content Analytics Industry Revenue (Million) Forecast, by Application 2019 & 2032
- Table 50: Global Video Content Analytics Industry Revenue Million Forecast, by Type 2019 & 2032
- Table 51: Global Video Content Analytics Industry Revenue Million Forecast, by End User 2019 & 2032
- Table 52: Global Video Content Analytics Industry Revenue Million Forecast, by Country 2019 & 2032
- Table 53: Global Video Content Analytics Industry Revenue Million Forecast, by Type 2019 & 2032
- Table 54: Global Video Content Analytics Industry Revenue Million Forecast, by End User 2019 & 2032
- Table 55: Global Video Content Analytics Industry Revenue Million Forecast, by Country 2019 & 2032
- Table 56: Global Video Content Analytics Industry Revenue Million Forecast, by Type 2019 & 2032
- Table 57: Global Video Content Analytics Industry Revenue Million Forecast, by End User 2019 & 2032
- Table 58: Global Video Content Analytics Industry Revenue Million Forecast, by Country 2019 & 2032
- Table 59: Global Video Content Analytics Industry Revenue Million Forecast, by Type 2019 & 2032
- Table 60: Global Video Content Analytics Industry Revenue Million Forecast, by End User 2019 & 2032
- Table 61: Global Video Content Analytics Industry Revenue Million Forecast, by Country 2019 & 2032
- Table 62: Global Video Content Analytics Industry Revenue Million Forecast, by Type 2019 & 2032
- Table 63: Global Video Content Analytics Industry Revenue Million Forecast, by End User 2019 & 2032
- Table 64: Global Video Content Analytics Industry Revenue Million Forecast, by Country 2019 & 2032
Frequently Asked Questions
1. What is the projected Compound Annual Growth Rate (CAGR) of the Video Content Analytics Industry?
The projected CAGR is approximately 15.20%.
2. Which companies are prominent players in the Video Content Analytics Industry?
Key companies in the market include Honeywell International Inc, Herta Security SL, ISS Inc, Qognify Limited, Cisco Systems Inc, Genetec Inc, Verint Systems Inc, NEC Corporation, Agent Video Intelligence Ltd, Identiv Inc, Aventura Technologies Inc, International Business Machines Corporation, Objectvideo Labs LLC.
3. What are the main segments of the Video Content Analytics Industry?
The market segments include Type, End User.
4. Can you provide details about the market size?
The market size is estimated to be USD 2.96 Million as of 2022.
5. What are some drivers contributing to market growth?
Growing Emphasis among Enterprises on Obtaining Actionable Insights; Technological Advancements coupled with High Investments in City Surveillance.
6. What are the notable trends driving market growth?
Retail Industry is expected to Hold a Major Share.
7. Are there any restraints impacting market growth?
Steep Learning Curve Regarding Connected Agriculture.
8. Can you provide examples of recent developments in the market?
November 2022: Servian, Australia's data consulting firm, and VisualCortex, the video intelligence Platform bridging computer vision's potential to practical business outcomes, have signed a referral and services agreement. According to the terms of the collaboration agreement, Servian would be able to recommend VisualCortex's Video Intelligence Platform to its current and potential clients in Australia and New Zealand, as well as provide implementation, integration, model creation, and related professional services.
9. What pricing options are available for accessing the report?
Pricing options include single-user, multi-user, and enterprise licenses priced at USD 4750, USD 5250, and USD 8750 respectively.
10. Is the market size provided in terms of value or volume?
The market size is provided in terms of value, measured in Million.
11. Are there any specific market keywords associated with the report?
Yes, the market keyword associated with the report is "Video Content Analytics Industry," which aids in identifying and referencing the specific market segment covered.
12. How do I determine which pricing option suits my needs best?
The pricing options vary based on user requirements and access needs. Individual users may opt for single-user licenses, while businesses requiring broader access may choose multi-user or enterprise licenses for cost-effective access to the report.
13. Are there any additional resources or data provided in the Video Content Analytics Industry report?
While the report offers comprehensive insights, it's advisable to review the specific contents or supplementary materials provided to ascertain if additional resources or data are available.
14. How can I stay updated on further developments or reports in the Video Content Analytics Industry?
To stay informed about further developments, trends, and reports in the Video Content Analytics Industry, consider subscribing to industry newsletters, following relevant companies and organizations, or regularly checking reputable industry news sources and publications.
Methodology
Step 1 - Identification of Relevant Samples Size from Population Database


Step 2 - Approaches for Defining Global Market Size (Value, Volume* & Price*)

Note*: In applicable scenarios
Step 3 - Data Sources
Primary Research
- Web Analytics
- Survey Reports
- Research Institute
- Latest Research Reports
- Opinion Leaders
Secondary Research
- Annual Reports
- White Paper
- Latest Press Release
- Industry Association
- Paid Database
- Investor Presentations

Step 4 - Data Triangulation
Involves using different sources of information in order to increase the validity of a study
These sources are likely to be stakeholders in a program - participants, other researchers, program staff, other community members, and so on.
Then we put all data in single framework & apply various statistical tools to find out the dynamic on the market.
During the analysis stage, feedback from the stakeholder groups would be compared to determine areas of agreement as well as areas of divergence


