
Key Insights
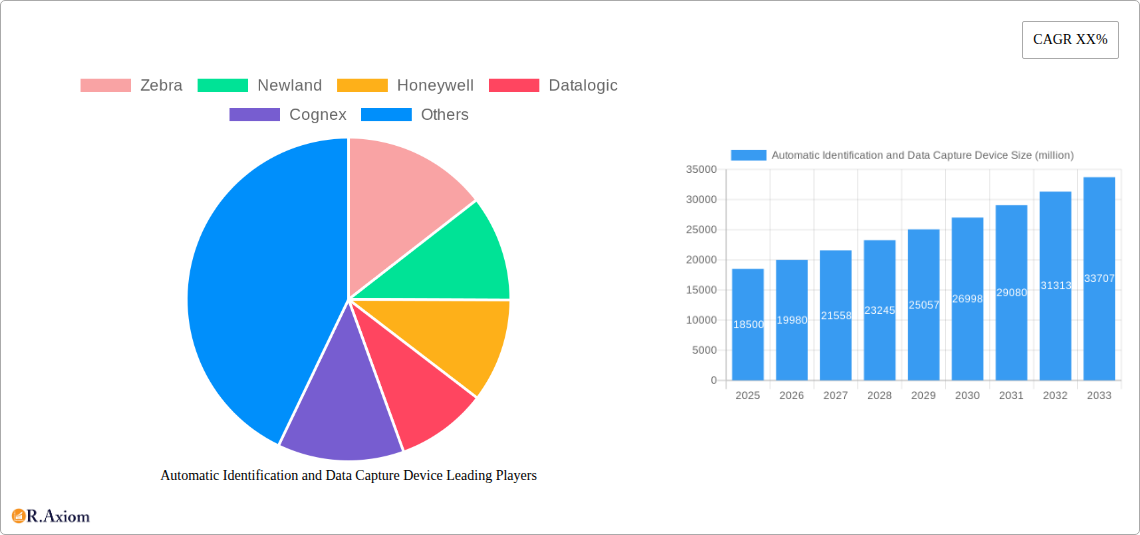
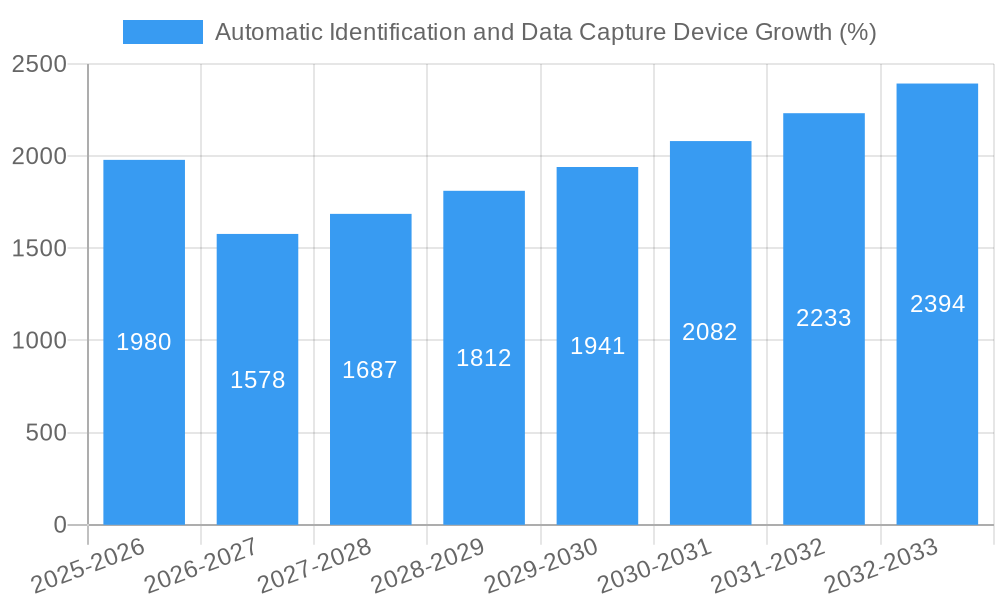
The Automatic Identification and Data Capture (AIDC) device market is poised for substantial growth, projected to reach an estimated USD 18.5 billion by 2025, with a robust Compound Annual Growth Rate (CAGR) of approximately 8.5% expected throughout the forecast period of 2025-2033. This expansion is fundamentally driven by the escalating demand for enhanced operational efficiency, improved inventory management, and streamlined supply chains across a multitude of industries. The increasing adoption of AIDC technologies, including barcode scanners, QR code readers, RFID tags, and biometric systems, is critical for businesses seeking to minimize errors, accelerate transaction processing, and gain real-time visibility into their operations. Sectors like retailing, manufacturing, and transportation and logistics are leading this charge, leveraging AIDC for everything from point-of-sale systems and warehouse automation to asset tracking and fleet management. The government sector is also a significant contributor, employing AIDC for identification, security, and administrative purposes.
Further fueling this market dynamism are key trends such as the rise of the Internet of Things (IoT), which integrates AIDC devices into interconnected systems for advanced data collection and analysis. The development of smaller, more durable, and cost-effective AIDC hardware, coupled with advancements in software for data processing and analytics, is also playing a pivotal role. While the market benefits from these drivers, certain restraints, such as initial implementation costs for smaller enterprises and concerns surrounding data security and privacy, need to be addressed. However, the overarching benefits of increased productivity, reduced operational costs, and enhanced customer experiences continue to propel AIDC device adoption, ensuring a promising trajectory for the market.
Automatic Identification and Data Capture Device Market Concentration & Innovation
The global Automatic Identification and Data Capture (AIDC) device market exhibits a moderate to high concentration, with leading players such as Zebra, Honeywell, Datalogic, and Cognex holding significant market shares, estimated to be over 70% collectively. Shenzhen MinDe electronics technology Ltd., SICK, Zebex, Denso Wave, CipherLAB, NCR, Omron (Microscan), Argox (SATO), Keyence, and Code are also prominent contributors, driving innovation and catering to specialized industry needs. Innovation is primarily fueled by advancements in data processing, miniaturization, ruggedization for harsh environments, and the integration of AI and machine learning for predictive analytics. Regulatory frameworks, particularly in sectors like healthcare and government, are increasingly mandating AIDC solutions for enhanced traceability and security, thereby influencing product development and adoption. The emergence of product substitutes, such as manual data entry or less sophisticated tracking methods, remains a challenge, though the superior efficiency and accuracy of AIDC devices generally outweigh these alternatives. End-user trends highlight a growing demand for real-time data visibility, supply chain optimization, and enhanced customer experiences. Mergers and acquisitions (M&A) activity is moderate, with strategic acquisitions aimed at expanding product portfolios, geographical reach, and technological capabilities, with estimated deal values ranging from tens to hundreds of million dollars.
Automatic Identification and Data Capture Device Industry Trends & Insights
The Automatic Identification and Data Capture (AIDC) device market is poised for substantial growth, driven by an intensifying need for operational efficiency, accuracy, and real-time data insights across a multitude of industries. The Compound Annual Growth Rate (CAGR) for the AIDC market is projected to be robust, estimated at 15.XX%, indicating a significant expansion from its current valuation. Market penetration is steadily increasing, as businesses worldwide recognize the tangible benefits of automating data collection and management. Key growth drivers include the escalating complexity of global supply chains, demanding granular visibility from origin to destination. The retail sector, in particular, is a major adopter, leveraging AIDC for inventory management, point-of-sale operations, and personalized customer engagement, leading to an estimated market contribution of over 200 million dollars from this segment alone. Manufacturing operations benefit immensely from AIDC for production tracking, quality control, and asset management, contributing an estimated 180 million dollars. The transportation and logistics industry relies heavily on AIDC for shipment tracking, package sorting, and route optimization, with an estimated market value of 160 million dollars. Technological disruptions are a constant feature, with the evolution of barcode and QR code technology offering higher data densities and improved scan rates. RFID technology is gaining traction due to its ability to read multiple tags simultaneously and its application in contactless identification. Biometric AIDC solutions are also on the rise, particularly in security-sensitive applications like government and healthcare, offering unparalleled individual identification. Consumer preferences are increasingly aligned with seamless and instant transactions, which AIDC solutions facilitate. The competitive dynamics are characterized by intense innovation, with companies striving to offer more intelligent, connected, and user-friendly devices. The market penetration of advanced AIDC solutions is expected to reach over 60% by the end of the forecast period. The overall market size is projected to exceed 1.2 million million dollars.
Dominant Markets & Segments in Automatic Identification and Data Capture Device
The Automatic Identification and Data Capture (AIDC) device market is currently dominated by the Manufacturing and Transportation and Logistics segments, collectively accounting for over 50% of the global market revenue. These sectors are characterized by large-scale operations, complex supply chains, and a critical need for efficient tracking and data management.
Manufacturing:
- Key Drivers: The imperative for Industry 4.0 adoption, including smart factories and the Internet of Things (IoT), drives the demand for real-time production monitoring, quality control, and asset tracking. Economic policies promoting manufacturing efficiency and automation further bolster growth. The robust integration of AIDC devices into manufacturing processes contributes an estimated 180 million dollar market value annually.
- Dominance Analysis: Advanced AIDC solutions, such as industrial-grade barcode scanners, RFID tags, and machine vision systems from companies like Cognex and Keyence, are integral to modern manufacturing floors. These technologies enable precise tracking of components, work-in-progress, and finished goods, significantly reducing errors and improving throughput.
Transportation and Logistics:
- Key Drivers: The globalization of trade and the e-commerce boom necessitate sophisticated tracking and tracing capabilities for goods in transit. Streamlined warehouse operations and efficient last-mile delivery are paramount. Government initiatives focused on improving supply chain visibility and security also contribute to market expansion. This segment is estimated to generate over 160 million dollars annually.
- Dominance Analysis: Barcode and QR code scanners are ubiquitous for package identification and sorting. RFID technology is increasingly deployed for high-value asset tracking and container management. Companies like Zebra and Honeywell are key players, providing ruggedized mobile computers and scanners designed for the demanding logistics environment.
Retailing:
- Key Drivers: The shift towards omnichannel retail, inventory accuracy, and enhanced customer experiences fuels AIDC adoption. Mobile POS systems, self-checkout kiosks, and inventory management solutions powered by AIDC are becoming standard. Consumer demand for quick and frictionless purchasing experiences is a significant influencer. This segment is estimated to contribute over 200 million dollars annually.
- Dominance Analysis: Barcode and QR code scanners are essential at the point of sale and for inventory management. RFID is gaining traction for high-value merchandise tagging and real-time inventory visibility. NCR and Zebra are prominent in this space, offering a wide range of solutions tailored for retail environments.
Government:
- Key Drivers: Security, identification, and efficiency in public services are key motivators. AIDC solutions are used for document management, border control, and citizen identification. Regulatory mandates for data security and integrity are significant growth catalysts. The government segment is estimated to be valued at over 120 million dollars annually.
- Dominance Analysis: Biometric solutions, secure barcode systems, and RFID for access control and asset management are crucial. Companies like CipherLAB and Omron (Microscan) are involved in providing solutions for this sector.
Hospital:
- Key Drivers: Patient safety, medication administration accuracy, and efficient tracking of medical equipment and supplies are paramount. Compliance with healthcare regulations and the need for precise record-keeping drive AIDC adoption. The healthcare segment is estimated to be worth over 90 million dollars annually.
- Dominance Analysis: Barcode and QR code scanners are used for patient identification, medication verification, and asset tracking. RFID is being explored for tracking high-value equipment and for patient flow management.
Within Types, Barcode & QR Code technology continues to hold the largest market share due to its cost-effectiveness and widespread adoption, estimated at over 45% of the total market. RFID is the fastest-growing segment, projected to witness a CAGR of 18.XX%, driven by its superior capabilities in high-volume data capture and contactless identification, with an estimated market share of 30%. Biometrics, though a smaller segment, is experiencing significant growth (CAGR of 16.XX%) in specialized applications requiring high security, with an estimated market share of 15%. Others, including technologies like magnetic stripe readers, represent the remaining market share.
Automatic Identification and Data Capture Device Product Developments
Product developments in the AIDC device market are characterized by enhanced speed, accuracy, and connectivity. Innovations focus on miniaturization for wearable devices, ruggedization for harsh industrial environments, and the integration of AI for predictive analytics and decision support. Key trends include the development of advanced imaging scanners capable of reading damaged or poorly printed barcodes and QR codes, as well as high-performance RFID readers with extended ranges. Companies are also investing in software solutions that seamlessly integrate AIDC data into existing enterprise systems, offering real-time visibility and actionable insights. The competitive advantage lies in providing comprehensive solutions that address specific industry pain points, such as Zebra's rugged mobile computers designed for logistics or Cognex's machine vision systems for manufacturing quality control.
Report Scope & Segmentation Analysis
This report provides a comprehensive analysis of the Automatic Identification and Data Capture (AIDC) device market, segmented by Application and Type.
- Application Segments: The report covers Retailing, Manufacturing, Transportation and Logistics, Government, and Hospital. Each segment is analyzed for its market size, growth projections, and key competitive dynamics, with the Retailing segment estimated to grow at a CAGR of 14.XX% and an estimated market value of over 200 million dollars.
- Type Segments: The market is segmented into Barcode & QR Code, RFID, Biometrics, and Others. Barcode & QR Code is expected to maintain its dominant position but with moderate growth, while RFID is projected to be the fastest-growing segment, with an estimated CAGR of 18.XX%. Biometrics is also anticipated to experience robust growth due to increasing security demands.
Key Drivers of Automatic Identification and Data Capture Device Growth
Several factors are propelling the growth of the Automatic Identification and Data Capture (AIDC) device market. Technologically, the relentless advancement in scanning technologies, miniaturization of devices, and improved data processing capabilities are key drivers. Economically, the increasing focus on operational efficiency, cost reduction, and supply chain optimization across industries like manufacturing and logistics is creating substantial demand. Regulatory frameworks in sectors such as healthcare and government are also mandating the use of AIDC for enhanced traceability and security, further stimulating market expansion. The proliferation of e-commerce and the subsequent demand for accurate and rapid inventory management and shipping processes are significant economic catalysts.
Challenges in the Automatic Identification and Data Capture Device Sector
Despite the positive growth trajectory, the AIDC device sector faces certain challenges. High initial investment costs for advanced AIDC systems can be a barrier for small and medium-sized enterprises (SMEs). Interoperability issues between different AIDC technologies and existing IT infrastructure can also hinder seamless integration. Cybersecurity concerns related to the vast amounts of data captured by these devices require robust security measures, adding to implementation complexity and cost. Additionally, the rapid pace of technological evolution necessitates continuous investment in upgrades, posing a challenge for businesses with limited IT budgets. Supply chain disruptions, as witnessed in recent global events, can impact the availability and cost of components.
Emerging Opportunities in Automatic Identification and Data Capture Device
The AIDC market is ripe with emerging opportunities. The growing adoption of the Industrial Internet of Things (IIoT) presents a significant avenue for growth, with AIDC devices acting as crucial data collection endpoints for smart manufacturing and logistics. The expansion of autonomous systems, such as self-driving vehicles and drones, will further necessitate sophisticated AIDC for real-time identification and tracking. The increasing demand for personalized customer experiences in retail and healthcare also offers opportunities for innovative AIDC applications, such as enhanced loyalty programs and patient identification systems. Furthermore, the development of AI-powered analytics on AIDC data is creating opportunities for predictive maintenance, fraud detection, and optimized resource allocation. The healthcare sector, with its growing need for accurate patient identification and medication management, represents a substantial untapped market.
Leading Players in the Automatic Identification and Data Capture Device Market
- Zebra
- Newland
- Honeywell
- Datalogic
- Cognex
- Shenzhen MinDe electronics technology Ltd.
- SICK
- Zebex
- Denso Wave
- CipherLAB
- NCR
- Omron(Microscan)
- Argox(SATO)
- Keyence
- Code
Key Developments in Automatic Identification and Data Capture Device Industry
- 2023/09: Zebra Technologies launches a new series of rugged mobile computers with enhanced scanning capabilities for demanding supply chain environments.
- 2023/07: Honeywell announces advancements in its RFID reader technology, offering improved read ranges and data throughput.
- 2023/05: Cognex introduces new machine vision systems with integrated AI for faster and more accurate defect detection in manufacturing.
- 2022/11: Datalogic acquires a specialized provider of RFID solutions to expand its product portfolio in the logistics sector.
- 2022/08: Shenzhen MinDe electronics technology Ltd. patents a new dual-technology scanner combining barcode and RFID reading capabilities.
Strategic Outlook for Automatic Identification and Data Capture Device Market
The strategic outlook for the Automatic Identification and Data Capture (AIDC) device market remains highly positive, driven by the inexorable march towards digital transformation and automation across all major industries. The increasing integration of AIDC with cloud computing and AI will unlock new levels of data intelligence, enabling predictive analytics and proactive decision-making. Companies that can offer end-to-end solutions, encompassing hardware, software, and analytics, will be best positioned for success. The growing emphasis on supply chain resilience and visibility in the post-pandemic era further underscores the strategic importance of AIDC technologies. Investments in R&D focused on emerging technologies like advanced imaging, IoT connectivity, and miniaturization will be crucial for maintaining a competitive edge and capitalizing on the substantial growth opportunities anticipated in the coming years.
Automatic Identification and Data Capture Device Segmentation
-
1. Application
- 1.1. Retailing
- 1.2. Manufacturing
- 1.3. Transportation and Logistic
- 1.4. Government
- 1.5. Hospital
-
2. Types
- 2.1. Barcode & QR Code
- 2.2. RFID
- 2.3. Biometrics
- 2.4. Others
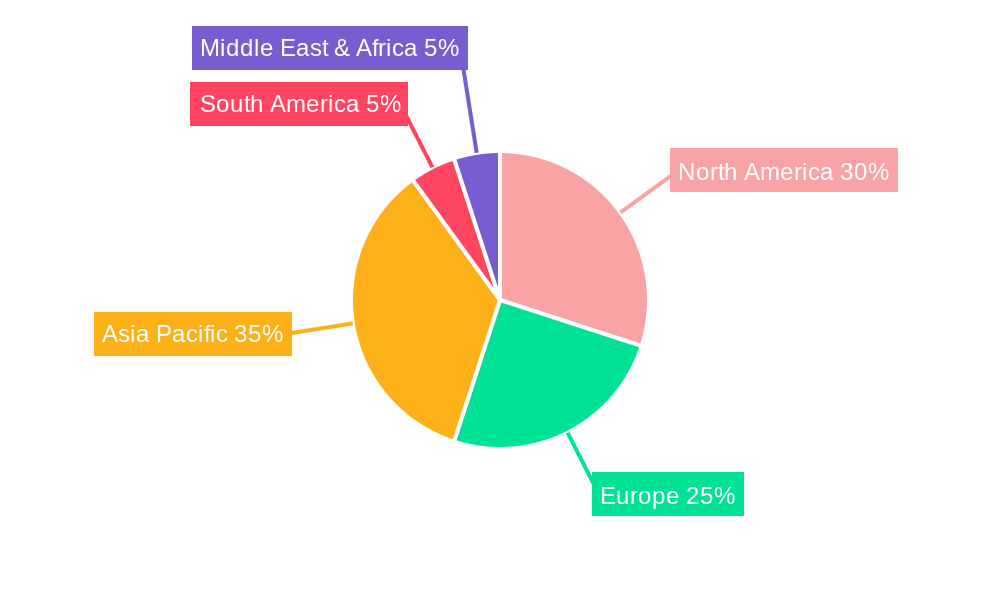
Automatic Identification and Data Capture Device Segmentation By Geography
-
1. North America
- 1.1. United States
- 1.2. Canada
- 1.3. Mexico
-
2. South America
- 2.1. Brazil
- 2.2. Argentina
- 2.3. Rest of South America
-
3. Europe
- 3.1. United Kingdom
- 3.2. Germany
- 3.3. France
- 3.4. Italy
- 3.5. Spain
- 3.6. Russia
- 3.7. Benelux
- 3.8. Nordics
- 3.9. Rest of Europe
-
4. Middle East & Africa
- 4.1. Turkey
- 4.2. Israel
- 4.3. GCC
- 4.4. North Africa
- 4.5. South Africa
- 4.6. Rest of Middle East & Africa
-
5. Asia Pacific
- 5.1. China
- 5.2. India
- 5.3. Japan
- 5.4. South Korea
- 5.5. ASEAN
- 5.6. Oceania
- 5.7. Rest of Asia Pacific
Automatic Identification and Data Capture Device REPORT HIGHLIGHTS
| Aspects | Details |
|---|---|
| Study Period | 2019-2033 |
| Base Year | 2024 |
| Estimated Year | 2025 |
| Forecast Period | 2025-2033 |
| Historical Period | 2019-2024 |
| Growth Rate | CAGR of XX% from 2019-2033 |
| Segmentation |
|
Table of Contents
- 1. Introduction
- 1.1. Research Scope
- 1.2. Market Segmentation
- 1.3. Research Methodology
- 1.4. Definitions and Assumptions
- 2. Executive Summary
- 2.1. Introduction
- 3. Market Dynamics
- 3.1. Introduction
- 3.2. Market Drivers
- 3.3. Market Restrains
- 3.4. Market Trends
- 4. Market Factor Analysis
- 4.1. Porters Five Forces
- 4.2. Supply/Value Chain
- 4.3. PESTEL analysis
- 4.4. Market Entropy
- 4.5. Patent/Trademark Analysis
- 5. Global Automatic Identification and Data Capture Device Analysis, Insights and Forecast, 2019-2031
- 5.1. Market Analysis, Insights and Forecast - by Application
- 5.1.1. Retailing
- 5.1.2. Manufacturing
- 5.1.3. Transportation and Logistic
- 5.1.4. Government
- 5.1.5. Hospital
- 5.2. Market Analysis, Insights and Forecast - by Types
- 5.2.1. Barcode & QR Code
- 5.2.2. RFID
- 5.2.3. Biometrics
- 5.2.4. Others
- 5.3. Market Analysis, Insights and Forecast - by Region
- 5.3.1. North America
- 5.3.2. South America
- 5.3.3. Europe
- 5.3.4. Middle East & Africa
- 5.3.5. Asia Pacific
- 5.1. Market Analysis, Insights and Forecast - by Application
- 6. North America Automatic Identification and Data Capture Device Analysis, Insights and Forecast, 2019-2031
- 6.1. Market Analysis, Insights and Forecast - by Application
- 6.1.1. Retailing
- 6.1.2. Manufacturing
- 6.1.3. Transportation and Logistic
- 6.1.4. Government
- 6.1.5. Hospital
- 6.2. Market Analysis, Insights and Forecast - by Types
- 6.2.1. Barcode & QR Code
- 6.2.2. RFID
- 6.2.3. Biometrics
- 6.2.4. Others
- 6.1. Market Analysis, Insights and Forecast - by Application
- 7. South America Automatic Identification and Data Capture Device Analysis, Insights and Forecast, 2019-2031
- 7.1. Market Analysis, Insights and Forecast - by Application
- 7.1.1. Retailing
- 7.1.2. Manufacturing
- 7.1.3. Transportation and Logistic
- 7.1.4. Government
- 7.1.5. Hospital
- 7.2. Market Analysis, Insights and Forecast - by Types
- 7.2.1. Barcode & QR Code
- 7.2.2. RFID
- 7.2.3. Biometrics
- 7.2.4. Others
- 7.1. Market Analysis, Insights and Forecast - by Application
- 8. Europe Automatic Identification and Data Capture Device Analysis, Insights and Forecast, 2019-2031
- 8.1. Market Analysis, Insights and Forecast - by Application
- 8.1.1. Retailing
- 8.1.2. Manufacturing
- 8.1.3. Transportation and Logistic
- 8.1.4. Government
- 8.1.5. Hospital
- 8.2. Market Analysis, Insights and Forecast - by Types
- 8.2.1. Barcode & QR Code
- 8.2.2. RFID
- 8.2.3. Biometrics
- 8.2.4. Others
- 8.1. Market Analysis, Insights and Forecast - by Application
- 9. Middle East & Africa Automatic Identification and Data Capture Device Analysis, Insights and Forecast, 2019-2031
- 9.1. Market Analysis, Insights and Forecast - by Application
- 9.1.1. Retailing
- 9.1.2. Manufacturing
- 9.1.3. Transportation and Logistic
- 9.1.4. Government
- 9.1.5. Hospital
- 9.2. Market Analysis, Insights and Forecast - by Types
- 9.2.1. Barcode & QR Code
- 9.2.2. RFID
- 9.2.3. Biometrics
- 9.2.4. Others
- 9.1. Market Analysis, Insights and Forecast - by Application
- 10. Asia Pacific Automatic Identification and Data Capture Device Analysis, Insights and Forecast, 2019-2031
- 10.1. Market Analysis, Insights and Forecast - by Application
- 10.1.1. Retailing
- 10.1.2. Manufacturing
- 10.1.3. Transportation and Logistic
- 10.1.4. Government
- 10.1.5. Hospital
- 10.2. Market Analysis, Insights and Forecast - by Types
- 10.2.1. Barcode & QR Code
- 10.2.2. RFID
- 10.2.3. Biometrics
- 10.2.4. Others
- 10.1. Market Analysis, Insights and Forecast - by Application
- 11. Competitive Analysis
- 11.1. Global Market Share Analysis 2024
- 11.2. Company Profiles
- 11.2.1 Zebra
- 11.2.1.1. Overview
- 11.2.1.2. Products
- 11.2.1.3. SWOT Analysis
- 11.2.1.4. Recent Developments
- 11.2.1.5. Financials (Based on Availability)
- 11.2.2 Newland
- 11.2.2.1. Overview
- 11.2.2.2. Products
- 11.2.2.3. SWOT Analysis
- 11.2.2.4. Recent Developments
- 11.2.2.5. Financials (Based on Availability)
- 11.2.3 Honeywell
- 11.2.3.1. Overview
- 11.2.3.2. Products
- 11.2.3.3. SWOT Analysis
- 11.2.3.4. Recent Developments
- 11.2.3.5. Financials (Based on Availability)
- 11.2.4 Datalogic
- 11.2.4.1. Overview
- 11.2.4.2. Products
- 11.2.4.3. SWOT Analysis
- 11.2.4.4. Recent Developments
- 11.2.4.5. Financials (Based on Availability)
- 11.2.5 Cognex
- 11.2.5.1. Overview
- 11.2.5.2. Products
- 11.2.5.3. SWOT Analysis
- 11.2.5.4. Recent Developments
- 11.2.5.5. Financials (Based on Availability)
- 11.2.6 Shenzhen MinDe electronics technology Ltd.
- 11.2.6.1. Overview
- 11.2.6.2. Products
- 11.2.6.3. SWOT Analysis
- 11.2.6.4. Recent Developments
- 11.2.6.5. Financials (Based on Availability)
- 11.2.7 SICK
- 11.2.7.1. Overview
- 11.2.7.2. Products
- 11.2.7.3. SWOT Analysis
- 11.2.7.4. Recent Developments
- 11.2.7.5. Financials (Based on Availability)
- 11.2.8 Zebex
- 11.2.8.1. Overview
- 11.2.8.2. Products
- 11.2.8.3. SWOT Analysis
- 11.2.8.4. Recent Developments
- 11.2.8.5. Financials (Based on Availability)
- 11.2.9 Denso Wave
- 11.2.9.1. Overview
- 11.2.9.2. Products
- 11.2.9.3. SWOT Analysis
- 11.2.9.4. Recent Developments
- 11.2.9.5. Financials (Based on Availability)
- 11.2.10 CipherLAB
- 11.2.10.1. Overview
- 11.2.10.2. Products
- 11.2.10.3. SWOT Analysis
- 11.2.10.4. Recent Developments
- 11.2.10.5. Financials (Based on Availability)
- 11.2.11 NCR
- 11.2.11.1. Overview
- 11.2.11.2. Products
- 11.2.11.3. SWOT Analysis
- 11.2.11.4. Recent Developments
- 11.2.11.5. Financials (Based on Availability)
- 11.2.12 Omron(Microscan)
- 11.2.12.1. Overview
- 11.2.12.2. Products
- 11.2.12.3. SWOT Analysis
- 11.2.12.4. Recent Developments
- 11.2.12.5. Financials (Based on Availability)
- 11.2.13 Argox(SATO)
- 11.2.13.1. Overview
- 11.2.13.2. Products
- 11.2.13.3. SWOT Analysis
- 11.2.13.4. Recent Developments
- 11.2.13.5. Financials (Based on Availability)
- 11.2.14 Keyence
- 11.2.14.1. Overview
- 11.2.14.2. Products
- 11.2.14.3. SWOT Analysis
- 11.2.14.4. Recent Developments
- 11.2.14.5. Financials (Based on Availability)
- 11.2.15 Code
- 11.2.15.1. Overview
- 11.2.15.2. Products
- 11.2.15.3. SWOT Analysis
- 11.2.15.4. Recent Developments
- 11.2.15.5. Financials (Based on Availability)
- 11.2.1 Zebra
List of Figures
- Figure 1: Global Automatic Identification and Data Capture Device Revenue Breakdown (million, %) by Region 2024 & 2032
- Figure 2: North America Automatic Identification and Data Capture Device Revenue (million), by Application 2024 & 2032
- Figure 3: North America Automatic Identification and Data Capture Device Revenue Share (%), by Application 2024 & 2032
- Figure 4: North America Automatic Identification and Data Capture Device Revenue (million), by Types 2024 & 2032
- Figure 5: North America Automatic Identification and Data Capture Device Revenue Share (%), by Types 2024 & 2032
- Figure 6: North America Automatic Identification and Data Capture Device Revenue (million), by Country 2024 & 2032
- Figure 7: North America Automatic Identification and Data Capture Device Revenue Share (%), by Country 2024 & 2032
- Figure 8: South America Automatic Identification and Data Capture Device Revenue (million), by Application 2024 & 2032
- Figure 9: South America Automatic Identification and Data Capture Device Revenue Share (%), by Application 2024 & 2032
- Figure 10: South America Automatic Identification and Data Capture Device Revenue (million), by Types 2024 & 2032
- Figure 11: South America Automatic Identification and Data Capture Device Revenue Share (%), by Types 2024 & 2032
- Figure 12: South America Automatic Identification and Data Capture Device Revenue (million), by Country 2024 & 2032
- Figure 13: South America Automatic Identification and Data Capture Device Revenue Share (%), by Country 2024 & 2032
- Figure 14: Europe Automatic Identification and Data Capture Device Revenue (million), by Application 2024 & 2032
- Figure 15: Europe Automatic Identification and Data Capture Device Revenue Share (%), by Application 2024 & 2032
- Figure 16: Europe Automatic Identification and Data Capture Device Revenue (million), by Types 2024 & 2032
- Figure 17: Europe Automatic Identification and Data Capture Device Revenue Share (%), by Types 2024 & 2032
- Figure 18: Europe Automatic Identification and Data Capture Device Revenue (million), by Country 2024 & 2032
- Figure 19: Europe Automatic Identification and Data Capture Device Revenue Share (%), by Country 2024 & 2032
- Figure 20: Middle East & Africa Automatic Identification and Data Capture Device Revenue (million), by Application 2024 & 2032
- Figure 21: Middle East & Africa Automatic Identification and Data Capture Device Revenue Share (%), by Application 2024 & 2032
- Figure 22: Middle East & Africa Automatic Identification and Data Capture Device Revenue (million), by Types 2024 & 2032
- Figure 23: Middle East & Africa Automatic Identification and Data Capture Device Revenue Share (%), by Types 2024 & 2032
- Figure 24: Middle East & Africa Automatic Identification and Data Capture Device Revenue (million), by Country 2024 & 2032
- Figure 25: Middle East & Africa Automatic Identification and Data Capture Device Revenue Share (%), by Country 2024 & 2032
- Figure 26: Asia Pacific Automatic Identification and Data Capture Device Revenue (million), by Application 2024 & 2032
- Figure 27: Asia Pacific Automatic Identification and Data Capture Device Revenue Share (%), by Application 2024 & 2032
- Figure 28: Asia Pacific Automatic Identification and Data Capture Device Revenue (million), by Types 2024 & 2032
- Figure 29: Asia Pacific Automatic Identification and Data Capture Device Revenue Share (%), by Types 2024 & 2032
- Figure 30: Asia Pacific Automatic Identification and Data Capture Device Revenue (million), by Country 2024 & 2032
- Figure 31: Asia Pacific Automatic Identification and Data Capture Device Revenue Share (%), by Country 2024 & 2032
List of Tables
- Table 1: Global Automatic Identification and Data Capture Device Revenue million Forecast, by Region 2019 & 2032
- Table 2: Global Automatic Identification and Data Capture Device Revenue million Forecast, by Application 2019 & 2032
- Table 3: Global Automatic Identification and Data Capture Device Revenue million Forecast, by Types 2019 & 2032
- Table 4: Global Automatic Identification and Data Capture Device Revenue million Forecast, by Region 2019 & 2032
- Table 5: Global Automatic Identification and Data Capture Device Revenue million Forecast, by Application 2019 & 2032
- Table 6: Global Automatic Identification and Data Capture Device Revenue million Forecast, by Types 2019 & 2032
- Table 7: Global Automatic Identification and Data Capture Device Revenue million Forecast, by Country 2019 & 2032
- Table 8: United States Automatic Identification and Data Capture Device Revenue (million) Forecast, by Application 2019 & 2032
- Table 9: Canada Automatic Identification and Data Capture Device Revenue (million) Forecast, by Application 2019 & 2032
- Table 10: Mexico Automatic Identification and Data Capture Device Revenue (million) Forecast, by Application 2019 & 2032
- Table 11: Global Automatic Identification and Data Capture Device Revenue million Forecast, by Application 2019 & 2032
- Table 12: Global Automatic Identification and Data Capture Device Revenue million Forecast, by Types 2019 & 2032
- Table 13: Global Automatic Identification and Data Capture Device Revenue million Forecast, by Country 2019 & 2032
- Table 14: Brazil Automatic Identification and Data Capture Device Revenue (million) Forecast, by Application 2019 & 2032
- Table 15: Argentina Automatic Identification and Data Capture Device Revenue (million) Forecast, by Application 2019 & 2032
- Table 16: Rest of South America Automatic Identification and Data Capture Device Revenue (million) Forecast, by Application 2019 & 2032
- Table 17: Global Automatic Identification and Data Capture Device Revenue million Forecast, by Application 2019 & 2032
- Table 18: Global Automatic Identification and Data Capture Device Revenue million Forecast, by Types 2019 & 2032
- Table 19: Global Automatic Identification and Data Capture Device Revenue million Forecast, by Country 2019 & 2032
- Table 20: United Kingdom Automatic Identification and Data Capture Device Revenue (million) Forecast, by Application 2019 & 2032
- Table 21: Germany Automatic Identification and Data Capture Device Revenue (million) Forecast, by Application 2019 & 2032
- Table 22: France Automatic Identification and Data Capture Device Revenue (million) Forecast, by Application 2019 & 2032
- Table 23: Italy Automatic Identification and Data Capture Device Revenue (million) Forecast, by Application 2019 & 2032
- Table 24: Spain Automatic Identification and Data Capture Device Revenue (million) Forecast, by Application 2019 & 2032
- Table 25: Russia Automatic Identification and Data Capture Device Revenue (million) Forecast, by Application 2019 & 2032
- Table 26: Benelux Automatic Identification and Data Capture Device Revenue (million) Forecast, by Application 2019 & 2032
- Table 27: Nordics Automatic Identification and Data Capture Device Revenue (million) Forecast, by Application 2019 & 2032
- Table 28: Rest of Europe Automatic Identification and Data Capture Device Revenue (million) Forecast, by Application 2019 & 2032
- Table 29: Global Automatic Identification and Data Capture Device Revenue million Forecast, by Application 2019 & 2032
- Table 30: Global Automatic Identification and Data Capture Device Revenue million Forecast, by Types 2019 & 2032
- Table 31: Global Automatic Identification and Data Capture Device Revenue million Forecast, by Country 2019 & 2032
- Table 32: Turkey Automatic Identification and Data Capture Device Revenue (million) Forecast, by Application 2019 & 2032
- Table 33: Israel Automatic Identification and Data Capture Device Revenue (million) Forecast, by Application 2019 & 2032
- Table 34: GCC Automatic Identification and Data Capture Device Revenue (million) Forecast, by Application 2019 & 2032
- Table 35: North Africa Automatic Identification and Data Capture Device Revenue (million) Forecast, by Application 2019 & 2032
- Table 36: South Africa Automatic Identification and Data Capture Device Revenue (million) Forecast, by Application 2019 & 2032
- Table 37: Rest of Middle East & Africa Automatic Identification and Data Capture Device Revenue (million) Forecast, by Application 2019 & 2032
- Table 38: Global Automatic Identification and Data Capture Device Revenue million Forecast, by Application 2019 & 2032
- Table 39: Global Automatic Identification and Data Capture Device Revenue million Forecast, by Types 2019 & 2032
- Table 40: Global Automatic Identification and Data Capture Device Revenue million Forecast, by Country 2019 & 2032
- Table 41: China Automatic Identification and Data Capture Device Revenue (million) Forecast, by Application 2019 & 2032
- Table 42: India Automatic Identification and Data Capture Device Revenue (million) Forecast, by Application 2019 & 2032
- Table 43: Japan Automatic Identification and Data Capture Device Revenue (million) Forecast, by Application 2019 & 2032
- Table 44: South Korea Automatic Identification and Data Capture Device Revenue (million) Forecast, by Application 2019 & 2032
- Table 45: ASEAN Automatic Identification and Data Capture Device Revenue (million) Forecast, by Application 2019 & 2032
- Table 46: Oceania Automatic Identification and Data Capture Device Revenue (million) Forecast, by Application 2019 & 2032
- Table 47: Rest of Asia Pacific Automatic Identification and Data Capture Device Revenue (million) Forecast, by Application 2019 & 2032
Frequently Asked Questions
1. What is the projected Compound Annual Growth Rate (CAGR) of the Automatic Identification and Data Capture Device?
The projected CAGR is approximately XX%.
2. Which companies are prominent players in the Automatic Identification and Data Capture Device?
Key companies in the market include Zebra, Newland, Honeywell, Datalogic, Cognex, Shenzhen MinDe electronics technology Ltd., SICK, Zebex, Denso Wave, CipherLAB, NCR, Omron(Microscan), Argox(SATO), Keyence, Code.
3. What are the main segments of the Automatic Identification and Data Capture Device?
The market segments include Application, Types.
4. Can you provide details about the market size?
The market size is estimated to be USD XXX million as of 2022.
5. What are some drivers contributing to market growth?
N/A
6. What are the notable trends driving market growth?
N/A
7. Are there any restraints impacting market growth?
N/A
8. Can you provide examples of recent developments in the market?
N/A
9. What pricing options are available for accessing the report?
Pricing options include single-user, multi-user, and enterprise licenses priced at USD 4900.00, USD 7350.00, and USD 9800.00 respectively.
10. Is the market size provided in terms of value or volume?
The market size is provided in terms of value, measured in million.
11. Are there any specific market keywords associated with the report?
Yes, the market keyword associated with the report is "Automatic Identification and Data Capture Device," which aids in identifying and referencing the specific market segment covered.
12. How do I determine which pricing option suits my needs best?
The pricing options vary based on user requirements and access needs. Individual users may opt for single-user licenses, while businesses requiring broader access may choose multi-user or enterprise licenses for cost-effective access to the report.
13. Are there any additional resources or data provided in the Automatic Identification and Data Capture Device report?
While the report offers comprehensive insights, it's advisable to review the specific contents or supplementary materials provided to ascertain if additional resources or data are available.
14. How can I stay updated on further developments or reports in the Automatic Identification and Data Capture Device?
To stay informed about further developments, trends, and reports in the Automatic Identification and Data Capture Device, consider subscribing to industry newsletters, following relevant companies and organizations, or regularly checking reputable industry news sources and publications.
Methodology
Step 1 - Identification of Relevant Samples Size from Population Database


Step 2 - Approaches for Defining Global Market Size (Value, Volume* & Price*)

Note*: In applicable scenarios
Step 3 - Data Sources
Primary Research
- Web Analytics
- Survey Reports
- Research Institute
- Latest Research Reports
- Opinion Leaders
Secondary Research
- Annual Reports
- White Paper
- Latest Press Release
- Industry Association
- Paid Database
- Investor Presentations

Step 4 - Data Triangulation
Involves using different sources of information in order to increase the validity of a study
These sources are likely to be stakeholders in a program - participants, other researchers, program staff, other community members, and so on.
Then we put all data in single framework & apply various statistical tools to find out the dynamic on the market.
During the analysis stage, feedback from the stakeholder groups would be compared to determine areas of agreement as well as areas of divergence


