
Key Insights
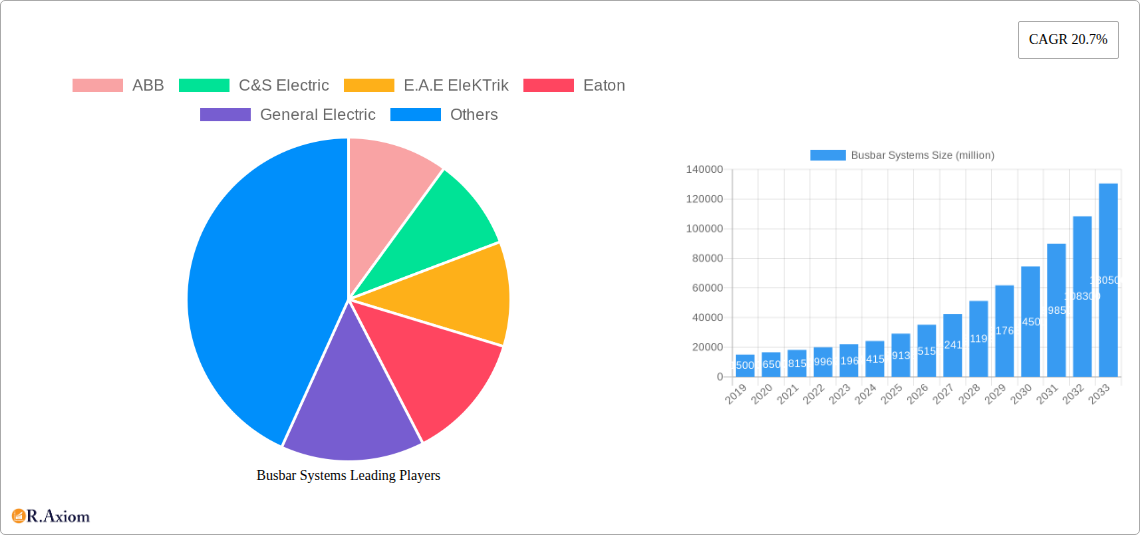
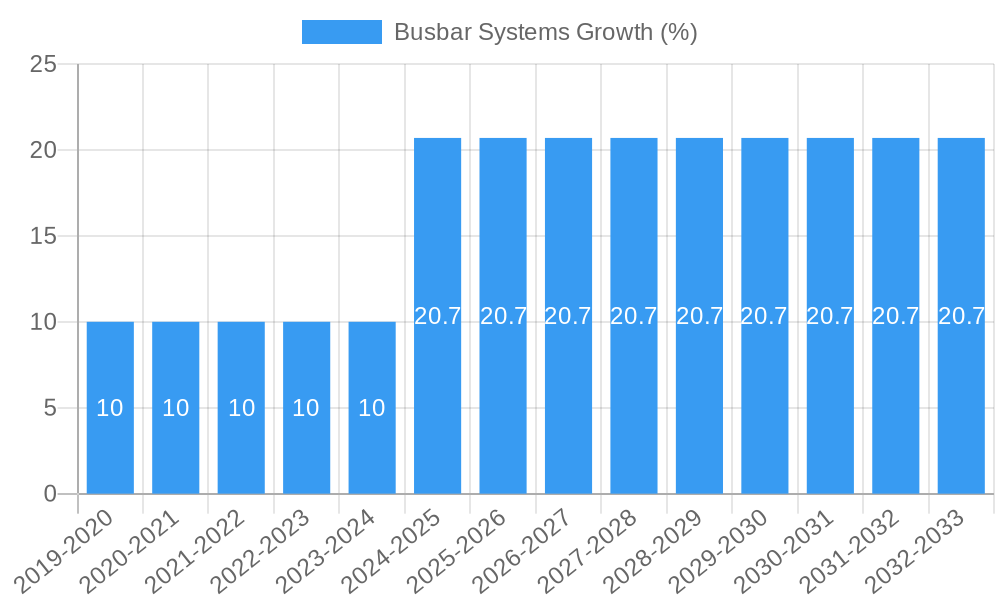
The global Busbar Systems market is poised for substantial expansion, projected to reach a significant valuation by 2033. With a robust Compound Annual Growth Rate (CAGR) of 20.7%, this market is experiencing dynamic growth fueled by several key drivers. The increasing demand for efficient and reliable power distribution solutions across industrial, commercial, and residential sectors is a primary catalyst. Modern infrastructure development, smart city initiatives, and the growing adoption of advanced electrical systems in manufacturing and data centers are all contributing to this upward trajectory. Furthermore, the need for enhanced safety, reduced energy loss, and improved operational efficiency in power transmission and distribution networks further bolsters the market's prospects. The shift towards higher power density applications and the integration of renewable energy sources also necessitate advanced busbar solutions, creating a consistent demand.
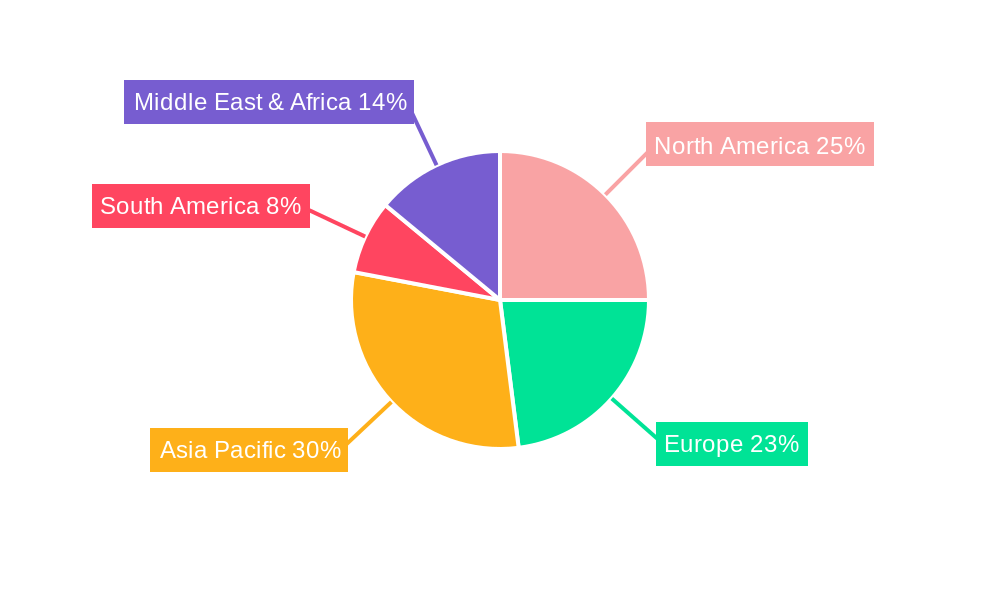
The market is characterized by a diverse range of applications and types, catering to varying power requirements. In terms of application, industrial sectors lead in demand, followed closely by commercial and residential segments, each presenting unique growth opportunities. Type-wise, the market is segmented into low, medium, and high power busbar systems. The growing complexity of electrical grids and the increasing prevalence of high-power consuming equipment are driving the demand for medium and high power solutions. Geographically, the Asia Pacific region, particularly China and India, is expected to witness the most rapid growth due to significant investments in infrastructure and industrialization. North America and Europe, with their mature economies and focus on grid modernization and energy efficiency, will continue to be substantial markets. While the market demonstrates strong growth, potential restraints such as the initial cost of advanced busbar systems and the availability of alternative distribution methods might pose challenges. However, the long-term benefits in terms of safety, efficiency, and sustainability are expected to outweigh these concerns, ensuring sustained market expansion.
Comprehensive Report: Busbar Systems Market Analysis & Future Projections (2019-2033)
This in-depth report provides a definitive analysis of the global busbar systems market, offering critical insights into market concentration, industry trends, regional dominance, product innovations, and strategic opportunities. Covering the historical period from 2019 to 2024 and projecting future growth through 2033, with a base year of 2025, this study is essential for stakeholders seeking to understand the evolving landscape of electrical power distribution. The report leverages extensive data and expert analysis to present actionable intelligence for manufacturers, suppliers, investors, and end-users across industrial, commercial, and residential applications.
Busbar Systems Market Concentration & Innovation
The global busbar systems market exhibits a moderate to high concentration, with key players like ABB, Schneider Electric, and Eaton holding significant market shares, estimated to be in the range of several hundred million to over a billion dollars each. Innovation is a critical differentiator, driven by advancements in materials, modular designs, and enhanced safety features. Regulatory frameworks, particularly those concerning electrical safety standards and energy efficiency, are instrumental in shaping product development and market entry. While product substitutes like traditional cabling systems exist, the superior efficiency, flexibility, and space-saving advantages of busbar systems are increasingly favored. End-user trends are leaning towards smart grid integration, electrification of transportation, and the demand for high-density power distribution in data centers and high-rise buildings. Mergers and acquisitions (M&A) have played a role in market consolidation, with deal values potentially reaching tens to hundreds of million dollars, as companies aim to expand their product portfolios and geographical reach.
Busbar Systems Industry Trends & Insights
The busbar systems industry is poised for robust growth, driven by increasing global demand for efficient and reliable power distribution solutions. Key growth drivers include the burgeoning construction sector, rapid urbanization, and the ongoing transition towards renewable energy sources, necessitating advanced electrical infrastructure. Technological disruptions are at the forefront, with innovations in insulated busbars, compact designs, and integrated smart functionalities enhancing performance and safety. Consumer preferences are shifting towards solutions that offer greater flexibility, ease of installation, and reduced maintenance requirements. The competitive dynamics are characterized by intense product development, strategic partnerships, and a focus on cost-effectiveness without compromising quality. The market penetration of busbar systems is expected to rise significantly, particularly in developing economies, as awareness of their benefits over traditional wiring grows. The Compound Annual Growth Rate (CAGR) is projected to be in the range of xx% to xx% over the forecast period, translating to a market size expanding from billions to tens of billions of dollars.
Dominant Markets & Segments in Busbar Systems
The Industrial segment emerges as the dominant market for busbar systems, fueled by the high power demands of manufacturing plants, data centers, and critical infrastructure projects. Within this segment, High Power busbar systems are particularly crucial for applications requiring substantial energy transfer. Regionally, Asia-Pacific is anticipated to lead market growth, driven by rapid industrialization, substantial investments in infrastructure, and favorable economic policies in countries like China and India. The Commercial segment also represents a significant contributor, with increasing adoption in commercial buildings, hospitals, and educational institutions seeking efficient power distribution. The Residential segment, while currently smaller, is expected to witness steady growth due to the rising demand for prefabricated housing and smart home solutions. Key drivers for this dominance include government initiatives promoting energy efficiency and infrastructure development, the need for reliable power supply in expanding urban centers, and the inherent cost-effectiveness and safety advantages of busbar systems for large-scale installations. For instance, industrial applications can account for over fifty percent of the total market revenue, with high power systems representing a substantial portion of that.
Busbar Systems Product Developments
Product innovations in the busbar systems market are primarily focused on enhancing safety, efficiency, and modularity. Developments include advanced fire-resistant materials, compact and lightweight designs for easier installation, and integrated sensor technologies for real-time monitoring of power flow and temperature. These innovations offer significant competitive advantages by reducing installation time and costs, improving operational safety, and enabling predictive maintenance. The market is also witnessing a rise in customized solutions tailored to specific industry needs, such as high-density power distribution for data centers and specialized systems for hazardous environments. Technological trends are pushing towards more intelligent and sustainable busbar solutions.
Report Scope & Segmentation Analysis
This report meticulously segments the busbar systems market by Application and Type. Application Segments:
- Industrial: Expected to dominate with a projected market size of over ten billion dollars by 2033, driven by continuous manufacturing, data centers, and critical infrastructure.
- Commercial: Forecasted to grow at a CAGR of xx% to xx%, reaching market values in the billions of dollars, fueled by the construction of modern office buildings, retail spaces, and healthcare facilities.
- Residential: Witnessing steady growth, with market potential in the hundreds of millions of dollars, influenced by prefabricated construction and smart home adoption. Type Segments:
- Low Power: Catering to smaller loads and specific building applications, with market sizes in the hundreds of millions of dollars.
- Medium Power: Widely adopted across various commercial and industrial applications, expected to maintain a significant market share in the billions of dollars.
- High Power: Essential for heavy industrial loads and large-scale infrastructure, projected to see robust growth and market values in the billions of dollars.
Key Drivers of Busbar Systems Growth
The growth of the busbar systems market is propelled by several key factors. Technological advancements in material science and manufacturing processes are leading to more efficient, compact, and safer busbar designs. The increasing global emphasis on energy efficiency and sustainability favors busbar systems due to their lower power loss compared to traditional cables. Rapid urbanization and infrastructure development, particularly in emerging economies, creates substantial demand for reliable and scalable power distribution solutions. Furthermore, government regulations and incentives promoting modern electrical infrastructure and renewable energy integration are significant catalysts. The growing adoption of electric vehicles and the expansion of data centers also contribute to this upward trend.
Challenges in the Busbar Systems Sector
Despite promising growth, the busbar systems sector faces certain challenges. Initial installation costs can be higher than traditional cabling in some applications, posing a barrier for cost-sensitive projects. Stringent regulatory approvals and standards can lead to longer product development cycles and market entry timelines. Supply chain disruptions, particularly for specialized components or raw materials, can impact production and lead times, with potential cost implications in the hundreds of millions of dollars. Intense competition from established players and new entrants necessitates continuous innovation and competitive pricing. Lack of skilled labor for installation and maintenance in certain regions can also present a hurdle.
Emerging Opportunities in Busbar Systems
The busbar systems market is ripe with emerging opportunities. The increasing demand for smart grid technologies presents a significant opportunity for busbar systems with integrated monitoring and control capabilities. The rapid growth of the data center industry requires high-density, flexible power distribution solutions that busbars are well-suited to provide. The ongoing electrification of transportation, including charging infrastructure for electric vehicles, also opens new avenues for busbar applications. Furthermore, the trend towards modular construction and prefabricated buildings favors the ease of installation and flexibility offered by busbar systems. Emerging economies with rapidly developing power infrastructure represent a vast untapped market potential, with projected market expansion in the billions of dollars.
Leading Players in the Busbar Systems Market
- ABB
- C&S Electric
- E.A.E EleKTrik
- Eaton
- General Electric
- Graziadio
- IBAR
- KGS Engineering
- Schneider Electric
- Larsen & Toubro
- Legrand
Key Developments in Busbar Systems Industry
- 2023: Schneider Electric launches an innovative series of prefabricated busbar systems for data centers, enhancing modularity and reducing installation time by up to 50%.
- 2022: ABB expands its product portfolio with advanced fire-rated busbar solutions, addressing increasing safety requirements in high-rise buildings.
- 2021: Eaton announces strategic partnerships to integrate smart monitoring capabilities into its busbar systems, enabling real-time performance analysis.
- 2020: C&S Electric invests in R&D for sustainable busbar materials, focusing on eco-friendly alternatives and improved energy efficiency.
- 2019: Larsen & Toubro showcases its high-power busbar solutions for critical industrial infrastructure projects, highlighting enhanced reliability.
Strategic Outlook for Busbar Systems Market
The strategic outlook for the busbar systems market is highly positive, driven by an unwavering demand for efficient, reliable, and flexible power distribution. Future growth will be fueled by continued innovation in smart functionalities, increased adoption in emerging economies, and the expanding needs of sectors like data centers and renewable energy. Companies that focus on developing sustainable, cost-effective, and highly adaptable busbar solutions will be best positioned to capitalize on market opportunities. Strategic collaborations and targeted M&A activities will likely continue to shape the competitive landscape, further consolidating the market and driving technological advancements. The potential for market expansion is substantial, with projections indicating continued growth into the tens of billions of dollars.
Busbar Systems Segmentation
-
1. Application
- 1.1. Industrial
- 1.2. Commercial
- 1.3. Residential
-
2. Type
- 2.1. Low Power
- 2.2. Medium Power
- 2.3. High Power
Busbar Systems Segmentation By Geography
-
1. North America
- 1.1. United States
- 1.2. Canada
- 1.3. Mexico
-
2. South America
- 2.1. Brazil
- 2.2. Argentina
- 2.3. Rest of South America
-
3. Europe
- 3.1. United Kingdom
- 3.2. Germany
- 3.3. France
- 3.4. Italy
- 3.5. Spain
- 3.6. Russia
- 3.7. Benelux
- 3.8. Nordics
- 3.9. Rest of Europe
-
4. Middle East & Africa
- 4.1. Turkey
- 4.2. Israel
- 4.3. GCC
- 4.4. North Africa
- 4.5. South Africa
- 4.6. Rest of Middle East & Africa
-
5. Asia Pacific
- 5.1. China
- 5.2. India
- 5.3. Japan
- 5.4. South Korea
- 5.5. ASEAN
- 5.6. Oceania
- 5.7. Rest of Asia Pacific
Busbar Systems REPORT HIGHLIGHTS
| Aspects | Details |
|---|---|
| Study Period | 2019-2033 |
| Base Year | 2024 |
| Estimated Year | 2025 |
| Forecast Period | 2025-2033 |
| Historical Period | 2019-2024 |
| Growth Rate | CAGR of 20.7% from 2019-2033 |
| Segmentation |
|
Table of Contents
- 1. Introduction
- 1.1. Research Scope
- 1.2. Market Segmentation
- 1.3. Research Methodology
- 1.4. Definitions and Assumptions
- 2. Executive Summary
- 2.1. Introduction
- 3. Market Dynamics
- 3.1. Introduction
- 3.2. Market Drivers
- 3.3. Market Restrains
- 3.4. Market Trends
- 4. Market Factor Analysis
- 4.1. Porters Five Forces
- 4.2. Supply/Value Chain
- 4.3. PESTEL analysis
- 4.4. Market Entropy
- 4.5. Patent/Trademark Analysis
- 5. Global Busbar Systems Analysis, Insights and Forecast, 2019-2031
- 5.1. Market Analysis, Insights and Forecast - by Application
- 5.1.1. Industrial
- 5.1.2. Commercial
- 5.1.3. Residential
- 5.2. Market Analysis, Insights and Forecast - by Type
- 5.2.1. Low Power
- 5.2.2. Medium Power
- 5.2.3. High Power
- 5.3. Market Analysis, Insights and Forecast - by Region
- 5.3.1. North America
- 5.3.2. South America
- 5.3.3. Europe
- 5.3.4. Middle East & Africa
- 5.3.5. Asia Pacific
- 5.1. Market Analysis, Insights and Forecast - by Application
- 6. North America Busbar Systems Analysis, Insights and Forecast, 2019-2031
- 6.1. Market Analysis, Insights and Forecast - by Application
- 6.1.1. Industrial
- 6.1.2. Commercial
- 6.1.3. Residential
- 6.2. Market Analysis, Insights and Forecast - by Type
- 6.2.1. Low Power
- 6.2.2. Medium Power
- 6.2.3. High Power
- 6.1. Market Analysis, Insights and Forecast - by Application
- 7. South America Busbar Systems Analysis, Insights and Forecast, 2019-2031
- 7.1. Market Analysis, Insights and Forecast - by Application
- 7.1.1. Industrial
- 7.1.2. Commercial
- 7.1.3. Residential
- 7.2. Market Analysis, Insights and Forecast - by Type
- 7.2.1. Low Power
- 7.2.2. Medium Power
- 7.2.3. High Power
- 7.1. Market Analysis, Insights and Forecast - by Application
- 8. Europe Busbar Systems Analysis, Insights and Forecast, 2019-2031
- 8.1. Market Analysis, Insights and Forecast - by Application
- 8.1.1. Industrial
- 8.1.2. Commercial
- 8.1.3. Residential
- 8.2. Market Analysis, Insights and Forecast - by Type
- 8.2.1. Low Power
- 8.2.2. Medium Power
- 8.2.3. High Power
- 8.1. Market Analysis, Insights and Forecast - by Application
- 9. Middle East & Africa Busbar Systems Analysis, Insights and Forecast, 2019-2031
- 9.1. Market Analysis, Insights and Forecast - by Application
- 9.1.1. Industrial
- 9.1.2. Commercial
- 9.1.3. Residential
- 9.2. Market Analysis, Insights and Forecast - by Type
- 9.2.1. Low Power
- 9.2.2. Medium Power
- 9.2.3. High Power
- 9.1. Market Analysis, Insights and Forecast - by Application
- 10. Asia Pacific Busbar Systems Analysis, Insights and Forecast, 2019-2031
- 10.1. Market Analysis, Insights and Forecast - by Application
- 10.1.1. Industrial
- 10.1.2. Commercial
- 10.1.3. Residential
- 10.2. Market Analysis, Insights and Forecast - by Type
- 10.2.1. Low Power
- 10.2.2. Medium Power
- 10.2.3. High Power
- 10.1. Market Analysis, Insights and Forecast - by Application
- 11. Competitive Analysis
- 11.1. Global Market Share Analysis 2024
- 11.2. Company Profiles
- 11.2.1 ABB
- 11.2.1.1. Overview
- 11.2.1.2. Products
- 11.2.1.3. SWOT Analysis
- 11.2.1.4. Recent Developments
- 11.2.1.5. Financials (Based on Availability)
- 11.2.2 C&S Electric
- 11.2.2.1. Overview
- 11.2.2.2. Products
- 11.2.2.3. SWOT Analysis
- 11.2.2.4. Recent Developments
- 11.2.2.5. Financials (Based on Availability)
- 11.2.3 E.A.E EleKTrik
- 11.2.3.1. Overview
- 11.2.3.2. Products
- 11.2.3.3. SWOT Analysis
- 11.2.3.4. Recent Developments
- 11.2.3.5. Financials (Based on Availability)
- 11.2.4 Eaton
- 11.2.4.1. Overview
- 11.2.4.2. Products
- 11.2.4.3. SWOT Analysis
- 11.2.4.4. Recent Developments
- 11.2.4.5. Financials (Based on Availability)
- 11.2.5 General Electric
- 11.2.5.1. Overview
- 11.2.5.2. Products
- 11.2.5.3. SWOT Analysis
- 11.2.5.4. Recent Developments
- 11.2.5.5. Financials (Based on Availability)
- 11.2.6 Graziadio
- 11.2.6.1. Overview
- 11.2.6.2. Products
- 11.2.6.3. SWOT Analysis
- 11.2.6.4. Recent Developments
- 11.2.6.5. Financials (Based on Availability)
- 11.2.7 IBAR
- 11.2.7.1. Overview
- 11.2.7.2. Products
- 11.2.7.3. SWOT Analysis
- 11.2.7.4. Recent Developments
- 11.2.7.5. Financials (Based on Availability)
- 11.2.8 KGS Engineering
- 11.2.8.1. Overview
- 11.2.8.2. Products
- 11.2.8.3. SWOT Analysis
- 11.2.8.4. Recent Developments
- 11.2.8.5. Financials (Based on Availability)
- 11.2.9 Schneider Electric
- 11.2.9.1. Overview
- 11.2.9.2. Products
- 11.2.9.3. SWOT Analysis
- 11.2.9.4. Recent Developments
- 11.2.9.5. Financials (Based on Availability)
- 11.2.10 Larsen & Toubro
- 11.2.10.1. Overview
- 11.2.10.2. Products
- 11.2.10.3. SWOT Analysis
- 11.2.10.4. Recent Developments
- 11.2.10.5. Financials (Based on Availability)
- 11.2.11 Legrand
- 11.2.11.1. Overview
- 11.2.11.2. Products
- 11.2.11.3. SWOT Analysis
- 11.2.11.4. Recent Developments
- 11.2.11.5. Financials (Based on Availability)
- 11.2.1 ABB
List of Figures
- Figure 1: Global Busbar Systems Revenue Breakdown (million, %) by Region 2024 & 2032
- Figure 2: North America Busbar Systems Revenue (million), by Application 2024 & 2032
- Figure 3: North America Busbar Systems Revenue Share (%), by Application 2024 & 2032
- Figure 4: North America Busbar Systems Revenue (million), by Type 2024 & 2032
- Figure 5: North America Busbar Systems Revenue Share (%), by Type 2024 & 2032
- Figure 6: North America Busbar Systems Revenue (million), by Country 2024 & 2032
- Figure 7: North America Busbar Systems Revenue Share (%), by Country 2024 & 2032
- Figure 8: South America Busbar Systems Revenue (million), by Application 2024 & 2032
- Figure 9: South America Busbar Systems Revenue Share (%), by Application 2024 & 2032
- Figure 10: South America Busbar Systems Revenue (million), by Type 2024 & 2032
- Figure 11: South America Busbar Systems Revenue Share (%), by Type 2024 & 2032
- Figure 12: South America Busbar Systems Revenue (million), by Country 2024 & 2032
- Figure 13: South America Busbar Systems Revenue Share (%), by Country 2024 & 2032
- Figure 14: Europe Busbar Systems Revenue (million), by Application 2024 & 2032
- Figure 15: Europe Busbar Systems Revenue Share (%), by Application 2024 & 2032
- Figure 16: Europe Busbar Systems Revenue (million), by Type 2024 & 2032
- Figure 17: Europe Busbar Systems Revenue Share (%), by Type 2024 & 2032
- Figure 18: Europe Busbar Systems Revenue (million), by Country 2024 & 2032
- Figure 19: Europe Busbar Systems Revenue Share (%), by Country 2024 & 2032
- Figure 20: Middle East & Africa Busbar Systems Revenue (million), by Application 2024 & 2032
- Figure 21: Middle East & Africa Busbar Systems Revenue Share (%), by Application 2024 & 2032
- Figure 22: Middle East & Africa Busbar Systems Revenue (million), by Type 2024 & 2032
- Figure 23: Middle East & Africa Busbar Systems Revenue Share (%), by Type 2024 & 2032
- Figure 24: Middle East & Africa Busbar Systems Revenue (million), by Country 2024 & 2032
- Figure 25: Middle East & Africa Busbar Systems Revenue Share (%), by Country 2024 & 2032
- Figure 26: Asia Pacific Busbar Systems Revenue (million), by Application 2024 & 2032
- Figure 27: Asia Pacific Busbar Systems Revenue Share (%), by Application 2024 & 2032
- Figure 28: Asia Pacific Busbar Systems Revenue (million), by Type 2024 & 2032
- Figure 29: Asia Pacific Busbar Systems Revenue Share (%), by Type 2024 & 2032
- Figure 30: Asia Pacific Busbar Systems Revenue (million), by Country 2024 & 2032
- Figure 31: Asia Pacific Busbar Systems Revenue Share (%), by Country 2024 & 2032
List of Tables
- Table 1: Global Busbar Systems Revenue million Forecast, by Region 2019 & 2032
- Table 2: Global Busbar Systems Revenue million Forecast, by Application 2019 & 2032
- Table 3: Global Busbar Systems Revenue million Forecast, by Type 2019 & 2032
- Table 4: Global Busbar Systems Revenue million Forecast, by Region 2019 & 2032
- Table 5: Global Busbar Systems Revenue million Forecast, by Application 2019 & 2032
- Table 6: Global Busbar Systems Revenue million Forecast, by Type 2019 & 2032
- Table 7: Global Busbar Systems Revenue million Forecast, by Country 2019 & 2032
- Table 8: United States Busbar Systems Revenue (million) Forecast, by Application 2019 & 2032
- Table 9: Canada Busbar Systems Revenue (million) Forecast, by Application 2019 & 2032
- Table 10: Mexico Busbar Systems Revenue (million) Forecast, by Application 2019 & 2032
- Table 11: Global Busbar Systems Revenue million Forecast, by Application 2019 & 2032
- Table 12: Global Busbar Systems Revenue million Forecast, by Type 2019 & 2032
- Table 13: Global Busbar Systems Revenue million Forecast, by Country 2019 & 2032
- Table 14: Brazil Busbar Systems Revenue (million) Forecast, by Application 2019 & 2032
- Table 15: Argentina Busbar Systems Revenue (million) Forecast, by Application 2019 & 2032
- Table 16: Rest of South America Busbar Systems Revenue (million) Forecast, by Application 2019 & 2032
- Table 17: Global Busbar Systems Revenue million Forecast, by Application 2019 & 2032
- Table 18: Global Busbar Systems Revenue million Forecast, by Type 2019 & 2032
- Table 19: Global Busbar Systems Revenue million Forecast, by Country 2019 & 2032
- Table 20: United Kingdom Busbar Systems Revenue (million) Forecast, by Application 2019 & 2032
- Table 21: Germany Busbar Systems Revenue (million) Forecast, by Application 2019 & 2032
- Table 22: France Busbar Systems Revenue (million) Forecast, by Application 2019 & 2032
- Table 23: Italy Busbar Systems Revenue (million) Forecast, by Application 2019 & 2032
- Table 24: Spain Busbar Systems Revenue (million) Forecast, by Application 2019 & 2032
- Table 25: Russia Busbar Systems Revenue (million) Forecast, by Application 2019 & 2032
- Table 26: Benelux Busbar Systems Revenue (million) Forecast, by Application 2019 & 2032
- Table 27: Nordics Busbar Systems Revenue (million) Forecast, by Application 2019 & 2032
- Table 28: Rest of Europe Busbar Systems Revenue (million) Forecast, by Application 2019 & 2032
- Table 29: Global Busbar Systems Revenue million Forecast, by Application 2019 & 2032
- Table 30: Global Busbar Systems Revenue million Forecast, by Type 2019 & 2032
- Table 31: Global Busbar Systems Revenue million Forecast, by Country 2019 & 2032
- Table 32: Turkey Busbar Systems Revenue (million) Forecast, by Application 2019 & 2032
- Table 33: Israel Busbar Systems Revenue (million) Forecast, by Application 2019 & 2032
- Table 34: GCC Busbar Systems Revenue (million) Forecast, by Application 2019 & 2032
- Table 35: North Africa Busbar Systems Revenue (million) Forecast, by Application 2019 & 2032
- Table 36: South Africa Busbar Systems Revenue (million) Forecast, by Application 2019 & 2032
- Table 37: Rest of Middle East & Africa Busbar Systems Revenue (million) Forecast, by Application 2019 & 2032
- Table 38: Global Busbar Systems Revenue million Forecast, by Application 2019 & 2032
- Table 39: Global Busbar Systems Revenue million Forecast, by Type 2019 & 2032
- Table 40: Global Busbar Systems Revenue million Forecast, by Country 2019 & 2032
- Table 41: China Busbar Systems Revenue (million) Forecast, by Application 2019 & 2032
- Table 42: India Busbar Systems Revenue (million) Forecast, by Application 2019 & 2032
- Table 43: Japan Busbar Systems Revenue (million) Forecast, by Application 2019 & 2032
- Table 44: South Korea Busbar Systems Revenue (million) Forecast, by Application 2019 & 2032
- Table 45: ASEAN Busbar Systems Revenue (million) Forecast, by Application 2019 & 2032
- Table 46: Oceania Busbar Systems Revenue (million) Forecast, by Application 2019 & 2032
- Table 47: Rest of Asia Pacific Busbar Systems Revenue (million) Forecast, by Application 2019 & 2032
Frequently Asked Questions
1. What is the projected Compound Annual Growth Rate (CAGR) of the Busbar Systems?
The projected CAGR is approximately 20.7%.
2. Which companies are prominent players in the Busbar Systems?
Key companies in the market include ABB, C&S Electric, E.A.E EleKTrik, Eaton, General Electric, Graziadio, IBAR, KGS Engineering, Schneider Electric, Larsen & Toubro, Legrand.
3. What are the main segments of the Busbar Systems?
The market segments include Application, Type.
4. Can you provide details about the market size?
The market size is estimated to be USD 29130 million as of 2022.
5. What are some drivers contributing to market growth?
N/A
6. What are the notable trends driving market growth?
N/A
7. Are there any restraints impacting market growth?
N/A
8. Can you provide examples of recent developments in the market?
N/A
9. What pricing options are available for accessing the report?
Pricing options include single-user, multi-user, and enterprise licenses priced at USD 4250.00, USD 6375.00, and USD 8500.00 respectively.
10. Is the market size provided in terms of value or volume?
The market size is provided in terms of value, measured in million.
11. Are there any specific market keywords associated with the report?
Yes, the market keyword associated with the report is "Busbar Systems," which aids in identifying and referencing the specific market segment covered.
12. How do I determine which pricing option suits my needs best?
The pricing options vary based on user requirements and access needs. Individual users may opt for single-user licenses, while businesses requiring broader access may choose multi-user or enterprise licenses for cost-effective access to the report.
13. Are there any additional resources or data provided in the Busbar Systems report?
While the report offers comprehensive insights, it's advisable to review the specific contents or supplementary materials provided to ascertain if additional resources or data are available.
14. How can I stay updated on further developments or reports in the Busbar Systems?
To stay informed about further developments, trends, and reports in the Busbar Systems, consider subscribing to industry newsletters, following relevant companies and organizations, or regularly checking reputable industry news sources and publications.
Methodology
Step 1 - Identification of Relevant Samples Size from Population Database


Step 2 - Approaches for Defining Global Market Size (Value, Volume* & Price*)

Note*: In applicable scenarios
Step 3 - Data Sources
Primary Research
- Web Analytics
- Survey Reports
- Research Institute
- Latest Research Reports
- Opinion Leaders
Secondary Research
- Annual Reports
- White Paper
- Latest Press Release
- Industry Association
- Paid Database
- Investor Presentations

Step 4 - Data Triangulation
Involves using different sources of information in order to increase the validity of a study
These sources are likely to be stakeholders in a program - participants, other researchers, program staff, other community members, and so on.
Then we put all data in single framework & apply various statistical tools to find out the dynamic on the market.
During the analysis stage, feedback from the stakeholder groups would be compared to determine areas of agreement as well as areas of divergence


