
Key Insights
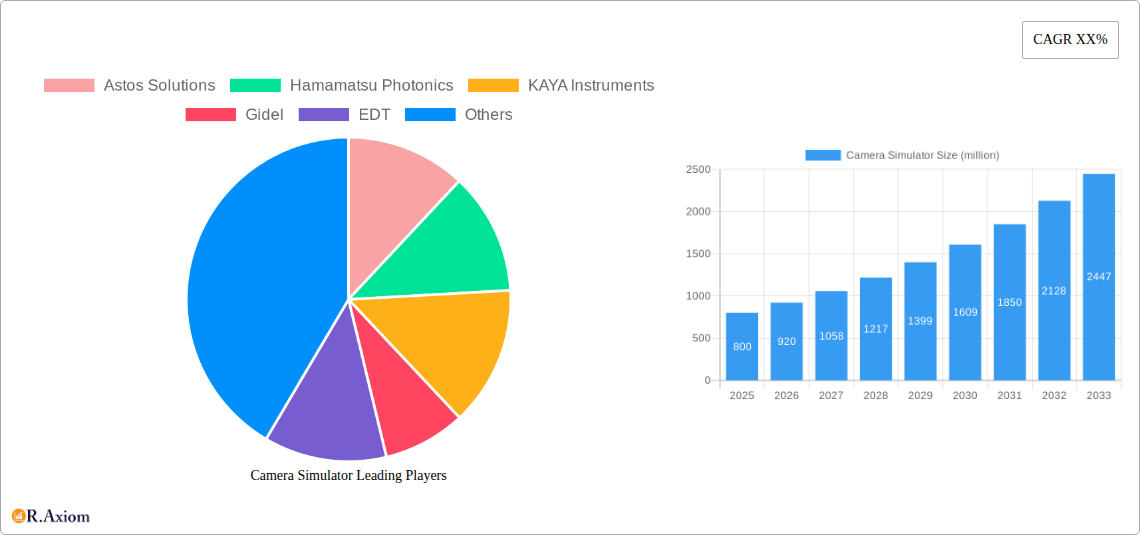
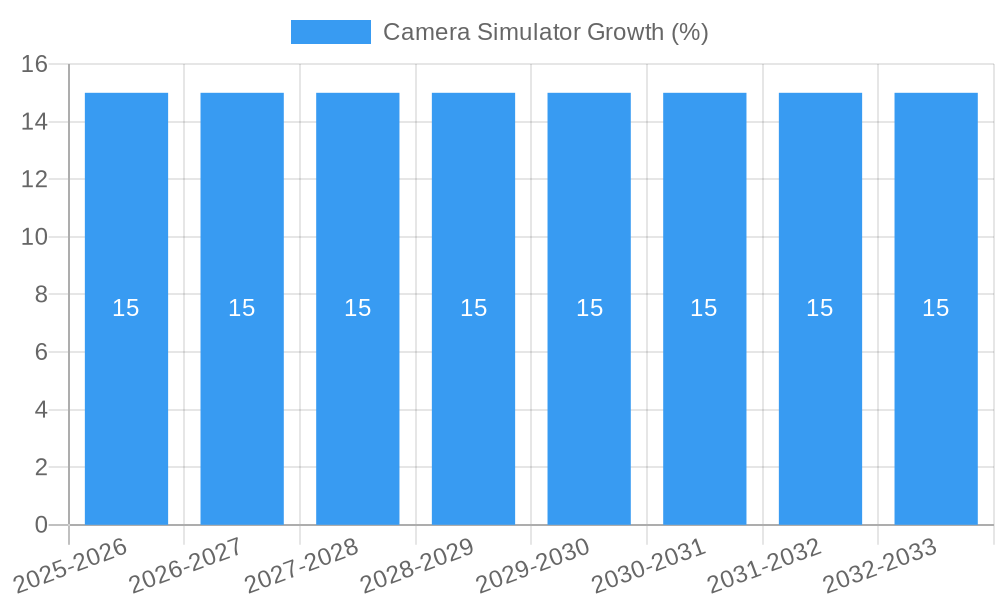
The global camera simulator market is poised for significant expansion, projected to reach an estimated value of $800 million in 2025 and exhibiting a robust Compound Annual Growth Rate (CAGR) of 15% through 2033. This impressive growth is primarily fueled by the escalating demand for sophisticated imaging solutions across diverse sectors. The burgeoning smartphone industry, with its continuous innovation in camera technology and computational photography, represents a dominant application segment. Furthermore, the increasing integration of advanced camera systems in other electronic devices, such as drones, autonomous vehicles, and advanced surveillance equipment, further propels market expansion. The inherent need for efficient and cost-effective testing and development of imaging algorithms, sensor performance, and lens characteristics in a controlled virtual environment is a core driver. This allows manufacturers and developers to accelerate product cycles, reduce physical prototyping costs, and achieve higher levels of image quality and functionality before committing to expensive hardware development.
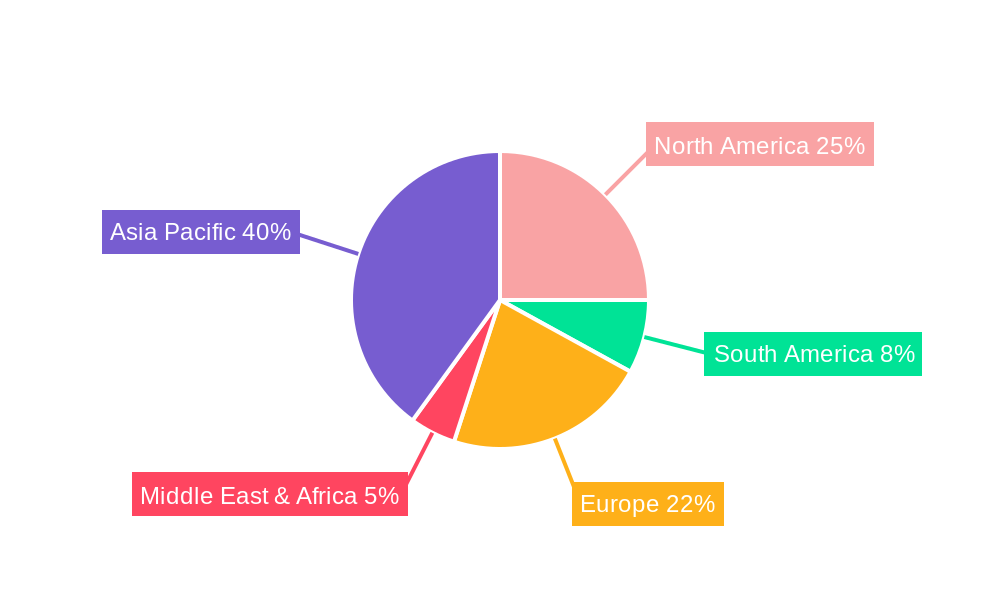
The market is characterized by a dynamic interplay of innovation and evolving consumer expectations. Key trends include the development of increasingly realistic simulation environments, the incorporation of AI and machine learning for advanced scenario generation, and the rise of cloud-based simulation platforms for enhanced accessibility and collaboration. While the market benefits from strong growth drivers, certain restraints such as the initial investment in high-fidelity simulation software and hardware, and the need for specialized expertise for effective utilization, could pose challenges. However, the increasing availability of more affordable and user-friendly solutions, coupled with the inherent advantages of virtual testing, is expected to mitigate these limitations. The market is segmented by application into Smartphones and Other Electronic Devices, with the former currently holding a larger share, and by type into Online and Offline, with online platforms gaining significant traction due to their flexibility and scalability. Geographically, Asia Pacific is emerging as a powerhouse, driven by its massive electronics manufacturing base and rapid technological adoption, while North America and Europe remain strongholds for advanced research and development.
Camera Simulator Market Concentration & Innovation
The global camera simulator market exhibits moderate to high concentration, with a few key players like Astos Solutions, Hamamatsu Photonics, KAYA Instruments, Gidel, and EDT driving innovation and capturing significant market share. These companies are at the forefront of developing advanced simulation technologies that cater to the increasingly complex needs of various industries, including automotive, aerospace, and consumer electronics. Innovation is primarily fueled by the demand for realistic virtual testing environments, reduced development costs, and accelerated product cycles. Regulatory frameworks, particularly in sectors like automotive safety (e.g., ADAS testing) and aerospace, are also indirectly pushing the adoption of sophisticated camera simulators. Product substitutes, such as physical prototyping and manual testing, are gradually being supplanted by the efficiency and cost-effectiveness of simulation. End-user trends point towards a strong preference for cloud-based and highly customizable simulation solutions. Mergers and acquisitions (M&A) activity remains a key strategy for consolidation and market expansion, with an estimated xx million in deal values observed historically, indicating strategic investments in technology and market access.
- Market Share: Key players hold an estimated combined market share of over 70%.
- M&A Deal Values: Historical M&A deals are estimated to be in the range of xx million.
- Innovation Drivers: Realistic rendering, AI integration for sensor emulation, real-time feedback loops.
- Regulatory Impact: Enhanced safety standards driving demand for accurate simulation of diverse scenarios.
- End-User Trends: Shift towards SaaS models and integrated simulation platforms.
Camera Simulator Industry Trends & Insights
The camera simulator market is experiencing robust growth, propelled by an increasing demand for virtual prototyping and testing across diverse industries. The Compound Annual Growth Rate (CAGR) for the camera simulator market is projected to be a strong xx% from 2025 to 2033, indicating a sustained upward trajectory. This expansion is primarily driven by the inherent need for cost-effectiveness and efficiency in product development cycles. Traditional physical testing methods, while essential, are time-consuming and expensive, making camera simulators an indispensable tool for accelerating R&D. The escalating complexity of camera systems and the proliferation of machine vision applications in sectors like autonomous driving, robotics, and advanced surveillance further bolster market demand. Technological disruptions, including advancements in computer graphics, machine learning for realistic scene generation, and the development of more powerful simulation software, are continuously enhancing the capabilities and realism of camera simulators. Consumer preferences are evolving towards solutions that offer greater flexibility, scalability, and integration with existing development workflows. Online simulation platforms are gaining traction due to their accessibility and reduced infrastructure requirements, while offline solutions continue to serve specialized needs requiring high levels of customization and data security. The competitive landscape is characterized by both established players and emerging startups, all vying to offer innovative solutions that address the evolving needs of the market. Market penetration is steadily increasing as more companies recognize the strategic advantages of virtual testing. The estimated market size for camera simulators is expected to reach xx million by 2033, a significant leap from its current valuation.
Dominant Markets & Segments in Camera Simulator
The Application segment of Smartphones is a significant growth driver for the camera simulator market. The relentless pursuit of enhanced mobile photography and videography capabilities, coupled with the integration of advanced computational photography features, necessitates rigorous virtual testing. Companies like Panasonic Connect and Sony, major players in the smartphone camera sensor and component market, heavily rely on accurate camera simulations to refine image processing algorithms, test new lens designs, and optimize sensor performance under various lighting conditions and environmental factors. The economic policies supporting the growth of the consumer electronics sector, coupled with the sheer volume of smartphone production globally, create a perpetual demand for sophisticated simulation tools. This dominance is further amplified by the rapid pace of innovation in the smartphone industry, where new models with cutting-edge camera technologies are launched frequently, requiring continuous validation.
The Other Electronic Devices segment, encompassing a broad spectrum of products such as automotive cameras, industrial inspection systems, drones, and virtual reality (VR)/augmented reality (AR) devices, also represents a substantial market for camera simulators. The burgeoning autonomous vehicle sector, in particular, is a major consumer of these simulators. Companies like ARRI, which have a strong presence in high-end imaging, are increasingly investing in simulation technologies to develop and test advanced driver-assistance systems (ADAS) and fully autonomous driving systems. The need to simulate a vast array of driving scenarios, including adverse weather conditions, complex urban environments, and unpredictable pedestrian behavior, makes camera simulation a critical component of automotive safety and development. The increasing adoption of machine vision in industrial automation, medical imaging, and security applications further fuels this segment's growth.
The Online type of camera simulator is rapidly gaining prominence. This trend is driven by the accessibility and cost-effectiveness it offers. Cloud-based platforms allow users to access powerful simulation tools without the need for significant upfront investment in hardware or infrastructure. This democratizes advanced simulation capabilities, making them accessible to smaller companies and research institutions. The ability to scale resources on demand and collaborate remotely further enhances the appeal of online camera simulators. This shift is supported by the widespread availability of high-speed internet and the growing adoption of cloud computing across industries.
Conversely, the Offline type of camera simulator continues to hold its ground, particularly in industries with stringent data security requirements and for highly specialized or proprietary simulation needs. Aerospace and defense sectors, for instance, often prefer offline solutions to maintain complete control over their sensitive simulation data and intellectual property. Additionally, certain advanced simulation workflows that require immense computational power and customization may necessitate dedicated offline environments.
Camera Simulator Product Developments
Product developments in the camera simulator market are focused on enhancing realism, expanding application breadth, and improving user experience. Innovations are driven by the need for more accurate emulation of diverse camera sensors, lenses, and environmental conditions, including advanced lighting effects and atmospheric conditions. The integration of AI and machine learning algorithms for generating more realistic synthetic data and for adaptive scene creation is a key trend. Furthermore, the development of more intuitive user interfaces and seamless integration with other development tools, such as CAD software and virtual environment creation platforms, are enhancing the market fit for these simulators, providing competitive advantages through faster iteration cycles and more reliable testing outcomes.
Report Scope & Segmentation Analysis
This report delves into the global camera simulator market, offering a comprehensive analysis across key segmentation criteria.
Application: The Smartphones segment is projected to witness a market size of xx million by 2033, driven by the constant demand for enhanced mobile imaging. Other Electronic Devices, encompassing automotive, industrial, and consumer electronics, is estimated to reach xx million by 2033, fueled by the rapid growth of AI-driven applications.
Types: The Online camera simulator segment is expected to grow substantially, reaching xx million by 2033, due to its scalability and accessibility. The Offline segment will continue to serve niche markets, with a projected market size of xx million by 2033, catering to specific security and customization needs.
Key Drivers of Camera Simulator Growth
The growth of the camera simulator market is propelled by several key factors. The escalating complexity of imaging systems in sectors like autonomous vehicles and advanced robotics necessitates sophisticated virtual testing environments to reduce development costs and time-to-market. Technological advancements in computer vision, AI, and cloud computing are enabling more realistic and efficient simulations. Increasing regulatory emphasis on safety and performance standards, particularly in the automotive industry, further drives the adoption of camera simulators for validation. Economic factors, such as the global demand for advanced electronic devices and the pursuit of R&D efficiency, also play a crucial role.
- Technological Advancements: AI-powered scene generation, improved rendering engines, cloud scalability.
- Economic Imperatives: Cost reduction in physical prototyping, accelerated product development cycles.
- Regulatory Mandates: Stringent safety standards in automotive and aerospace sectors.
- Industry Demand: Proliferation of machine vision and AI in diverse applications.
Challenges in the Camera Simulator Sector
Despite its promising growth, the camera simulator sector faces several challenges. The high initial investment in advanced simulation software and the need for skilled personnel to operate and maintain these systems can be a barrier for smaller enterprises. Ensuring the absolute fidelity of simulated environments to real-world conditions remains a technical hurdle, especially when dealing with highly nuanced lighting or extreme weather scenarios. Regulatory complexities in different regions can also create fragmented market access. Furthermore, the rapid pace of technological evolution requires continuous updates and adaptations, posing an ongoing challenge for both developers and users.
- High Initial Investment: Cost of software licenses and specialized hardware.
- Realism Fidelity: Achieving perfect emulation of complex real-world scenarios.
- Talent Gap: Shortage of skilled simulation engineers.
- Rapid Technological Evolution: Need for continuous software updates and adaptation.
Emerging Opportunities in Camera Simulator
Emerging opportunities in the camera simulator market lie in the continuous expansion of AI integration, the development of more specialized simulators for niche applications, and the growing demand for edge computing-compatible simulation solutions. The burgeoning metaverse and extended reality (XR) industries present new avenues for realistic virtual camera simulation. Furthermore, the increasing adoption of synthetic data generation for training AI models in computer vision opens up significant potential. The development of open-source simulation platforms and collaborative environments could also foster wider adoption and innovation.
- AI and Synthetic Data: Enhanced realism and efficiency in training AI models.
- Metaverse and XR: Demand for photorealistic virtual camera experiences.
- Niche Application Development: Tailored simulators for specific industries like medical imaging or agriculture.
- Edge Computing: Development of efficient simulators for on-device processing.
Leading Players in the Camera Simulator Market
- Astos Solutions
- Hamamatsu Photonics
- KAYA Instruments
- Gidel
- EDT
- CameraSim
- Panasonic Connect
- Sony
- ARRI
Key Developments in Camera Simulator Industry
- 2023: Launch of advanced AI-driven synthetic data generation tools by leading simulation software providers, significantly improving training data quality for machine vision algorithms.
- 2023: Increased M&A activity with a focus on acquiring companies with specialized expertise in real-time rendering and sensor fusion simulation.
- 2024: Release of cloud-based camera simulation platforms offering enhanced scalability and accessibility for smaller businesses and research institutions.
- 2024: Introduction of enhanced physics-based rendering engines for more accurate emulation of complex lighting and environmental conditions.
- 2025: Growing integration of camera simulators with digital twin technologies for comprehensive product lifecycle management.
Strategic Outlook for Camera Simulator Market
The strategic outlook for the camera simulator market is overwhelmingly positive, driven by an insatiable demand for efficiency, cost reduction, and accelerated innovation across a multitude of high-growth industries. The increasing sophistication of AI and machine learning algorithms, coupled with advancements in computing power and cloud infrastructure, will continue to push the boundaries of simulation realism and capability. Companies that can offer integrated, end-to-end simulation solutions, encompassing everything from sensor emulation to full scene generation and data analysis, will be well-positioned for success. Strategic partnerships and collaborations will be crucial for leveraging complementary technologies and expanding market reach, particularly in emerging applications and geographical regions. The continuous evolution of regulatory landscapes, especially concerning autonomous systems, will also serve as a significant catalyst for sustained market expansion.
Camera Simulator Segmentation
-
1. Application
- 1.1. Smartphones
- 1.2. Other Electronic Devices
-
2. Types
- 2.1. Online
- 2.2. Offline
Camera Simulator Segmentation By Geography
-
1. North America
- 1.1. United States
- 1.2. Canada
- 1.3. Mexico
-
2. South America
- 2.1. Brazil
- 2.2. Argentina
- 2.3. Rest of South America
-
3. Europe
- 3.1. United Kingdom
- 3.2. Germany
- 3.3. France
- 3.4. Italy
- 3.5. Spain
- 3.6. Russia
- 3.7. Benelux
- 3.8. Nordics
- 3.9. Rest of Europe
-
4. Middle East & Africa
- 4.1. Turkey
- 4.2. Israel
- 4.3. GCC
- 4.4. North Africa
- 4.5. South Africa
- 4.6. Rest of Middle East & Africa
-
5. Asia Pacific
- 5.1. China
- 5.2. India
- 5.3. Japan
- 5.4. South Korea
- 5.5. ASEAN
- 5.6. Oceania
- 5.7. Rest of Asia Pacific
Camera Simulator REPORT HIGHLIGHTS
| Aspects | Details |
|---|---|
| Study Period | 2019-2033 |
| Base Year | 2024 |
| Estimated Year | 2025 |
| Forecast Period | 2025-2033 |
| Historical Period | 2019-2024 |
| Growth Rate | CAGR of XX% from 2019-2033 |
| Segmentation |
|
Table of Contents
- 1. Introduction
- 1.1. Research Scope
- 1.2. Market Segmentation
- 1.3. Research Methodology
- 1.4. Definitions and Assumptions
- 2. Executive Summary
- 2.1. Introduction
- 3. Market Dynamics
- 3.1. Introduction
- 3.2. Market Drivers
- 3.3. Market Restrains
- 3.4. Market Trends
- 4. Market Factor Analysis
- 4.1. Porters Five Forces
- 4.2. Supply/Value Chain
- 4.3. PESTEL analysis
- 4.4. Market Entropy
- 4.5. Patent/Trademark Analysis
- 5. Global Camera Simulator Analysis, Insights and Forecast, 2019-2031
- 5.1. Market Analysis, Insights and Forecast - by Application
- 5.1.1. Smartphones
- 5.1.2. Other Electronic Devices
- 5.2. Market Analysis, Insights and Forecast - by Types
- 5.2.1. Online
- 5.2.2. Offline
- 5.3. Market Analysis, Insights and Forecast - by Region
- 5.3.1. North America
- 5.3.2. South America
- 5.3.3. Europe
- 5.3.4. Middle East & Africa
- 5.3.5. Asia Pacific
- 5.1. Market Analysis, Insights and Forecast - by Application
- 6. North America Camera Simulator Analysis, Insights and Forecast, 2019-2031
- 6.1. Market Analysis, Insights and Forecast - by Application
- 6.1.1. Smartphones
- 6.1.2. Other Electronic Devices
- 6.2. Market Analysis, Insights and Forecast - by Types
- 6.2.1. Online
- 6.2.2. Offline
- 6.1. Market Analysis, Insights and Forecast - by Application
- 7. South America Camera Simulator Analysis, Insights and Forecast, 2019-2031
- 7.1. Market Analysis, Insights and Forecast - by Application
- 7.1.1. Smartphones
- 7.1.2. Other Electronic Devices
- 7.2. Market Analysis, Insights and Forecast - by Types
- 7.2.1. Online
- 7.2.2. Offline
- 7.1. Market Analysis, Insights and Forecast - by Application
- 8. Europe Camera Simulator Analysis, Insights and Forecast, 2019-2031
- 8.1. Market Analysis, Insights and Forecast - by Application
- 8.1.1. Smartphones
- 8.1.2. Other Electronic Devices
- 8.2. Market Analysis, Insights and Forecast - by Types
- 8.2.1. Online
- 8.2.2. Offline
- 8.1. Market Analysis, Insights and Forecast - by Application
- 9. Middle East & Africa Camera Simulator Analysis, Insights and Forecast, 2019-2031
- 9.1. Market Analysis, Insights and Forecast - by Application
- 9.1.1. Smartphones
- 9.1.2. Other Electronic Devices
- 9.2. Market Analysis, Insights and Forecast - by Types
- 9.2.1. Online
- 9.2.2. Offline
- 9.1. Market Analysis, Insights and Forecast - by Application
- 10. Asia Pacific Camera Simulator Analysis, Insights and Forecast, 2019-2031
- 10.1. Market Analysis, Insights and Forecast - by Application
- 10.1.1. Smartphones
- 10.1.2. Other Electronic Devices
- 10.2. Market Analysis, Insights and Forecast - by Types
- 10.2.1. Online
- 10.2.2. Offline
- 10.1. Market Analysis, Insights and Forecast - by Application
- 11. Competitive Analysis
- 11.1. Global Market Share Analysis 2024
- 11.2. Company Profiles
- 11.2.1 Astos Solutions
- 11.2.1.1. Overview
- 11.2.1.2. Products
- 11.2.1.3. SWOT Analysis
- 11.2.1.4. Recent Developments
- 11.2.1.5. Financials (Based on Availability)
- 11.2.2 Hamamatsu Photonics
- 11.2.2.1. Overview
- 11.2.2.2. Products
- 11.2.2.3. SWOT Analysis
- 11.2.2.4. Recent Developments
- 11.2.2.5. Financials (Based on Availability)
- 11.2.3 KAYA Instruments
- 11.2.3.1. Overview
- 11.2.3.2. Products
- 11.2.3.3. SWOT Analysis
- 11.2.3.4. Recent Developments
- 11.2.3.5. Financials (Based on Availability)
- 11.2.4 Gidel
- 11.2.4.1. Overview
- 11.2.4.2. Products
- 11.2.4.3. SWOT Analysis
- 11.2.4.4. Recent Developments
- 11.2.4.5. Financials (Based on Availability)
- 11.2.5 EDT
- 11.2.5.1. Overview
- 11.2.5.2. Products
- 11.2.5.3. SWOT Analysis
- 11.2.5.4. Recent Developments
- 11.2.5.5. Financials (Based on Availability)
- 11.2.6 CameraSim
- 11.2.6.1. Overview
- 11.2.6.2. Products
- 11.2.6.3. SWOT Analysis
- 11.2.6.4. Recent Developments
- 11.2.6.5. Financials (Based on Availability)
- 11.2.7 Panasonic Connect
- 11.2.7.1. Overview
- 11.2.7.2. Products
- 11.2.7.3. SWOT Analysis
- 11.2.7.4. Recent Developments
- 11.2.7.5. Financials (Based on Availability)
- 11.2.8 Sony
- 11.2.8.1. Overview
- 11.2.8.2. Products
- 11.2.8.3. SWOT Analysis
- 11.2.8.4. Recent Developments
- 11.2.8.5. Financials (Based on Availability)
- 11.2.9 ARRI
- 11.2.9.1. Overview
- 11.2.9.2. Products
- 11.2.9.3. SWOT Analysis
- 11.2.9.4. Recent Developments
- 11.2.9.5. Financials (Based on Availability)
- 11.2.1 Astos Solutions
List of Figures
- Figure 1: Global Camera Simulator Revenue Breakdown (million, %) by Region 2024 & 2032
- Figure 2: North America Camera Simulator Revenue (million), by Application 2024 & 2032
- Figure 3: North America Camera Simulator Revenue Share (%), by Application 2024 & 2032
- Figure 4: North America Camera Simulator Revenue (million), by Types 2024 & 2032
- Figure 5: North America Camera Simulator Revenue Share (%), by Types 2024 & 2032
- Figure 6: North America Camera Simulator Revenue (million), by Country 2024 & 2032
- Figure 7: North America Camera Simulator Revenue Share (%), by Country 2024 & 2032
- Figure 8: South America Camera Simulator Revenue (million), by Application 2024 & 2032
- Figure 9: South America Camera Simulator Revenue Share (%), by Application 2024 & 2032
- Figure 10: South America Camera Simulator Revenue (million), by Types 2024 & 2032
- Figure 11: South America Camera Simulator Revenue Share (%), by Types 2024 & 2032
- Figure 12: South America Camera Simulator Revenue (million), by Country 2024 & 2032
- Figure 13: South America Camera Simulator Revenue Share (%), by Country 2024 & 2032
- Figure 14: Europe Camera Simulator Revenue (million), by Application 2024 & 2032
- Figure 15: Europe Camera Simulator Revenue Share (%), by Application 2024 & 2032
- Figure 16: Europe Camera Simulator Revenue (million), by Types 2024 & 2032
- Figure 17: Europe Camera Simulator Revenue Share (%), by Types 2024 & 2032
- Figure 18: Europe Camera Simulator Revenue (million), by Country 2024 & 2032
- Figure 19: Europe Camera Simulator Revenue Share (%), by Country 2024 & 2032
- Figure 20: Middle East & Africa Camera Simulator Revenue (million), by Application 2024 & 2032
- Figure 21: Middle East & Africa Camera Simulator Revenue Share (%), by Application 2024 & 2032
- Figure 22: Middle East & Africa Camera Simulator Revenue (million), by Types 2024 & 2032
- Figure 23: Middle East & Africa Camera Simulator Revenue Share (%), by Types 2024 & 2032
- Figure 24: Middle East & Africa Camera Simulator Revenue (million), by Country 2024 & 2032
- Figure 25: Middle East & Africa Camera Simulator Revenue Share (%), by Country 2024 & 2032
- Figure 26: Asia Pacific Camera Simulator Revenue (million), by Application 2024 & 2032
- Figure 27: Asia Pacific Camera Simulator Revenue Share (%), by Application 2024 & 2032
- Figure 28: Asia Pacific Camera Simulator Revenue (million), by Types 2024 & 2032
- Figure 29: Asia Pacific Camera Simulator Revenue Share (%), by Types 2024 & 2032
- Figure 30: Asia Pacific Camera Simulator Revenue (million), by Country 2024 & 2032
- Figure 31: Asia Pacific Camera Simulator Revenue Share (%), by Country 2024 & 2032
List of Tables
- Table 1: Global Camera Simulator Revenue million Forecast, by Region 2019 & 2032
- Table 2: Global Camera Simulator Revenue million Forecast, by Application 2019 & 2032
- Table 3: Global Camera Simulator Revenue million Forecast, by Types 2019 & 2032
- Table 4: Global Camera Simulator Revenue million Forecast, by Region 2019 & 2032
- Table 5: Global Camera Simulator Revenue million Forecast, by Application 2019 & 2032
- Table 6: Global Camera Simulator Revenue million Forecast, by Types 2019 & 2032
- Table 7: Global Camera Simulator Revenue million Forecast, by Country 2019 & 2032
- Table 8: United States Camera Simulator Revenue (million) Forecast, by Application 2019 & 2032
- Table 9: Canada Camera Simulator Revenue (million) Forecast, by Application 2019 & 2032
- Table 10: Mexico Camera Simulator Revenue (million) Forecast, by Application 2019 & 2032
- Table 11: Global Camera Simulator Revenue million Forecast, by Application 2019 & 2032
- Table 12: Global Camera Simulator Revenue million Forecast, by Types 2019 & 2032
- Table 13: Global Camera Simulator Revenue million Forecast, by Country 2019 & 2032
- Table 14: Brazil Camera Simulator Revenue (million) Forecast, by Application 2019 & 2032
- Table 15: Argentina Camera Simulator Revenue (million) Forecast, by Application 2019 & 2032
- Table 16: Rest of South America Camera Simulator Revenue (million) Forecast, by Application 2019 & 2032
- Table 17: Global Camera Simulator Revenue million Forecast, by Application 2019 & 2032
- Table 18: Global Camera Simulator Revenue million Forecast, by Types 2019 & 2032
- Table 19: Global Camera Simulator Revenue million Forecast, by Country 2019 & 2032
- Table 20: United Kingdom Camera Simulator Revenue (million) Forecast, by Application 2019 & 2032
- Table 21: Germany Camera Simulator Revenue (million) Forecast, by Application 2019 & 2032
- Table 22: France Camera Simulator Revenue (million) Forecast, by Application 2019 & 2032
- Table 23: Italy Camera Simulator Revenue (million) Forecast, by Application 2019 & 2032
- Table 24: Spain Camera Simulator Revenue (million) Forecast, by Application 2019 & 2032
- Table 25: Russia Camera Simulator Revenue (million) Forecast, by Application 2019 & 2032
- Table 26: Benelux Camera Simulator Revenue (million) Forecast, by Application 2019 & 2032
- Table 27: Nordics Camera Simulator Revenue (million) Forecast, by Application 2019 & 2032
- Table 28: Rest of Europe Camera Simulator Revenue (million) Forecast, by Application 2019 & 2032
- Table 29: Global Camera Simulator Revenue million Forecast, by Application 2019 & 2032
- Table 30: Global Camera Simulator Revenue million Forecast, by Types 2019 & 2032
- Table 31: Global Camera Simulator Revenue million Forecast, by Country 2019 & 2032
- Table 32: Turkey Camera Simulator Revenue (million) Forecast, by Application 2019 & 2032
- Table 33: Israel Camera Simulator Revenue (million) Forecast, by Application 2019 & 2032
- Table 34: GCC Camera Simulator Revenue (million) Forecast, by Application 2019 & 2032
- Table 35: North Africa Camera Simulator Revenue (million) Forecast, by Application 2019 & 2032
- Table 36: South Africa Camera Simulator Revenue (million) Forecast, by Application 2019 & 2032
- Table 37: Rest of Middle East & Africa Camera Simulator Revenue (million) Forecast, by Application 2019 & 2032
- Table 38: Global Camera Simulator Revenue million Forecast, by Application 2019 & 2032
- Table 39: Global Camera Simulator Revenue million Forecast, by Types 2019 & 2032
- Table 40: Global Camera Simulator Revenue million Forecast, by Country 2019 & 2032
- Table 41: China Camera Simulator Revenue (million) Forecast, by Application 2019 & 2032
- Table 42: India Camera Simulator Revenue (million) Forecast, by Application 2019 & 2032
- Table 43: Japan Camera Simulator Revenue (million) Forecast, by Application 2019 & 2032
- Table 44: South Korea Camera Simulator Revenue (million) Forecast, by Application 2019 & 2032
- Table 45: ASEAN Camera Simulator Revenue (million) Forecast, by Application 2019 & 2032
- Table 46: Oceania Camera Simulator Revenue (million) Forecast, by Application 2019 & 2032
- Table 47: Rest of Asia Pacific Camera Simulator Revenue (million) Forecast, by Application 2019 & 2032
Frequently Asked Questions
1. What is the projected Compound Annual Growth Rate (CAGR) of the Camera Simulator?
The projected CAGR is approximately XX%.
2. Which companies are prominent players in the Camera Simulator?
Key companies in the market include Astos Solutions, Hamamatsu Photonics, KAYA Instruments, Gidel, EDT, CameraSim, Panasonic Connect, Sony, ARRI.
3. What are the main segments of the Camera Simulator?
The market segments include Application, Types.
4. Can you provide details about the market size?
The market size is estimated to be USD XXX million as of 2022.
5. What are some drivers contributing to market growth?
N/A
6. What are the notable trends driving market growth?
N/A
7. Are there any restraints impacting market growth?
N/A
8. Can you provide examples of recent developments in the market?
N/A
9. What pricing options are available for accessing the report?
Pricing options include single-user, multi-user, and enterprise licenses priced at USD 4900.00, USD 7350.00, and USD 9800.00 respectively.
10. Is the market size provided in terms of value or volume?
The market size is provided in terms of value, measured in million.
11. Are there any specific market keywords associated with the report?
Yes, the market keyword associated with the report is "Camera Simulator," which aids in identifying and referencing the specific market segment covered.
12. How do I determine which pricing option suits my needs best?
The pricing options vary based on user requirements and access needs. Individual users may opt for single-user licenses, while businesses requiring broader access may choose multi-user or enterprise licenses for cost-effective access to the report.
13. Are there any additional resources or data provided in the Camera Simulator report?
While the report offers comprehensive insights, it's advisable to review the specific contents or supplementary materials provided to ascertain if additional resources or data are available.
14. How can I stay updated on further developments or reports in the Camera Simulator?
To stay informed about further developments, trends, and reports in the Camera Simulator, consider subscribing to industry newsletters, following relevant companies and organizations, or regularly checking reputable industry news sources and publications.
Methodology
Step 1 - Identification of Relevant Samples Size from Population Database


Step 2 - Approaches for Defining Global Market Size (Value, Volume* & Price*)

Note*: In applicable scenarios
Step 3 - Data Sources
Primary Research
- Web Analytics
- Survey Reports
- Research Institute
- Latest Research Reports
- Opinion Leaders
Secondary Research
- Annual Reports
- White Paper
- Latest Press Release
- Industry Association
- Paid Database
- Investor Presentations

Step 4 - Data Triangulation
Involves using different sources of information in order to increase the validity of a study
These sources are likely to be stakeholders in a program - participants, other researchers, program staff, other community members, and so on.
Then we put all data in single framework & apply various statistical tools to find out the dynamic on the market.
During the analysis stage, feedback from the stakeholder groups would be compared to determine areas of agreement as well as areas of divergence


