
Key Insights
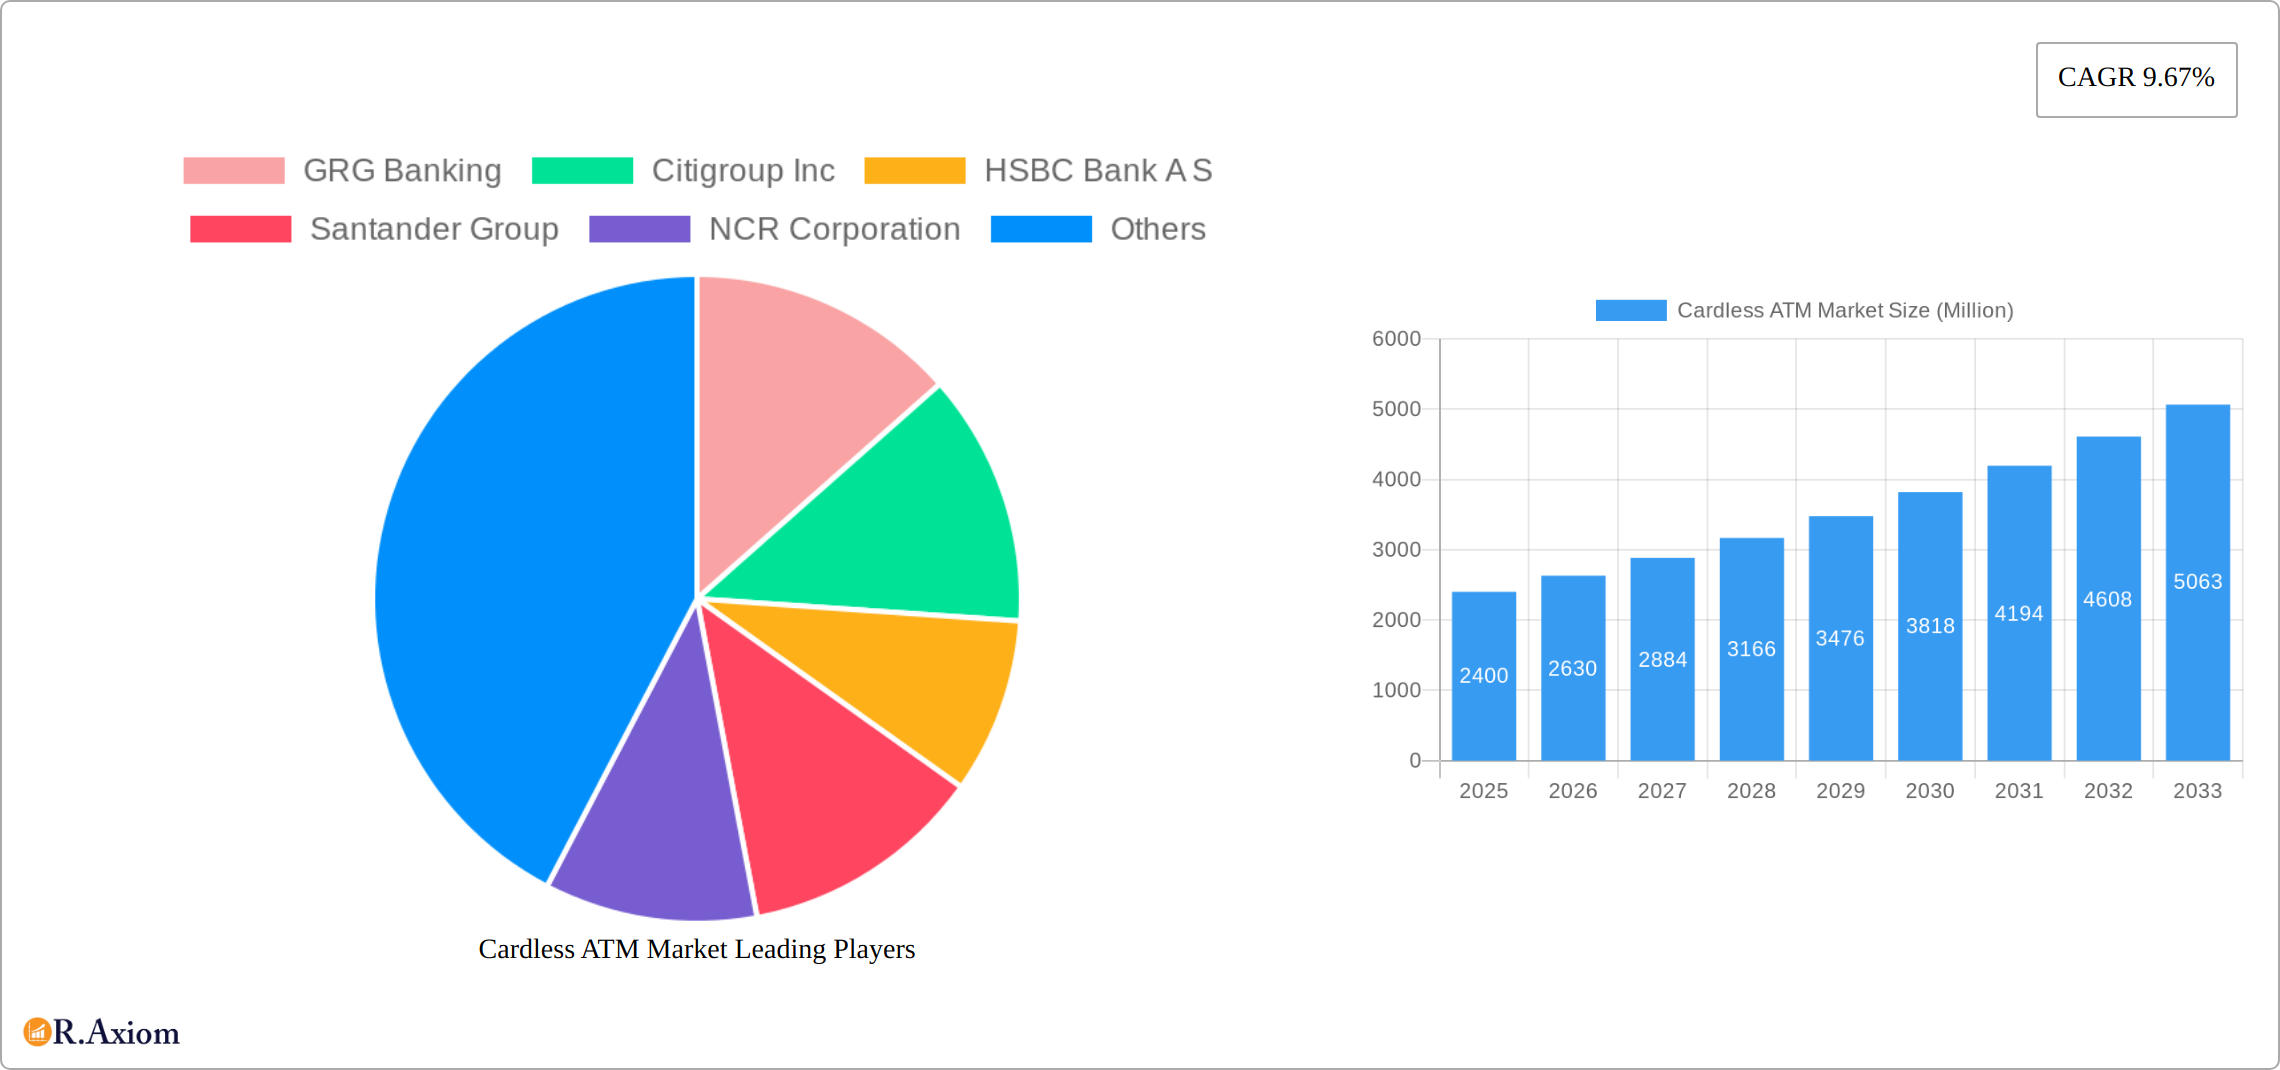
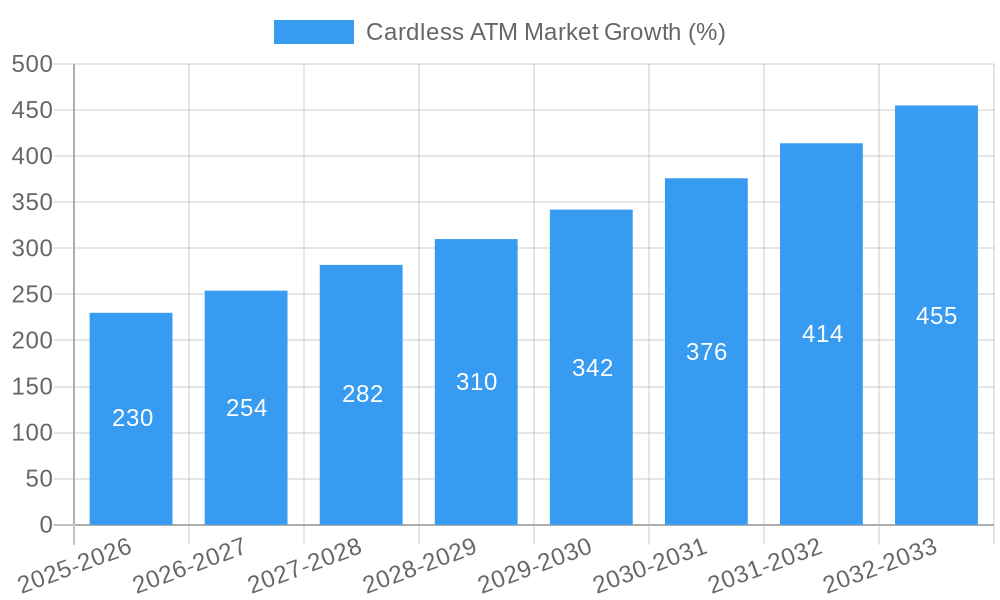
The cardless ATM market, valued at $2.40 billion in 2025, is poised for significant growth, exhibiting a Compound Annual Growth Rate (CAGR) of 9.67% from 2025 to 2033. This expansion is driven by the increasing adoption of digital banking solutions, the rising demand for contactless transactions, and the growing need for enhanced security features. Consumers are increasingly seeking convenient and secure alternatives to traditional ATM cards, leading to the widespread adoption of technologies like Near-Field Communication (NFC), Quick Response (QR) codes, and biometric verification for ATM access. The banking sector is at the forefront of this transition, actively implementing cardless ATM solutions to improve customer experience and reduce fraud risks. Retail applications are also experiencing growth, offering consumers seamless payment options within stores. The market is segmented by technology (NFC, QR codes, biometrics), application (banking, retail), and ATM type (on-site, off-site). Geographic growth is expected across all regions, with North America and Europe leading initially due to higher technological adoption, followed by rapid expansion in Asia-Pacific driven by increasing smartphone penetration and digital financial inclusion.
The competitive landscape is characterized by a mix of major technology providers like NCR Corporation and Fujitsu, and prominent financial institutions such as Citigroup, HSBC, and Wells Fargo, all actively investing in and deploying cardless ATM infrastructure. The market's future growth trajectory will depend on factors such as the continued advancement of biometric technologies, improvements in mobile network infrastructure, particularly in developing economies, and the successful integration of cardless ATM systems with existing banking infrastructure. Regulatory changes aimed at promoting digital finance and cybersecurity standards will also play a significant role in shaping the market's future. The ongoing focus on enhancing security measures, minimizing fraud vulnerabilities, and streamlining the user experience will continue to drive innovation and market expansion throughout the forecast period.
This in-depth report provides a comprehensive analysis of the global Cardless ATM market, offering valuable insights for industry stakeholders, investors, and strategic decision-makers. The study covers the period 2019-2033, with a focus on the forecast period 2025-2033 and a base year of 2025. The report utilizes a robust methodology incorporating extensive primary and secondary research to deliver accurate market sizing, segmentation, and growth projections. Expected market value is predicted to reach xx Million by 2033.
Cardless ATM Market Concentration & Innovation
This section analyzes the competitive landscape of the cardless ATM market, examining market concentration, innovation drivers, regulatory frameworks, product substitutes, end-user trends, and mergers & acquisitions (M&A) activities. The market is characterized by a moderately concentrated structure, with a few major players holding significant market share. However, the emergence of fintech companies and technological advancements are driving increased competition.
- Market Share: The top five players – GRG Banking, NCR Corporation, Fujitsu, Citigroup Inc, and HSBC Bank A S – collectively hold an estimated xx% of the global market share in 2025. Smaller players are focusing on niche segments and geographical regions.
- Innovation Drivers: The primary drivers of innovation are the increasing adoption of mobile banking, the demand for enhanced security features, and the need for greater convenience. The development of new technologies such as NFC, QR codes, and biometric verification is also fueling innovation.
- Regulatory Frameworks: Government regulations regarding data privacy and security are shaping the development and adoption of cardless ATM technologies. Compliance with these regulations is crucial for market players.
- Product Substitutes: Mobile payment solutions and online banking are potential substitutes for cardless ATMs, posing a competitive threat to market growth.
- End-User Trends: The increasing preference for contactless and cashless transactions is driving the adoption of cardless ATM technologies. The growing demand for convenience and security is further boosting market growth.
- M&A Activities: The cardless ATM market has witnessed several M&A activities in recent years, with larger players acquiring smaller companies to expand their product portfolios and market reach. Total M&A deal value during the historical period (2019-2024) is estimated at xx Million. Examples include [insert specific examples if available, otherwise replace with "strategic acquisitions focusing on technology enhancement and geographical expansion"].
Cardless ATM Market Industry Trends & Insights
The global cardless ATM market is experiencing significant growth, driven by several key factors. The market is projected to register a CAGR of xx% during the forecast period (2025-2033). This robust growth is fueled by a confluence of technological advancements, shifting consumer preferences, and evolving regulatory landscapes. The increasing adoption of smartphones and mobile wallets, coupled with a rising preference for contactless payment solutions, is significantly accelerating the demand for cardless ATMs. Furthermore, the growing awareness of security risks associated with traditional ATM cards is pushing consumers and financial institutions toward more secure alternatives. Technological disruptions, particularly in biometric authentication and mobile payment integration, are further enhancing the convenience and security of cardless ATM transactions. The competitive dynamics are marked by the entry of fintech companies and the strategic investments of established players in developing innovative solutions. Market penetration is expected to reach xx% by 2033.
Dominant Markets & Segments in Cardless ATM Market
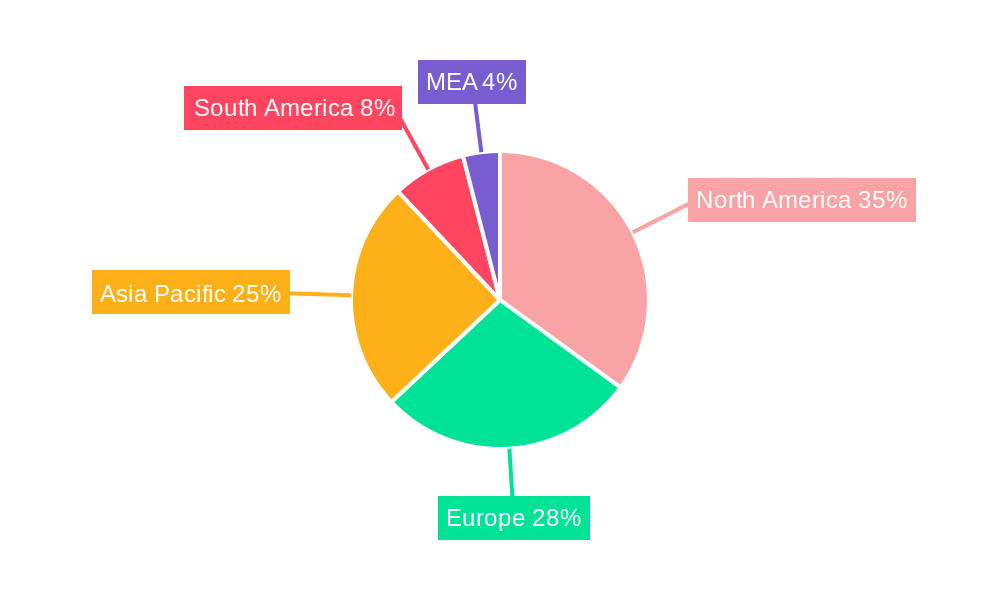
The North American region is currently the dominant market for cardless ATMs, followed by Europe and Asia-Pacific. However, the Asia-Pacific region is expected to witness the fastest growth during the forecast period due to the increasing adoption of mobile banking and the expansion of digital payment infrastructure.
- By Technology:
- NFC: NFC-enabled cardless ATMs are gaining popularity due to their ease of use and security.
- QR Codes: QR code-based cardless ATMs are cost-effective and widely accessible.
- Biometric Verification: Biometric authentication offers high security and is expected to drive significant growth.
- By Application:
- Banking: The banking sector is the primary user of cardless ATMs, driving the majority of market demand.
- Retail: Retail applications are growing as businesses look to offer convenient payment options to customers.
- By Type:
- On-site ATM: Traditional on-site ATMs are being upgraded with cardless functionality.
- Off-site ATM: Off-site ATMs are gaining popularity in remote locations and areas with limited banking infrastructure.
- Other Types: This segment includes ATMs integrated with other services or unique designs.
Key Drivers for Regional Dominance:
- North America: High adoption of mobile banking and strong digital infrastructure.
- Europe: Stringent security regulations and increasing focus on contactless payments.
- Asia-Pacific: Rapid growth of the mobile banking sector and large, underserved populations.
Cardless ATM Market Product Developments
The cardless ATM market is experiencing rapid evolution, driven by advancements in security features, user experience enhancements, and expanded functionalities. Biometric authentication, seamless mobile wallet integration (e.g., Apple Pay, Google Pay), and the widespread adoption of near-field communication (NFC) technology are significantly bolstering the security and convenience of these transactions. This aligns perfectly with the global surge in demand for contactless and secure payment solutions, catering to the evolving preferences of both consumers and businesses. Furthermore, the integration of cardless ATMs with ancillary financial services, such as streamlined bill payments, mobile top-ups, and peer-to-peer transfers, is dramatically increasing their utility and market attractiveness. This convergence of technologies is creating a more holistic and integrated financial ecosystem.
Report Scope & Segmentation Analysis
This report provides a comprehensive segmentation of the cardless ATM market based on key technological drivers (NFC, QR codes, biometric verification, and emerging technologies like voice recognition), application sectors (banking, retail, and expanding into sectors like healthcare and transportation), and deployment types (on-site, off-site, and mobile/pop-up ATMs). A meticulous analysis of each segment's growth trajectory, precise market sizing, and competitive landscape is included. Growth forecasts indicate significant variations across segments, with biometric verification and retail applications projected to demonstrate the most robust growth, fueled by escalating security concerns and the accelerating shift towards cashless transactions. The competitive landscape varies considerably across segments, with established players holding dominance in some areas, while others witness increased competition from agile fintech startups and innovative technology providers.
Key Drivers of Cardless ATM Market Growth
The cardless ATM market is propelled by several key factors:
- Increased Security: Cardless transactions significantly reduce the risk of card skimming and fraud.
- Enhanced Convenience: Users can access cash anytime, anywhere, without carrying physical cards.
- Technological Advancements: The development of NFC, QR codes, and biometric technology fuels innovation.
- Government Initiatives: Government support for digital payments and financial inclusion is driving market expansion.
Challenges in the Cardless ATM Market Sector
Despite the market's potential, several challenges impede its growth trajectory:
- High Initial Investment Costs: The deployment of cardless ATM infrastructure necessitates significant upfront capital expenditure.
- Complex Technical Integration: Integrating diverse technologies and payment systems presents considerable technical hurdles.
- Stringent Security Requirements: Maintaining robust data security and mitigating the risk of fraudulent transactions remains a paramount concern, demanding robust cybersecurity measures.
- Addressing Consumer Awareness Gaps: In certain regions, limited consumer awareness of cardless ATM technology hinders widespread adoption, requiring targeted educational campaigns.
- Regulatory Compliance and Standardization: Navigating varying regulatory landscapes and ensuring compliance with evolving data privacy regulations poses a significant challenge.
Emerging Opportunities in Cardless ATM Market
Several emerging opportunities are poised to shape the future of the cardless ATM market:
- Expansion into Underserved Markets: Bringing cardless ATMs to remote or underbanked regions can significantly enhance financial inclusion.
- Integration with other Financial Services: Offering additional services like bill payments and mobile top-ups will boost ATM utilization.
- Adoption of Advanced Technologies: Exploring technologies such as AI and machine learning to enhance user experience and security.
- Strategic Partnerships: Collaboration between banks, fintech companies, and telecom providers will facilitate market growth.
Leading Players in the Cardless ATM Market Market
- GRG Banking
- Citigroup Inc
- HSBC Bank A S
- Santander Group
- NCR Corporation
- Wells Fargo
- Barclays Bank PLC
- JPMorgan Chase & Co
- Fujitsu
- ICICI Bank Ltd
Key Developments in Cardless ATM Market Industry
- September 2023: Launch of India's first UPI-ATM, a White Label ATM (WLA) by Hitachi Payment Services in collaboration with NPCI, enabling QR-based cashless withdrawals. This significantly enhances financial inclusion and reduces reliance on physical cards.
- June 2023: Bank of Baroda introduced cardless ATMs in India, aiming to mitigate card-related fraud like skimming and cloning. This development highlights the growing focus on security in the Indian banking sector.
Strategic Outlook for Cardless ATM Market Market
The cardless ATM market is poised for sustained growth, driven by technological innovation, increasing consumer preference for contactless transactions, and a strong focus on enhancing security. Future market potential lies in expanding into underserved markets, integrating with other financial services, and embracing advanced technologies like AI and machine learning. Strategic partnerships and collaborations will further accelerate market penetration and drive innovation. The market is expected to witness significant expansion as more banks and financial institutions adopt cardless ATM solutions to provide enhanced security and a superior customer experience.
Cardless ATM Market Segmentation
-
1. Type
- 1.1. On-site ATM
- 1.2. Off-site ATM
- 1.3. Other Types
-
2. Technology
- 2.1. Near-field Communication (NFC)
- 2.2. Quick Response (QR) Codes
- 2.3. Biometric Verification
-
3. Application
- 3.1. Banking
- 3.2. Retail
Cardless ATM Market Segmentation By Geography
-
1. North America
- 1.1. United States
- 1.2. Canada
- 1.3. Mexico
-
2. South America
- 2.1. Brazil
- 2.2. Argentina
- 2.3. Rest of South America
-
3. Europe
- 3.1. United Kingdom
- 3.2. Germany
- 3.3. France
- 3.4. Italy
- 3.5. Spain
- 3.6. Russia
- 3.7. Benelux
- 3.8. Nordics
- 3.9. Rest of Europe
-
4. Middle East & Africa
- 4.1. Turkey
- 4.2. Israel
- 4.3. GCC
- 4.4. North Africa
- 4.5. South Africa
- 4.6. Rest of Middle East & Africa
-
5. Asia Pacific
- 5.1. China
- 5.2. India
- 5.3. Japan
- 5.4. South Korea
- 5.5. ASEAN
- 5.6. Oceania
- 5.7. Rest of Asia Pacific
Cardless ATM Market REPORT HIGHLIGHTS
| Aspects | Details |
|---|---|
| Study Period | 2019-2033 |
| Base Year | 2024 |
| Estimated Year | 2025 |
| Forecast Period | 2025-2033 |
| Historical Period | 2019-2024 |
| Growth Rate | CAGR of 9.67% from 2019-2033 |
| Segmentation |
|
Table of Contents
- 1. Introduction
- 1.1. Research Scope
- 1.2. Market Segmentation
- 1.3. Research Methodology
- 1.4. Definitions and Assumptions
- 2. Executive Summary
- 2.1. Introduction
- 3. Market Dynamics
- 3.1. Introduction
- 3.2. Market Drivers
- 3.2.1. The increasing acceptance and popularity of cashless transactions
- 3.3. Market Restrains
- 3.3.1. The availability of cardless ATMs is not uniform globally.
- 3.4. Market Trends
- 3.4.1. Increasing Usage of Near-field Communication (NFC) Technology
- 4. Market Factor Analysis
- 4.1. Porters Five Forces
- 4.2. Supply/Value Chain
- 4.3. PESTEL analysis
- 4.4. Market Entropy
- 4.5. Patent/Trademark Analysis
- 5. Global Cardless ATM Market Analysis, Insights and Forecast, 2019-2031
- 5.1. Market Analysis, Insights and Forecast - by Type
- 5.1.1. On-site ATM
- 5.1.2. Off-site ATM
- 5.1.3. Other Types
- 5.2. Market Analysis, Insights and Forecast - by Technology
- 5.2.1. Near-field Communication (NFC)
- 5.2.2. Quick Response (QR) Codes
- 5.2.3. Biometric Verification
- 5.3. Market Analysis, Insights and Forecast - by Application
- 5.3.1. Banking
- 5.3.2. Retail
- 5.4. Market Analysis, Insights and Forecast - by Region
- 5.4.1. North America
- 5.4.2. South America
- 5.4.3. Europe
- 5.4.4. Middle East & Africa
- 5.4.5. Asia Pacific
- 5.1. Market Analysis, Insights and Forecast - by Type
- 6. North America Cardless ATM Market Analysis, Insights and Forecast, 2019-2031
- 6.1. Market Analysis, Insights and Forecast - by Type
- 6.1.1. On-site ATM
- 6.1.2. Off-site ATM
- 6.1.3. Other Types
- 6.2. Market Analysis, Insights and Forecast - by Technology
- 6.2.1. Near-field Communication (NFC)
- 6.2.2. Quick Response (QR) Codes
- 6.2.3. Biometric Verification
- 6.3. Market Analysis, Insights and Forecast - by Application
- 6.3.1. Banking
- 6.3.2. Retail
- 6.1. Market Analysis, Insights and Forecast - by Type
- 7. South America Cardless ATM Market Analysis, Insights and Forecast, 2019-2031
- 7.1. Market Analysis, Insights and Forecast - by Type
- 7.1.1. On-site ATM
- 7.1.2. Off-site ATM
- 7.1.3. Other Types
- 7.2. Market Analysis, Insights and Forecast - by Technology
- 7.2.1. Near-field Communication (NFC)
- 7.2.2. Quick Response (QR) Codes
- 7.2.3. Biometric Verification
- 7.3. Market Analysis, Insights and Forecast - by Application
- 7.3.1. Banking
- 7.3.2. Retail
- 7.1. Market Analysis, Insights and Forecast - by Type
- 8. Europe Cardless ATM Market Analysis, Insights and Forecast, 2019-2031
- 8.1. Market Analysis, Insights and Forecast - by Type
- 8.1.1. On-site ATM
- 8.1.2. Off-site ATM
- 8.1.3. Other Types
- 8.2. Market Analysis, Insights and Forecast - by Technology
- 8.2.1. Near-field Communication (NFC)
- 8.2.2. Quick Response (QR) Codes
- 8.2.3. Biometric Verification
- 8.3. Market Analysis, Insights and Forecast - by Application
- 8.3.1. Banking
- 8.3.2. Retail
- 8.1. Market Analysis, Insights and Forecast - by Type
- 9. Middle East & Africa Cardless ATM Market Analysis, Insights and Forecast, 2019-2031
- 9.1. Market Analysis, Insights and Forecast - by Type
- 9.1.1. On-site ATM
- 9.1.2. Off-site ATM
- 9.1.3. Other Types
- 9.2. Market Analysis, Insights and Forecast - by Technology
- 9.2.1. Near-field Communication (NFC)
- 9.2.2. Quick Response (QR) Codes
- 9.2.3. Biometric Verification
- 9.3. Market Analysis, Insights and Forecast - by Application
- 9.3.1. Banking
- 9.3.2. Retail
- 9.1. Market Analysis, Insights and Forecast - by Type
- 10. Asia Pacific Cardless ATM Market Analysis, Insights and Forecast, 2019-2031
- 10.1. Market Analysis, Insights and Forecast - by Type
- 10.1.1. On-site ATM
- 10.1.2. Off-site ATM
- 10.1.3. Other Types
- 10.2. Market Analysis, Insights and Forecast - by Technology
- 10.2.1. Near-field Communication (NFC)
- 10.2.2. Quick Response (QR) Codes
- 10.2.3. Biometric Verification
- 10.3. Market Analysis, Insights and Forecast - by Application
- 10.3.1. Banking
- 10.3.2. Retail
- 10.1. Market Analysis, Insights and Forecast - by Type
- 11. North America Cardless ATM Market Analysis, Insights and Forecast, 2019-2031
- 11.1. Market Analysis, Insights and Forecast - By Country/Sub-region
- 11.1.1 United States
- 11.1.2 Canada
- 11.1.3 Mexico
- 12. Europe Cardless ATM Market Analysis, Insights and Forecast, 2019-2031
- 12.1. Market Analysis, Insights and Forecast - By Country/Sub-region
- 12.1.1 Germany
- 12.1.2 United Kingdom
- 12.1.3 France
- 12.1.4 Spain
- 12.1.5 Italy
- 12.1.6 Spain
- 12.1.7 Belgium
- 12.1.8 Netherland
- 12.1.9 Nordics
- 12.1.10 Rest of Europe
- 13. Asia Pacific Cardless ATM Market Analysis, Insights and Forecast, 2019-2031
- 13.1. Market Analysis, Insights and Forecast - By Country/Sub-region
- 13.1.1 China
- 13.1.2 Japan
- 13.1.3 India
- 13.1.4 South Korea
- 13.1.5 Southeast Asia
- 13.1.6 Australia
- 13.1.7 Indonesia
- 13.1.8 Phillipes
- 13.1.9 Singapore
- 13.1.10 Thailandc
- 13.1.11 Rest of Asia Pacific
- 14. South America Cardless ATM Market Analysis, Insights and Forecast, 2019-2031
- 14.1. Market Analysis, Insights and Forecast - By Country/Sub-region
- 14.1.1 Brazil
- 14.1.2 Argentina
- 14.1.3 Peru
- 14.1.4 Chile
- 14.1.5 Colombia
- 14.1.6 Ecuador
- 14.1.7 Venezuela
- 14.1.8 Rest of South America
- 15. MEA Cardless ATM Market Analysis, Insights and Forecast, 2019-2031
- 15.1. Market Analysis, Insights and Forecast - By Country/Sub-region
- 15.1.1 United Arab Emirates
- 15.1.2 Saudi Arabia
- 15.1.3 South Africa
- 15.1.4 Rest of Middle East and Africa
- 16. Competitive Analysis
- 16.1. Global Market Share Analysis 2024
- 16.2. Company Profiles
- 16.2.1 GRG Banking
- 16.2.1.1. Overview
- 16.2.1.2. Products
- 16.2.1.3. SWOT Analysis
- 16.2.1.4. Recent Developments
- 16.2.1.5. Financials (Based on Availability)
- 16.2.2 Citigroup Inc
- 16.2.2.1. Overview
- 16.2.2.2. Products
- 16.2.2.3. SWOT Analysis
- 16.2.2.4. Recent Developments
- 16.2.2.5. Financials (Based on Availability)
- 16.2.3 HSBC Bank A S
- 16.2.3.1. Overview
- 16.2.3.2. Products
- 16.2.3.3. SWOT Analysis
- 16.2.3.4. Recent Developments
- 16.2.3.5. Financials (Based on Availability)
- 16.2.4 Santander Group
- 16.2.4.1. Overview
- 16.2.4.2. Products
- 16.2.4.3. SWOT Analysis
- 16.2.4.4. Recent Developments
- 16.2.4.5. Financials (Based on Availability)
- 16.2.5 NCR Corporation
- 16.2.5.1. Overview
- 16.2.5.2. Products
- 16.2.5.3. SWOT Analysis
- 16.2.5.4. Recent Developments
- 16.2.5.5. Financials (Based on Availability)
- 16.2.6 Wells Fargo
- 16.2.6.1. Overview
- 16.2.6.2. Products
- 16.2.6.3. SWOT Analysis
- 16.2.6.4. Recent Developments
- 16.2.6.5. Financials (Based on Availability)
- 16.2.7 Barclays Bank PLC
- 16.2.7.1. Overview
- 16.2.7.2. Products
- 16.2.7.3. SWOT Analysis
- 16.2.7.4. Recent Developments
- 16.2.7.5. Financials (Based on Availability)
- 16.2.8 JPMorgan Chase & Co
- 16.2.8.1. Overview
- 16.2.8.2. Products
- 16.2.8.3. SWOT Analysis
- 16.2.8.4. Recent Developments
- 16.2.8.5. Financials (Based on Availability)
- 16.2.9 Fujitsu
- 16.2.9.1. Overview
- 16.2.9.2. Products
- 16.2.9.3. SWOT Analysis
- 16.2.9.4. Recent Developments
- 16.2.9.5. Financials (Based on Availability)
- 16.2.10 ICICI Bank Ltd
- 16.2.10.1. Overview
- 16.2.10.2. Products
- 16.2.10.3. SWOT Analysis
- 16.2.10.4. Recent Developments
- 16.2.10.5. Financials (Based on Availability)
- 16.2.1 GRG Banking
List of Figures
- Figure 1: Global Cardless ATM Market Revenue Breakdown (Million, %) by Region 2024 & 2032
- Figure 2: North America Cardless ATM Market Revenue (Million), by Country 2024 & 2032
- Figure 3: North America Cardless ATM Market Revenue Share (%), by Country 2024 & 2032
- Figure 4: Europe Cardless ATM Market Revenue (Million), by Country 2024 & 2032
- Figure 5: Europe Cardless ATM Market Revenue Share (%), by Country 2024 & 2032
- Figure 6: Asia Pacific Cardless ATM Market Revenue (Million), by Country 2024 & 2032
- Figure 7: Asia Pacific Cardless ATM Market Revenue Share (%), by Country 2024 & 2032
- Figure 8: South America Cardless ATM Market Revenue (Million), by Country 2024 & 2032
- Figure 9: South America Cardless ATM Market Revenue Share (%), by Country 2024 & 2032
- Figure 10: MEA Cardless ATM Market Revenue (Million), by Country 2024 & 2032
- Figure 11: MEA Cardless ATM Market Revenue Share (%), by Country 2024 & 2032
- Figure 12: North America Cardless ATM Market Revenue (Million), by Type 2024 & 2032
- Figure 13: North America Cardless ATM Market Revenue Share (%), by Type 2024 & 2032
- Figure 14: North America Cardless ATM Market Revenue (Million), by Technology 2024 & 2032
- Figure 15: North America Cardless ATM Market Revenue Share (%), by Technology 2024 & 2032
- Figure 16: North America Cardless ATM Market Revenue (Million), by Application 2024 & 2032
- Figure 17: North America Cardless ATM Market Revenue Share (%), by Application 2024 & 2032
- Figure 18: North America Cardless ATM Market Revenue (Million), by Country 2024 & 2032
- Figure 19: North America Cardless ATM Market Revenue Share (%), by Country 2024 & 2032
- Figure 20: South America Cardless ATM Market Revenue (Million), by Type 2024 & 2032
- Figure 21: South America Cardless ATM Market Revenue Share (%), by Type 2024 & 2032
- Figure 22: South America Cardless ATM Market Revenue (Million), by Technology 2024 & 2032
- Figure 23: South America Cardless ATM Market Revenue Share (%), by Technology 2024 & 2032
- Figure 24: South America Cardless ATM Market Revenue (Million), by Application 2024 & 2032
- Figure 25: South America Cardless ATM Market Revenue Share (%), by Application 2024 & 2032
- Figure 26: South America Cardless ATM Market Revenue (Million), by Country 2024 & 2032
- Figure 27: South America Cardless ATM Market Revenue Share (%), by Country 2024 & 2032
- Figure 28: Europe Cardless ATM Market Revenue (Million), by Type 2024 & 2032
- Figure 29: Europe Cardless ATM Market Revenue Share (%), by Type 2024 & 2032
- Figure 30: Europe Cardless ATM Market Revenue (Million), by Technology 2024 & 2032
- Figure 31: Europe Cardless ATM Market Revenue Share (%), by Technology 2024 & 2032
- Figure 32: Europe Cardless ATM Market Revenue (Million), by Application 2024 & 2032
- Figure 33: Europe Cardless ATM Market Revenue Share (%), by Application 2024 & 2032
- Figure 34: Europe Cardless ATM Market Revenue (Million), by Country 2024 & 2032
- Figure 35: Europe Cardless ATM Market Revenue Share (%), by Country 2024 & 2032
- Figure 36: Middle East & Africa Cardless ATM Market Revenue (Million), by Type 2024 & 2032
- Figure 37: Middle East & Africa Cardless ATM Market Revenue Share (%), by Type 2024 & 2032
- Figure 38: Middle East & Africa Cardless ATM Market Revenue (Million), by Technology 2024 & 2032
- Figure 39: Middle East & Africa Cardless ATM Market Revenue Share (%), by Technology 2024 & 2032
- Figure 40: Middle East & Africa Cardless ATM Market Revenue (Million), by Application 2024 & 2032
- Figure 41: Middle East & Africa Cardless ATM Market Revenue Share (%), by Application 2024 & 2032
- Figure 42: Middle East & Africa Cardless ATM Market Revenue (Million), by Country 2024 & 2032
- Figure 43: Middle East & Africa Cardless ATM Market Revenue Share (%), by Country 2024 & 2032
- Figure 44: Asia Pacific Cardless ATM Market Revenue (Million), by Type 2024 & 2032
- Figure 45: Asia Pacific Cardless ATM Market Revenue Share (%), by Type 2024 & 2032
- Figure 46: Asia Pacific Cardless ATM Market Revenue (Million), by Technology 2024 & 2032
- Figure 47: Asia Pacific Cardless ATM Market Revenue Share (%), by Technology 2024 & 2032
- Figure 48: Asia Pacific Cardless ATM Market Revenue (Million), by Application 2024 & 2032
- Figure 49: Asia Pacific Cardless ATM Market Revenue Share (%), by Application 2024 & 2032
- Figure 50: Asia Pacific Cardless ATM Market Revenue (Million), by Country 2024 & 2032
- Figure 51: Asia Pacific Cardless ATM Market Revenue Share (%), by Country 2024 & 2032
List of Tables
- Table 1: Global Cardless ATM Market Revenue Million Forecast, by Region 2019 & 2032
- Table 2: Global Cardless ATM Market Revenue Million Forecast, by Type 2019 & 2032
- Table 3: Global Cardless ATM Market Revenue Million Forecast, by Technology 2019 & 2032
- Table 4: Global Cardless ATM Market Revenue Million Forecast, by Application 2019 & 2032
- Table 5: Global Cardless ATM Market Revenue Million Forecast, by Region 2019 & 2032
- Table 6: Global Cardless ATM Market Revenue Million Forecast, by Country 2019 & 2032
- Table 7: United States Cardless ATM Market Revenue (Million) Forecast, by Application 2019 & 2032
- Table 8: Canada Cardless ATM Market Revenue (Million) Forecast, by Application 2019 & 2032
- Table 9: Mexico Cardless ATM Market Revenue (Million) Forecast, by Application 2019 & 2032
- Table 10: Global Cardless ATM Market Revenue Million Forecast, by Country 2019 & 2032
- Table 11: Germany Cardless ATM Market Revenue (Million) Forecast, by Application 2019 & 2032
- Table 12: United Kingdom Cardless ATM Market Revenue (Million) Forecast, by Application 2019 & 2032
- Table 13: France Cardless ATM Market Revenue (Million) Forecast, by Application 2019 & 2032
- Table 14: Spain Cardless ATM Market Revenue (Million) Forecast, by Application 2019 & 2032
- Table 15: Italy Cardless ATM Market Revenue (Million) Forecast, by Application 2019 & 2032
- Table 16: Spain Cardless ATM Market Revenue (Million) Forecast, by Application 2019 & 2032
- Table 17: Belgium Cardless ATM Market Revenue (Million) Forecast, by Application 2019 & 2032
- Table 18: Netherland Cardless ATM Market Revenue (Million) Forecast, by Application 2019 & 2032
- Table 19: Nordics Cardless ATM Market Revenue (Million) Forecast, by Application 2019 & 2032
- Table 20: Rest of Europe Cardless ATM Market Revenue (Million) Forecast, by Application 2019 & 2032
- Table 21: Global Cardless ATM Market Revenue Million Forecast, by Country 2019 & 2032
- Table 22: China Cardless ATM Market Revenue (Million) Forecast, by Application 2019 & 2032
- Table 23: Japan Cardless ATM Market Revenue (Million) Forecast, by Application 2019 & 2032
- Table 24: India Cardless ATM Market Revenue (Million) Forecast, by Application 2019 & 2032
- Table 25: South Korea Cardless ATM Market Revenue (Million) Forecast, by Application 2019 & 2032
- Table 26: Southeast Asia Cardless ATM Market Revenue (Million) Forecast, by Application 2019 & 2032
- Table 27: Australia Cardless ATM Market Revenue (Million) Forecast, by Application 2019 & 2032
- Table 28: Indonesia Cardless ATM Market Revenue (Million) Forecast, by Application 2019 & 2032
- Table 29: Phillipes Cardless ATM Market Revenue (Million) Forecast, by Application 2019 & 2032
- Table 30: Singapore Cardless ATM Market Revenue (Million) Forecast, by Application 2019 & 2032
- Table 31: Thailandc Cardless ATM Market Revenue (Million) Forecast, by Application 2019 & 2032
- Table 32: Rest of Asia Pacific Cardless ATM Market Revenue (Million) Forecast, by Application 2019 & 2032
- Table 33: Global Cardless ATM Market Revenue Million Forecast, by Country 2019 & 2032
- Table 34: Brazil Cardless ATM Market Revenue (Million) Forecast, by Application 2019 & 2032
- Table 35: Argentina Cardless ATM Market Revenue (Million) Forecast, by Application 2019 & 2032
- Table 36: Peru Cardless ATM Market Revenue (Million) Forecast, by Application 2019 & 2032
- Table 37: Chile Cardless ATM Market Revenue (Million) Forecast, by Application 2019 & 2032
- Table 38: Colombia Cardless ATM Market Revenue (Million) Forecast, by Application 2019 & 2032
- Table 39: Ecuador Cardless ATM Market Revenue (Million) Forecast, by Application 2019 & 2032
- Table 40: Venezuela Cardless ATM Market Revenue (Million) Forecast, by Application 2019 & 2032
- Table 41: Rest of South America Cardless ATM Market Revenue (Million) Forecast, by Application 2019 & 2032
- Table 42: Global Cardless ATM Market Revenue Million Forecast, by Country 2019 & 2032
- Table 43: United Arab Emirates Cardless ATM Market Revenue (Million) Forecast, by Application 2019 & 2032
- Table 44: Saudi Arabia Cardless ATM Market Revenue (Million) Forecast, by Application 2019 & 2032
- Table 45: South Africa Cardless ATM Market Revenue (Million) Forecast, by Application 2019 & 2032
- Table 46: Rest of Middle East and Africa Cardless ATM Market Revenue (Million) Forecast, by Application 2019 & 2032
- Table 47: Global Cardless ATM Market Revenue Million Forecast, by Type 2019 & 2032
- Table 48: Global Cardless ATM Market Revenue Million Forecast, by Technology 2019 & 2032
- Table 49: Global Cardless ATM Market Revenue Million Forecast, by Application 2019 & 2032
- Table 50: Global Cardless ATM Market Revenue Million Forecast, by Country 2019 & 2032
- Table 51: United States Cardless ATM Market Revenue (Million) Forecast, by Application 2019 & 2032
- Table 52: Canada Cardless ATM Market Revenue (Million) Forecast, by Application 2019 & 2032
- Table 53: Mexico Cardless ATM Market Revenue (Million) Forecast, by Application 2019 & 2032
- Table 54: Global Cardless ATM Market Revenue Million Forecast, by Type 2019 & 2032
- Table 55: Global Cardless ATM Market Revenue Million Forecast, by Technology 2019 & 2032
- Table 56: Global Cardless ATM Market Revenue Million Forecast, by Application 2019 & 2032
- Table 57: Global Cardless ATM Market Revenue Million Forecast, by Country 2019 & 2032
- Table 58: Brazil Cardless ATM Market Revenue (Million) Forecast, by Application 2019 & 2032
- Table 59: Argentina Cardless ATM Market Revenue (Million) Forecast, by Application 2019 & 2032
- Table 60: Rest of South America Cardless ATM Market Revenue (Million) Forecast, by Application 2019 & 2032
- Table 61: Global Cardless ATM Market Revenue Million Forecast, by Type 2019 & 2032
- Table 62: Global Cardless ATM Market Revenue Million Forecast, by Technology 2019 & 2032
- Table 63: Global Cardless ATM Market Revenue Million Forecast, by Application 2019 & 2032
- Table 64: Global Cardless ATM Market Revenue Million Forecast, by Country 2019 & 2032
- Table 65: United Kingdom Cardless ATM Market Revenue (Million) Forecast, by Application 2019 & 2032
- Table 66: Germany Cardless ATM Market Revenue (Million) Forecast, by Application 2019 & 2032
- Table 67: France Cardless ATM Market Revenue (Million) Forecast, by Application 2019 & 2032
- Table 68: Italy Cardless ATM Market Revenue (Million) Forecast, by Application 2019 & 2032
- Table 69: Spain Cardless ATM Market Revenue (Million) Forecast, by Application 2019 & 2032
- Table 70: Russia Cardless ATM Market Revenue (Million) Forecast, by Application 2019 & 2032
- Table 71: Benelux Cardless ATM Market Revenue (Million) Forecast, by Application 2019 & 2032
- Table 72: Nordics Cardless ATM Market Revenue (Million) Forecast, by Application 2019 & 2032
- Table 73: Rest of Europe Cardless ATM Market Revenue (Million) Forecast, by Application 2019 & 2032
- Table 74: Global Cardless ATM Market Revenue Million Forecast, by Type 2019 & 2032
- Table 75: Global Cardless ATM Market Revenue Million Forecast, by Technology 2019 & 2032
- Table 76: Global Cardless ATM Market Revenue Million Forecast, by Application 2019 & 2032
- Table 77: Global Cardless ATM Market Revenue Million Forecast, by Country 2019 & 2032
- Table 78: Turkey Cardless ATM Market Revenue (Million) Forecast, by Application 2019 & 2032
- Table 79: Israel Cardless ATM Market Revenue (Million) Forecast, by Application 2019 & 2032
- Table 80: GCC Cardless ATM Market Revenue (Million) Forecast, by Application 2019 & 2032
- Table 81: North Africa Cardless ATM Market Revenue (Million) Forecast, by Application 2019 & 2032
- Table 82: South Africa Cardless ATM Market Revenue (Million) Forecast, by Application 2019 & 2032
- Table 83: Rest of Middle East & Africa Cardless ATM Market Revenue (Million) Forecast, by Application 2019 & 2032
- Table 84: Global Cardless ATM Market Revenue Million Forecast, by Type 2019 & 2032
- Table 85: Global Cardless ATM Market Revenue Million Forecast, by Technology 2019 & 2032
- Table 86: Global Cardless ATM Market Revenue Million Forecast, by Application 2019 & 2032
- Table 87: Global Cardless ATM Market Revenue Million Forecast, by Country 2019 & 2032
- Table 88: China Cardless ATM Market Revenue (Million) Forecast, by Application 2019 & 2032
- Table 89: India Cardless ATM Market Revenue (Million) Forecast, by Application 2019 & 2032
- Table 90: Japan Cardless ATM Market Revenue (Million) Forecast, by Application 2019 & 2032
- Table 91: South Korea Cardless ATM Market Revenue (Million) Forecast, by Application 2019 & 2032
- Table 92: ASEAN Cardless ATM Market Revenue (Million) Forecast, by Application 2019 & 2032
- Table 93: Oceania Cardless ATM Market Revenue (Million) Forecast, by Application 2019 & 2032
- Table 94: Rest of Asia Pacific Cardless ATM Market Revenue (Million) Forecast, by Application 2019 & 2032
Frequently Asked Questions
1. What is the projected Compound Annual Growth Rate (CAGR) of the Cardless ATM Market?
The projected CAGR is approximately 9.67%.
2. Which companies are prominent players in the Cardless ATM Market?
Key companies in the market include GRG Banking, Citigroup Inc, HSBC Bank A S, Santander Group, NCR Corporation, Wells Fargo, Barclays Bank PLC, JPMorgan Chase & Co, Fujitsu, ICICI Bank Ltd.
3. What are the main segments of the Cardless ATM Market?
The market segments include Type, Technology, Application.
4. Can you provide details about the market size?
The market size is estimated to be USD 2.40 Million as of 2022.
5. What are some drivers contributing to market growth?
The increasing acceptance and popularity of cashless transactions.
6. What are the notable trends driving market growth?
Increasing Usage of Near-field Communication (NFC) Technology.
7. Are there any restraints impacting market growth?
The availability of cardless ATMs is not uniform globally..
8. Can you provide examples of recent developments in the market?
September 2023: India's first UPI-ATM was launched as a White Label ATM (WLA) by Hitachi Payment Services in collaboration with the National Payments Corporation of India (NPCI) to enable seamless cash withdrawals, eliminating the need to carry physical ATM cards. It offers an experience that allows customers of certain banks to enjoy QR-based cashless withdrawals.
9. What pricing options are available for accessing the report?
Pricing options include single-user, multi-user, and enterprise licenses priced at USD 4750, USD 5250, and USD 8750 respectively.
10. Is the market size provided in terms of value or volume?
The market size is provided in terms of value, measured in Million.
11. Are there any specific market keywords associated with the report?
Yes, the market keyword associated with the report is "Cardless ATM Market," which aids in identifying and referencing the specific market segment covered.
12. How do I determine which pricing option suits my needs best?
The pricing options vary based on user requirements and access needs. Individual users may opt for single-user licenses, while businesses requiring broader access may choose multi-user or enterprise licenses for cost-effective access to the report.
13. Are there any additional resources or data provided in the Cardless ATM Market report?
While the report offers comprehensive insights, it's advisable to review the specific contents or supplementary materials provided to ascertain if additional resources or data are available.
14. How can I stay updated on further developments or reports in the Cardless ATM Market?
To stay informed about further developments, trends, and reports in the Cardless ATM Market, consider subscribing to industry newsletters, following relevant companies and organizations, or regularly checking reputable industry news sources and publications.
Methodology
Step 1 - Identification of Relevant Samples Size from Population Database


Step 2 - Approaches for Defining Global Market Size (Value, Volume* & Price*)

Note*: In applicable scenarios
Step 3 - Data Sources
Primary Research
- Web Analytics
- Survey Reports
- Research Institute
- Latest Research Reports
- Opinion Leaders
Secondary Research
- Annual Reports
- White Paper
- Latest Press Release
- Industry Association
- Paid Database
- Investor Presentations

Step 4 - Data Triangulation
Involves using different sources of information in order to increase the validity of a study
These sources are likely to be stakeholders in a program - participants, other researchers, program staff, other community members, and so on.
Then we put all data in single framework & apply various statistical tools to find out the dynamic on the market.
During the analysis stage, feedback from the stakeholder groups would be compared to determine areas of agreement as well as areas of divergence


