
Key Insights
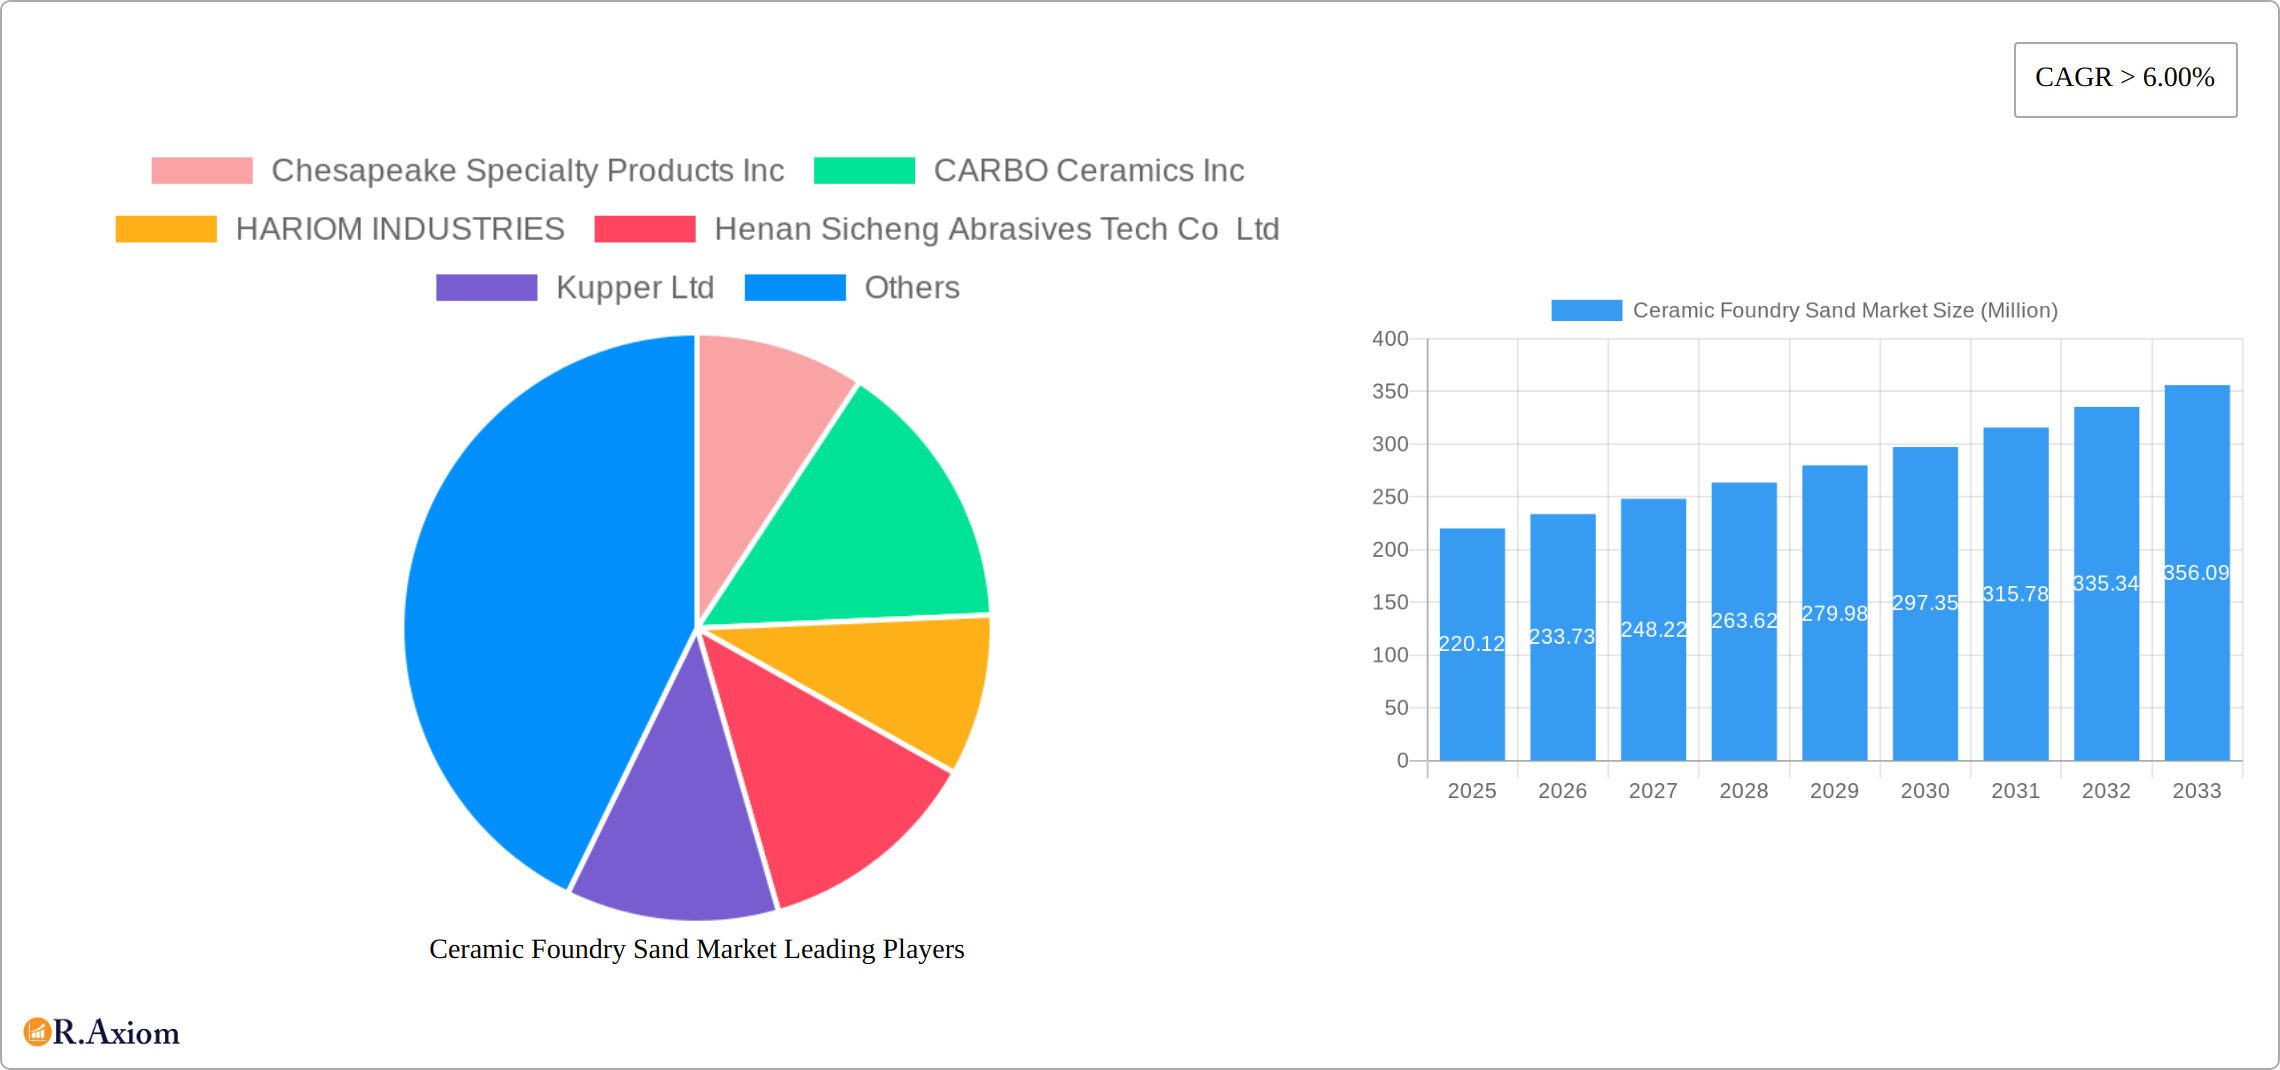
The global ceramic foundry sand market, valued at $220.12 million in 2025, is projected to experience robust growth, exhibiting a Compound Annual Growth Rate (CAGR) exceeding 6% from 2025 to 2033. This expansion is driven by several key factors. The increasing demand for high-performance castings across diverse industries, including automotive, aerospace, and energy, fuels the need for superior foundry sands offering enhanced properties like high thermal shock resistance, improved moldability, and consistent casting quality. Furthermore, the adoption of advanced manufacturing techniques and the growing focus on environmental sustainability are pushing the demand for ceramic foundry sands as they offer a more environmentally friendly alternative to traditional silica-based sands. The market's growth is also supported by technological advancements in ceramic sand production leading to improved efficiency and cost-effectiveness. However, challenges such as the relatively higher cost compared to traditional sands and the need for specialized handling and processing equipment could potentially restrain market growth to some extent.
The competitive landscape is fragmented, with numerous players such as Chesapeake Specialty Products Inc, CARBO Ceramics Inc, and HARIOM INDUSTRIES contributing to the market’s dynamism. Regional variations in market growth are anticipated, with developed economies likely showcasing a steady growth trajectory fueled by technological advancements and increased adoption of advanced casting techniques, while emerging economies might exhibit more rapid expansion driven by increasing industrialization and infrastructure development. Continuous innovation in material science and the development of new ceramic compositions are expected to shape future market trends, further enhancing the performance and application versatility of ceramic foundry sands.
Ceramic Foundry Sand Market: A Comprehensive Report (2019-2033)
This in-depth report provides a comprehensive analysis of the global Ceramic Foundry Sand Market, offering valuable insights for stakeholders across the value chain. Covering the period from 2019 to 2033, with a base year of 2025 and a forecast period of 2025-2033, this report meticulously examines market dynamics, trends, and future prospects. The study incorporates detailed segmentation analysis, competitive landscape assessments, and growth projections, providing actionable intelligence to inform strategic decision-making. The total market size in 2025 is estimated at XX Million, projected to reach XX Million by 2033, exhibiting a CAGR of XX% during the forecast period.
Ceramic Foundry Sand Market Concentration & Innovation
The Ceramic Foundry Sand market exhibits a moderately concentrated structure, with a few major players holding significant market share. The top five companies, including Chesapeake Specialty Products Inc, CARBO Ceramics Inc, HARIOM INDUSTRIES, and others, collectively account for approximately XX% of the global market in 2025. However, the market is also characterized by the presence of several smaller regional players, particularly in Asia.
Innovation within the sector is driven by the need for improved foundry performance, environmental regulations, and cost optimization. Key innovations include the development of high-strength, low-permeability sands, environmentally friendly binders, and automated sand handling systems. Regulatory frameworks, such as those focused on reducing emissions and waste, are influencing innovation by promoting the adoption of sustainable sand technologies. The market witnesses consistent product substitution, with newer, more efficient ceramic sands replacing traditional silica sands in various applications. End-user trends towards lighter and stronger castings are driving the demand for high-performance ceramic foundry sands. M&A activities are relatively infrequent but play a role in shaping the competitive landscape, with deal values ranging from XX Million to XX Million in recent years.
Ceramic Foundry Sand Market Industry Trends & Insights
The Ceramic Foundry Sand market is witnessing robust growth, driven by factors such as increasing demand from the automotive and construction industries, expanding global infrastructure development, and the rising adoption of advanced casting techniques. Technological disruptions, primarily in the form of advanced materials science and automation, are significantly impacting market dynamics. Consumer preferences are shifting towards higher-quality castings with improved durability and reduced defects, fueling the demand for superior ceramic sands. The competitive dynamics are characterized by intense price competition, product differentiation strategies, and geographic expansion efforts. The market penetration of ceramic sands is increasing steadily, driven by their superior properties compared to traditional sands.

Dominant Markets & Segments in Ceramic Foundry Sand Market
The Asia-Pacific region dominates the global Ceramic Foundry Sand market, accounting for approximately XX% of the total market share in 2025. This dominance is attributed to several factors:
- Rapid Industrialization: A surge in manufacturing and infrastructure projects fuels demand for castings.
- Growing Automotive Sector: The region's booming automotive industry drives significant demand for high-quality ceramic foundry sands.
- Favorable Government Policies: Supportive economic policies and infrastructure investments contribute to market growth.
China, specifically, stands out as the leading national market within the region. The substantial automotive and construction industries, combined with supportive government initiatives, make it a key driver of global ceramic foundry sand demand. While other regions, such as North America and Europe, exhibit steady growth, the Asia-Pacific region is projected to maintain its leadership position throughout the forecast period.
Ceramic Foundry Sand Market Product Developments
Recent advancements in ceramic foundry sand technology focus on enhanced strength, permeability, and reusability. Innovations include the development of self-bonding sands, reducing the need for harmful binders, and the introduction of specialized coatings to improve sand properties. These innovations cater to the growing demand for high-quality castings with improved surface finish and dimensional accuracy, offering significant competitive advantages to manufacturers.
Report Scope & Segmentation Analysis
This comprehensive report delves into the Ceramic Foundry Sand market, providing an in-depth analysis segmented by crucial parameters. Our segmentation aims to offer a granular understanding of market dynamics, catering to diverse stakeholder needs.
- By Type: The market is meticulously categorized based on the intrinsic composition and performance characteristics of ceramic sands. Key segments include Zircon Sand, Chromite Sand, and Olivine Sand, among others. Projections indicate that Zircon Sand is anticipated to exhibit the highest Compound Annual Growth Rate (CAGR), largely attributable to its superior refractoriness, excellent thermal stability, and minimal reaction with molten metals, making it ideal for demanding casting applications.
- By Application: The market segmentation by application highlights the diverse end-use industries for ceramic foundry sand. Dominant segments include the Automotive sector, followed by Construction, Machinery, and other niche applications. The automotive segment is projected to maintain its leadership position, driven by the continuous demand for lightweight, durable, and high-precision castings in modern vehicle manufacturing, including electric vehicles.
- By Region: A thorough regional analysis covers key markets such as North America, Europe, Asia-Pacific, South America, and the Middle East & Africa. The Asia-Pacific region stands out, not only leading in current market size but also demonstrating the most robust growth trajectory, fueled by rapid industrialization, burgeoning manufacturing capabilities, and significant investments in infrastructure development across countries like China, India, and Southeast Asian nations.
Key Drivers of Ceramic Foundry Sand Market Growth
The sustained expansion of the Ceramic Foundry Sand market is propelled by a confluence of robust growth catalysts. A primary driver is the expansion of the global automotive industry, which necessitates a consistent supply of high-quality castings. Complementing this is the increasing pace of global infrastructure development, leading to heightened demand from construction machinery and heavy equipment manufacturing. The growing global demand for lightweight and high-strength castings, crucial for enhancing fuel efficiency and performance across various sectors, further bolsters market growth. Furthermore, the increasing adoption of advanced casting techniques, such as shell molding and investment casting, which benefit from the superior properties of ceramic sands, is a significant contributor. Importantly, the increasingly stringent environmental regulations worldwide are accelerating the adoption of eco-friendly and reusable ceramic sands, aligning with sustainability goals and driving innovation in the sector.
Challenges in the Ceramic Foundry Sand Market Sector
The Ceramic Foundry Sand market faces challenges such as fluctuating raw material prices, intense competition among manufacturers, and environmental concerns related to the disposal of used sand. These factors can impact profitability and sustainability in the industry. Supply chain disruptions due to geopolitical events also pose a risk, with potential for price increases and shortages.
Emerging Opportunities in Ceramic Foundry Sand Market
The Ceramic Foundry Sand market is ripe with emerging opportunities poised to redefine its growth trajectory. A key avenue lies in the development of advanced ceramic sand formulations possessing enhanced properties like improved thermal shock resistance, superior surface finish capabilities, and reduced environmental impact. The exploration and penetration of new application domains, particularly in high-growth sectors such as aerospace, where precision and material integrity are paramount, and the energy sector (including renewable energy components), present substantial untapped potential. Moreover, the increasing emphasis on circular economy principles, fostering the widespread adoption of sand reuse and recycling technologies, offers a significant opportunity to reduce waste, lower operational costs, and enhance sustainability within the foundry industry. These opportunities collectively pave the way for substantial growth and pioneering innovation.
Leading Players in the Ceramic Foundry Sand Market Market
- Chesapeake Specialty Products Inc
- CARBO Ceramics Inc
- HARIOM INDUSTRIES
- Henan Sicheng Abrasives Tech Co Ltd
- Kupper Ltd
- Kailin Foundry
- Qingdao Duoyuan New Materials Co Ltd
- Samarth Metallurgicals
- Hebei Shenghuo New Material Technology Co Ltd (SHXK)
- ZHENGZHOU HAIXU ABRASIVES CO LTD
- List Not Exhaustive
Key Developments in Ceramic Foundry Sand Market Industry
- Jan 2023: Company X launched a new line of high-strength ceramic sands, expanding its product portfolio.
- Apr 2022: Company Y acquired Company Z, strengthening its market position and expanding its geographical reach.
- Further details are available in the full report.
Strategic Outlook for Ceramic Foundry Sand Market Market
The Ceramic Foundry Sand market is poised for continued growth, driven by factors such as technological advancements, increasing industrialization, and rising demand for high-performance castings. Strategic investments in R&D, focus on sustainable practices, and expansion into emerging markets are expected to shape the future of the industry.
Ceramic Foundry Sand Market Segmentation
-
1. Application
- 1.1. Resin Coated Sand
- 1.2. Cold Box Casting
- 1.3. Low Foam Casting
- 1.4. Facing Sand
- 1.5. Other Applications
Ceramic Foundry Sand Market Segmentation By Geography
-
1. Asia Pacific
- 1.1. China
- 1.2. India
- 1.3. Japan
- 1.4. South Korea
- 1.5. Indonesia
- 1.6. Malaysia
- 1.7. Thailand
- 1.8. Vietnam
- 1.9. Rest of Asia Pacific
-
2. North America
- 2.1. United States
- 2.2. Canada
- 2.3. Mexico
-
3. Europe
- 3.1. Germany
- 3.2. United Kingdom
- 3.3. Italy
- 3.4. France
- 3.5. Spain
- 3.6. Russia
- 3.7. NORDIC Countries
- 3.8. Turkey
- 3.9. Rest of Europe
-
4. South America
- 4.1. Brazil
- 4.2. Argentina
- 4.3. Colombia
- 4.4. Rest of South America
-
5. Middle East and Africa
- 5.1. Saudi Arabia
- 5.2. South Africa
- 5.3. Qatar
- 5.4. UAE
- 5.5. Egypt
- 5.6. Rest of Middle East and Africa

Ceramic Foundry Sand Market REPORT HIGHLIGHTS
| Aspects | Details |
|---|---|
| Study Period | 2019-2033 |
| Base Year | 2024 |
| Estimated Year | 2025 |
| Forecast Period | 2025-2033 |
| Historical Period | 2019-2024 |
| Growth Rate | CAGR of > 6.00% from 2019-2033 |
| Segmentation |
|
Table of Contents
- 1. Introduction
- 1.1. Research Scope
- 1.2. Market Segmentation
- 1.3. Research Methodology
- 1.4. Definitions and Assumptions
- 2. Executive Summary
- 2.1. Introduction
- 3. Market Dynamics
- 3.1. Introduction
- 3.2. Market Drivers
- 3.2.1. Increasing Demand from the Foundry Industry; Growing Demand from the Metal Casting Industry; Other Drivers
- 3.3. Market Restrains
- 3.3.1. Increasing Demand from the Foundry Industry; Growing Demand from the Metal Casting Industry; Other Drivers
- 3.4. Market Trends
- 3.4.1. Resin Coated Sand to Dominate the Market
- 4. Market Factor Analysis
- 4.1. Porters Five Forces
- 4.2. Supply/Value Chain
- 4.3. PESTEL analysis
- 4.4. Market Entropy
- 4.5. Patent/Trademark Analysis
- 5. Global Ceramic Foundry Sand Market Analysis, Insights and Forecast, 2019-2031
- 5.1. Market Analysis, Insights and Forecast - by Application
- 5.1.1. Resin Coated Sand
- 5.1.2. Cold Box Casting
- 5.1.3. Low Foam Casting
- 5.1.4. Facing Sand
- 5.1.5. Other Applications
- 5.2. Market Analysis, Insights and Forecast - by Region
- 5.2.1. Asia Pacific
- 5.2.2. North America
- 5.2.3. Europe
- 5.2.4. South America
- 5.2.5. Middle East and Africa
- 5.1. Market Analysis, Insights and Forecast - by Application
- 6. Asia Pacific Ceramic Foundry Sand Market Analysis, Insights and Forecast, 2019-2031
- 6.1. Market Analysis, Insights and Forecast - by Application
- 6.1.1. Resin Coated Sand
- 6.1.2. Cold Box Casting
- 6.1.3. Low Foam Casting
- 6.1.4. Facing Sand
- 6.1.5. Other Applications
- 6.1. Market Analysis, Insights and Forecast - by Application
- 7. North America Ceramic Foundry Sand Market Analysis, Insights and Forecast, 2019-2031
- 7.1. Market Analysis, Insights and Forecast - by Application
- 7.1.1. Resin Coated Sand
- 7.1.2. Cold Box Casting
- 7.1.3. Low Foam Casting
- 7.1.4. Facing Sand
- 7.1.5. Other Applications
- 7.1. Market Analysis, Insights and Forecast - by Application
- 8. Europe Ceramic Foundry Sand Market Analysis, Insights and Forecast, 2019-2031
- 8.1. Market Analysis, Insights and Forecast - by Application
- 8.1.1. Resin Coated Sand
- 8.1.2. Cold Box Casting
- 8.1.3. Low Foam Casting
- 8.1.4. Facing Sand
- 8.1.5. Other Applications
- 8.1. Market Analysis, Insights and Forecast - by Application
- 9. South America Ceramic Foundry Sand Market Analysis, Insights and Forecast, 2019-2031
- 9.1. Market Analysis, Insights and Forecast - by Application
- 9.1.1. Resin Coated Sand
- 9.1.2. Cold Box Casting
- 9.1.3. Low Foam Casting
- 9.1.4. Facing Sand
- 9.1.5. Other Applications
- 9.1. Market Analysis, Insights and Forecast - by Application
- 10. Middle East and Africa Ceramic Foundry Sand Market Analysis, Insights and Forecast, 2019-2031
- 10.1. Market Analysis, Insights and Forecast - by Application
- 10.1.1. Resin Coated Sand
- 10.1.2. Cold Box Casting
- 10.1.3. Low Foam Casting
- 10.1.4. Facing Sand
- 10.1.5. Other Applications
- 10.1. Market Analysis, Insights and Forecast - by Application
- 11. Competitive Analysis
- 11.1. Global Market Share Analysis 2024
- 11.2. Company Profiles
- 11.2.1 Chesapeake Specialty Products Inc
- 11.2.1.1. Overview
- 11.2.1.2. Products
- 11.2.1.3. SWOT Analysis
- 11.2.1.4. Recent Developments
- 11.2.1.5. Financials (Based on Availability)
- 11.2.2 CARBO Ceramics Inc
- 11.2.2.1. Overview
- 11.2.2.2. Products
- 11.2.2.3. SWOT Analysis
- 11.2.2.4. Recent Developments
- 11.2.2.5. Financials (Based on Availability)
- 11.2.3 HARIOM INDUSTRIES
- 11.2.3.1. Overview
- 11.2.3.2. Products
- 11.2.3.3. SWOT Analysis
- 11.2.3.4. Recent Developments
- 11.2.3.5. Financials (Based on Availability)
- 11.2.4 Henan Sicheng Abrasives Tech Co Ltd
- 11.2.4.1. Overview
- 11.2.4.2. Products
- 11.2.4.3. SWOT Analysis
- 11.2.4.4. Recent Developments
- 11.2.4.5. Financials (Based on Availability)
- 11.2.5 Kupper Ltd
- 11.2.5.1. Overview
- 11.2.5.2. Products
- 11.2.5.3. SWOT Analysis
- 11.2.5.4. Recent Developments
- 11.2.5.5. Financials (Based on Availability)
- 11.2.6 Kailin Foundry
- 11.2.6.1. Overview
- 11.2.6.2. Products
- 11.2.6.3. SWOT Analysis
- 11.2.6.4. Recent Developments
- 11.2.6.5. Financials (Based on Availability)
- 11.2.7 Qingdao Duoyuan New Materials Co Ltd
- 11.2.7.1. Overview
- 11.2.7.2. Products
- 11.2.7.3. SWOT Analysis
- 11.2.7.4. Recent Developments
- 11.2.7.5. Financials (Based on Availability)
- 11.2.8 Samarth Metallurgicals
- 11.2.8.1. Overview
- 11.2.8.2. Products
- 11.2.8.3. SWOT Analysis
- 11.2.8.4. Recent Developments
- 11.2.8.5. Financials (Based on Availability)
- 11.2.9 Hebei Shenghuo New Material Technology Co Ltd (SHXK)
- 11.2.9.1. Overview
- 11.2.9.2. Products
- 11.2.9.3. SWOT Analysis
- 11.2.9.4. Recent Developments
- 11.2.9.5. Financials (Based on Availability)
- 11.2.10 ZHENGZHOU HAIXU ABRASIVES CO LTD*List Not Exhaustive
- 11.2.10.1. Overview
- 11.2.10.2. Products
- 11.2.10.3. SWOT Analysis
- 11.2.10.4. Recent Developments
- 11.2.10.5. Financials (Based on Availability)
- 11.2.1 Chesapeake Specialty Products Inc
List of Figures
- Figure 1: Global Ceramic Foundry Sand Market Revenue Breakdown (Million, %) by Region 2024 & 2032
- Figure 2: Global Ceramic Foundry Sand Market Volume Breakdown (Million, %) by Region 2024 & 2032
- Figure 3: Asia Pacific Ceramic Foundry Sand Market Revenue (Million), by Application 2024 & 2032
- Figure 4: Asia Pacific Ceramic Foundry Sand Market Volume (Million), by Application 2024 & 2032
- Figure 5: Asia Pacific Ceramic Foundry Sand Market Revenue Share (%), by Application 2024 & 2032
- Figure 6: Asia Pacific Ceramic Foundry Sand Market Volume Share (%), by Application 2024 & 2032
- Figure 7: Asia Pacific Ceramic Foundry Sand Market Revenue (Million), by Country 2024 & 2032
- Figure 8: Asia Pacific Ceramic Foundry Sand Market Volume (Million), by Country 2024 & 2032
- Figure 9: Asia Pacific Ceramic Foundry Sand Market Revenue Share (%), by Country 2024 & 2032
- Figure 10: Asia Pacific Ceramic Foundry Sand Market Volume Share (%), by Country 2024 & 2032
- Figure 11: North America Ceramic Foundry Sand Market Revenue (Million), by Application 2024 & 2032
- Figure 12: North America Ceramic Foundry Sand Market Volume (Million), by Application 2024 & 2032
- Figure 13: North America Ceramic Foundry Sand Market Revenue Share (%), by Application 2024 & 2032
- Figure 14: North America Ceramic Foundry Sand Market Volume Share (%), by Application 2024 & 2032
- Figure 15: North America Ceramic Foundry Sand Market Revenue (Million), by Country 2024 & 2032
- Figure 16: North America Ceramic Foundry Sand Market Volume (Million), by Country 2024 & 2032
- Figure 17: North America Ceramic Foundry Sand Market Revenue Share (%), by Country 2024 & 2032
- Figure 18: North America Ceramic Foundry Sand Market Volume Share (%), by Country 2024 & 2032
- Figure 19: Europe Ceramic Foundry Sand Market Revenue (Million), by Application 2024 & 2032
- Figure 20: Europe Ceramic Foundry Sand Market Volume (Million), by Application 2024 & 2032
- Figure 21: Europe Ceramic Foundry Sand Market Revenue Share (%), by Application 2024 & 2032
- Figure 22: Europe Ceramic Foundry Sand Market Volume Share (%), by Application 2024 & 2032
- Figure 23: Europe Ceramic Foundry Sand Market Revenue (Million), by Country 2024 & 2032
- Figure 24: Europe Ceramic Foundry Sand Market Volume (Million), by Country 2024 & 2032
- Figure 25: Europe Ceramic Foundry Sand Market Revenue Share (%), by Country 2024 & 2032
- Figure 26: Europe Ceramic Foundry Sand Market Volume Share (%), by Country 2024 & 2032
- Figure 27: South America Ceramic Foundry Sand Market Revenue (Million), by Application 2024 & 2032
- Figure 28: South America Ceramic Foundry Sand Market Volume (Million), by Application 2024 & 2032
- Figure 29: South America Ceramic Foundry Sand Market Revenue Share (%), by Application 2024 & 2032
- Figure 30: South America Ceramic Foundry Sand Market Volume Share (%), by Application 2024 & 2032
- Figure 31: South America Ceramic Foundry Sand Market Revenue (Million), by Country 2024 & 2032
- Figure 32: South America Ceramic Foundry Sand Market Volume (Million), by Country 2024 & 2032
- Figure 33: South America Ceramic Foundry Sand Market Revenue Share (%), by Country 2024 & 2032
- Figure 34: South America Ceramic Foundry Sand Market Volume Share (%), by Country 2024 & 2032
- Figure 35: Middle East and Africa Ceramic Foundry Sand Market Revenue (Million), by Application 2024 & 2032
- Figure 36: Middle East and Africa Ceramic Foundry Sand Market Volume (Million), by Application 2024 & 2032
- Figure 37: Middle East and Africa Ceramic Foundry Sand Market Revenue Share (%), by Application 2024 & 2032
- Figure 38: Middle East and Africa Ceramic Foundry Sand Market Volume Share (%), by Application 2024 & 2032
- Figure 39: Middle East and Africa Ceramic Foundry Sand Market Revenue (Million), by Country 2024 & 2032
- Figure 40: Middle East and Africa Ceramic Foundry Sand Market Volume (Million), by Country 2024 & 2032
- Figure 41: Middle East and Africa Ceramic Foundry Sand Market Revenue Share (%), by Country 2024 & 2032
- Figure 42: Middle East and Africa Ceramic Foundry Sand Market Volume Share (%), by Country 2024 & 2032
List of Tables
- Table 1: Global Ceramic Foundry Sand Market Revenue Million Forecast, by Region 2019 & 2032
- Table 2: Global Ceramic Foundry Sand Market Volume Million Forecast, by Region 2019 & 2032
- Table 3: Global Ceramic Foundry Sand Market Revenue Million Forecast, by Application 2019 & 2032
- Table 4: Global Ceramic Foundry Sand Market Volume Million Forecast, by Application 2019 & 2032
- Table 5: Global Ceramic Foundry Sand Market Revenue Million Forecast, by Region 2019 & 2032
- Table 6: Global Ceramic Foundry Sand Market Volume Million Forecast, by Region 2019 & 2032
- Table 7: Global Ceramic Foundry Sand Market Revenue Million Forecast, by Application 2019 & 2032
- Table 8: Global Ceramic Foundry Sand Market Volume Million Forecast, by Application 2019 & 2032
- Table 9: Global Ceramic Foundry Sand Market Revenue Million Forecast, by Country 2019 & 2032
- Table 10: Global Ceramic Foundry Sand Market Volume Million Forecast, by Country 2019 & 2032
- Table 11: China Ceramic Foundry Sand Market Revenue (Million) Forecast, by Application 2019 & 2032
- Table 12: China Ceramic Foundry Sand Market Volume (Million) Forecast, by Application 2019 & 2032
- Table 13: India Ceramic Foundry Sand Market Revenue (Million) Forecast, by Application 2019 & 2032
- Table 14: India Ceramic Foundry Sand Market Volume (Million) Forecast, by Application 2019 & 2032
- Table 15: Japan Ceramic Foundry Sand Market Revenue (Million) Forecast, by Application 2019 & 2032
- Table 16: Japan Ceramic Foundry Sand Market Volume (Million) Forecast, by Application 2019 & 2032
- Table 17: South Korea Ceramic Foundry Sand Market Revenue (Million) Forecast, by Application 2019 & 2032
- Table 18: South Korea Ceramic Foundry Sand Market Volume (Million) Forecast, by Application 2019 & 2032
- Table 19: Indonesia Ceramic Foundry Sand Market Revenue (Million) Forecast, by Application 2019 & 2032
- Table 20: Indonesia Ceramic Foundry Sand Market Volume (Million) Forecast, by Application 2019 & 2032
- Table 21: Malaysia Ceramic Foundry Sand Market Revenue (Million) Forecast, by Application 2019 & 2032
- Table 22: Malaysia Ceramic Foundry Sand Market Volume (Million) Forecast, by Application 2019 & 2032
- Table 23: Thailand Ceramic Foundry Sand Market Revenue (Million) Forecast, by Application 2019 & 2032
- Table 24: Thailand Ceramic Foundry Sand Market Volume (Million) Forecast, by Application 2019 & 2032
- Table 25: Vietnam Ceramic Foundry Sand Market Revenue (Million) Forecast, by Application 2019 & 2032
- Table 26: Vietnam Ceramic Foundry Sand Market Volume (Million) Forecast, by Application 2019 & 2032
- Table 27: Rest of Asia Pacific Ceramic Foundry Sand Market Revenue (Million) Forecast, by Application 2019 & 2032
- Table 28: Rest of Asia Pacific Ceramic Foundry Sand Market Volume (Million) Forecast, by Application 2019 & 2032
- Table 29: Global Ceramic Foundry Sand Market Revenue Million Forecast, by Application 2019 & 2032
- Table 30: Global Ceramic Foundry Sand Market Volume Million Forecast, by Application 2019 & 2032
- Table 31: Global Ceramic Foundry Sand Market Revenue Million Forecast, by Country 2019 & 2032
- Table 32: Global Ceramic Foundry Sand Market Volume Million Forecast, by Country 2019 & 2032
- Table 33: United States Ceramic Foundry Sand Market Revenue (Million) Forecast, by Application 2019 & 2032
- Table 34: United States Ceramic Foundry Sand Market Volume (Million) Forecast, by Application 2019 & 2032
- Table 35: Canada Ceramic Foundry Sand Market Revenue (Million) Forecast, by Application 2019 & 2032
- Table 36: Canada Ceramic Foundry Sand Market Volume (Million) Forecast, by Application 2019 & 2032
- Table 37: Mexico Ceramic Foundry Sand Market Revenue (Million) Forecast, by Application 2019 & 2032
- Table 38: Mexico Ceramic Foundry Sand Market Volume (Million) Forecast, by Application 2019 & 2032
- Table 39: Global Ceramic Foundry Sand Market Revenue Million Forecast, by Application 2019 & 2032
- Table 40: Global Ceramic Foundry Sand Market Volume Million Forecast, by Application 2019 & 2032
- Table 41: Global Ceramic Foundry Sand Market Revenue Million Forecast, by Country 2019 & 2032
- Table 42: Global Ceramic Foundry Sand Market Volume Million Forecast, by Country 2019 & 2032
- Table 43: Germany Ceramic Foundry Sand Market Revenue (Million) Forecast, by Application 2019 & 2032
- Table 44: Germany Ceramic Foundry Sand Market Volume (Million) Forecast, by Application 2019 & 2032
- Table 45: United Kingdom Ceramic Foundry Sand Market Revenue (Million) Forecast, by Application 2019 & 2032
- Table 46: United Kingdom Ceramic Foundry Sand Market Volume (Million) Forecast, by Application 2019 & 2032
- Table 47: Italy Ceramic Foundry Sand Market Revenue (Million) Forecast, by Application 2019 & 2032
- Table 48: Italy Ceramic Foundry Sand Market Volume (Million) Forecast, by Application 2019 & 2032
- Table 49: France Ceramic Foundry Sand Market Revenue (Million) Forecast, by Application 2019 & 2032
- Table 50: France Ceramic Foundry Sand Market Volume (Million) Forecast, by Application 2019 & 2032
- Table 51: Spain Ceramic Foundry Sand Market Revenue (Million) Forecast, by Application 2019 & 2032
- Table 52: Spain Ceramic Foundry Sand Market Volume (Million) Forecast, by Application 2019 & 2032
- Table 53: Russia Ceramic Foundry Sand Market Revenue (Million) Forecast, by Application 2019 & 2032
- Table 54: Russia Ceramic Foundry Sand Market Volume (Million) Forecast, by Application 2019 & 2032
- Table 55: NORDIC Countries Ceramic Foundry Sand Market Revenue (Million) Forecast, by Application 2019 & 2032
- Table 56: NORDIC Countries Ceramic Foundry Sand Market Volume (Million) Forecast, by Application 2019 & 2032
- Table 57: Turkey Ceramic Foundry Sand Market Revenue (Million) Forecast, by Application 2019 & 2032
- Table 58: Turkey Ceramic Foundry Sand Market Volume (Million) Forecast, by Application 2019 & 2032
- Table 59: Rest of Europe Ceramic Foundry Sand Market Revenue (Million) Forecast, by Application 2019 & 2032
- Table 60: Rest of Europe Ceramic Foundry Sand Market Volume (Million) Forecast, by Application 2019 & 2032
- Table 61: Global Ceramic Foundry Sand Market Revenue Million Forecast, by Application 2019 & 2032
- Table 62: Global Ceramic Foundry Sand Market Volume Million Forecast, by Application 2019 & 2032
- Table 63: Global Ceramic Foundry Sand Market Revenue Million Forecast, by Country 2019 & 2032
- Table 64: Global Ceramic Foundry Sand Market Volume Million Forecast, by Country 2019 & 2032
- Table 65: Brazil Ceramic Foundry Sand Market Revenue (Million) Forecast, by Application 2019 & 2032
- Table 66: Brazil Ceramic Foundry Sand Market Volume (Million) Forecast, by Application 2019 & 2032
- Table 67: Argentina Ceramic Foundry Sand Market Revenue (Million) Forecast, by Application 2019 & 2032
- Table 68: Argentina Ceramic Foundry Sand Market Volume (Million) Forecast, by Application 2019 & 2032
- Table 69: Colombia Ceramic Foundry Sand Market Revenue (Million) Forecast, by Application 2019 & 2032
- Table 70: Colombia Ceramic Foundry Sand Market Volume (Million) Forecast, by Application 2019 & 2032
- Table 71: Rest of South America Ceramic Foundry Sand Market Revenue (Million) Forecast, by Application 2019 & 2032
- Table 72: Rest of South America Ceramic Foundry Sand Market Volume (Million) Forecast, by Application 2019 & 2032
- Table 73: Global Ceramic Foundry Sand Market Revenue Million Forecast, by Application 2019 & 2032
- Table 74: Global Ceramic Foundry Sand Market Volume Million Forecast, by Application 2019 & 2032
- Table 75: Global Ceramic Foundry Sand Market Revenue Million Forecast, by Country 2019 & 2032
- Table 76: Global Ceramic Foundry Sand Market Volume Million Forecast, by Country 2019 & 2032
- Table 77: Saudi Arabia Ceramic Foundry Sand Market Revenue (Million) Forecast, by Application 2019 & 2032
- Table 78: Saudi Arabia Ceramic Foundry Sand Market Volume (Million) Forecast, by Application 2019 & 2032
- Table 79: South Africa Ceramic Foundry Sand Market Revenue (Million) Forecast, by Application 2019 & 2032
- Table 80: South Africa Ceramic Foundry Sand Market Volume (Million) Forecast, by Application 2019 & 2032
- Table 81: Qatar Ceramic Foundry Sand Market Revenue (Million) Forecast, by Application 2019 & 2032
- Table 82: Qatar Ceramic Foundry Sand Market Volume (Million) Forecast, by Application 2019 & 2032
- Table 83: UAE Ceramic Foundry Sand Market Revenue (Million) Forecast, by Application 2019 & 2032
- Table 84: UAE Ceramic Foundry Sand Market Volume (Million) Forecast, by Application 2019 & 2032
- Table 85: Egypt Ceramic Foundry Sand Market Revenue (Million) Forecast, by Application 2019 & 2032
- Table 86: Egypt Ceramic Foundry Sand Market Volume (Million) Forecast, by Application 2019 & 2032
- Table 87: Rest of Middle East and Africa Ceramic Foundry Sand Market Revenue (Million) Forecast, by Application 2019 & 2032
- Table 88: Rest of Middle East and Africa Ceramic Foundry Sand Market Volume (Million) Forecast, by Application 2019 & 2032
Frequently Asked Questions
1. What is the projected Compound Annual Growth Rate (CAGR) of the Ceramic Foundry Sand Market?
The projected CAGR is approximately > 6.00%.
2. Which companies are prominent players in the Ceramic Foundry Sand Market?
Key companies in the market include Chesapeake Specialty Products Inc, CARBO Ceramics Inc, HARIOM INDUSTRIES, Henan Sicheng Abrasives Tech Co Ltd, Kupper Ltd, Kailin Foundry, Qingdao Duoyuan New Materials Co Ltd, Samarth Metallurgicals, Hebei Shenghuo New Material Technology Co Ltd (SHXK), ZHENGZHOU HAIXU ABRASIVES CO LTD*List Not Exhaustive.
3. What are the main segments of the Ceramic Foundry Sand Market?
The market segments include Application.
4. Can you provide details about the market size?
The market size is estimated to be USD 220.12 Million as of 2022.
5. What are some drivers contributing to market growth?
Increasing Demand from the Foundry Industry; Growing Demand from the Metal Casting Industry; Other Drivers.
6. What are the notable trends driving market growth?
Resin Coated Sand to Dominate the Market.
7. Are there any restraints impacting market growth?
Increasing Demand from the Foundry Industry; Growing Demand from the Metal Casting Industry; Other Drivers.
8. Can you provide examples of recent developments in the market?
The recent developments pertaining to the major players in the market are being covered in the complete study.
9. What pricing options are available for accessing the report?
Pricing options include single-user, multi-user, and enterprise licenses priced at USD 4750, USD 5250, and USD 8750 respectively.
10. Is the market size provided in terms of value or volume?
The market size is provided in terms of value, measured in Million and volume, measured in Million.
11. Are there any specific market keywords associated with the report?
Yes, the market keyword associated with the report is "Ceramic Foundry Sand Market," which aids in identifying and referencing the specific market segment covered.
12. How do I determine which pricing option suits my needs best?
The pricing options vary based on user requirements and access needs. Individual users may opt for single-user licenses, while businesses requiring broader access may choose multi-user or enterprise licenses for cost-effective access to the report.
13. Are there any additional resources or data provided in the Ceramic Foundry Sand Market report?
While the report offers comprehensive insights, it's advisable to review the specific contents or supplementary materials provided to ascertain if additional resources or data are available.
14. How can I stay updated on further developments or reports in the Ceramic Foundry Sand Market?
To stay informed about further developments, trends, and reports in the Ceramic Foundry Sand Market, consider subscribing to industry newsletters, following relevant companies and organizations, or regularly checking reputable industry news sources and publications.
Methodology
Step 1 - Identification of Relevant Samples Size from Population Database


Step 2 - Approaches for Defining Global Market Size (Value, Volume* & Price*)

Note*: In applicable scenarios
Step 3 - Data Sources
Primary Research
- Web Analytics
- Survey Reports
- Research Institute
- Latest Research Reports
- Opinion Leaders
Secondary Research
- Annual Reports
- White Paper
- Latest Press Release
- Industry Association
- Paid Database
- Investor Presentations

Step 4 - Data Triangulation
Involves using different sources of information in order to increase the validity of a study
These sources are likely to be stakeholders in a program - participants, other researchers, program staff, other community members, and so on.
Then we put all data in single framework & apply various statistical tools to find out the dynamic on the market.
During the analysis stage, feedback from the stakeholder groups would be compared to determine areas of agreement as well as areas of divergence


