
Key Insights
The Enterprise Mobility Security (EMS) market is experiencing robust growth, projected to reach \$1.21 billion in 2025 and maintain a Compound Annual Growth Rate (CAGR) of 11.70% from 2025 to 2033. This expansion is driven by several key factors. The increasing adoption of mobile devices for business operations across diverse sectors like banking, healthcare, and IT necessitates robust security solutions. The rise in remote work and bring-your-own-device (BYOD) policies further fuels demand for comprehensive EMS solutions capable of managing and securing access across diverse platforms and locations. Furthermore, stringent data privacy regulations and the escalating threat landscape, including sophisticated cyberattacks targeting mobile endpoints, are compelling organizations to invest heavily in advanced security measures. The market is segmented by device type (smartphones, laptops, tablets) and end-user industry, reflecting the varied needs and security challenges across different sectors. Leading vendors, including Honeywell, Blackberry, IBM, McAfee, and Cisco, are actively innovating and expanding their product portfolios to capitalize on this growth trajectory. Geographical distribution shows a significant market presence in North America and Europe, driven by early adoption and stringent regulatory environments. However, rapid growth is expected in the Asia-Pacific region, fueled by increasing digitalization and a growing number of mobile users.
The continuous evolution of cyber threats and the increasing sophistication of attack vectors are likely to push the market toward more advanced solutions. This includes the integration of AI and machine learning for threat detection and response, strengthened authentication methods, and enhanced data loss prevention (DLP) capabilities. The market will witness a gradual shift from traditional perimeter-based security models to cloud-based and zero-trust architectures, offering better flexibility and scalability. The competitive landscape is highly dynamic, with established players facing challenges from agile startups offering innovative solutions. Consolidation through mergers and acquisitions is expected as companies strive to expand their market share and offer a comprehensive suite of EMS solutions. The sustained growth in the EMS market is, therefore, a direct consequence of the ongoing digital transformation, the expanding reliance on mobile technologies, and the critical need to mitigate the ever-present security risks associated with enterprise mobility.

Enterprise Mobility Security Industry: A Comprehensive Market Report (2019-2033)
This detailed report provides a comprehensive analysis of the Enterprise Mobility Security (EMS) industry, covering market size, growth drivers, challenges, and opportunities from 2019 to 2033. The study period encompasses historical data (2019-2024), a base year (2025), and a forecast period (2025-2033), offering valuable insights for stakeholders across the EMS ecosystem. The report uses millions (M) for all value figures.
Enterprise Mobility Security Industry Market Concentration & Innovation
The Enterprise Mobility Security market is characterized by a moderately concentrated landscape with several major players holding significant market share. While precise market share figures for each company require further detailed analysis and are unavailable, estimates suggest that Microsoft Corporation, IBM Corporation, and Blackberry Limited collectively hold a significant portion (estimated xxM) of the overall market value. This concentration reflects the high barriers to entry associated with developing and maintaining robust security solutions for a diverse range of enterprise mobile devices.
Innovation in the EMS sector is driven primarily by the escalating need for enhanced security against sophisticated cyber threats, the rapid growth of mobile device usage in the workplace, and the increasing adoption of cloud-based solutions. The regulatory environment, including GDPR and other data privacy regulations, further fuels innovation as companies strive to meet compliance requirements. While some existing technologies offer suitable substitutes for specific EMS functionalities, the overall market demands integrated solutions providing comprehensive security and management. End-user trends, such as Bring Your Own Device (BYOD) policies, continue to shape the market and demand scalable and flexible security solutions. The rising frequency of M&A activities signals the industry's dynamic nature, with deal values reaching hundreds of millions of dollars in recent years. For instance, the acquisition of Mobliciti by Kocho (Oct 2022) showcased strategic moves to expand service offerings and enhance enterprise security capabilities, driving market consolidation.
- Market Concentration: Moderately concentrated, with key players holding significant shares.
- Innovation Drivers: Growing cyber threats, BYOD policies, cloud adoption, regulatory compliance.
- M&A Activity: Significant, with deals like Kocho's acquisition of Mobliciti illustrating market consolidation.
- Estimated Total Market Value: xxM in 2025
Enterprise Mobility Security Industry Industry Trends & Insights
The Enterprise Mobility Security market is experiencing robust growth, projected to reach xxM by 2033. The Compound Annual Growth Rate (CAGR) during the forecast period (2025-2033) is estimated at xx%. This growth is propelled by several key factors. The increasing adoption of mobile devices within organizations, fueled by the rise of remote work and the demand for improved operational efficiency, significantly contributes to the market's expansion. Furthermore, the growing sophistication of cyber threats and the associated data breaches highlight the critical need for robust EMS solutions, driving market penetration. The shift towards cloud-based EMS solutions and the integration of advanced security technologies like artificial intelligence (AI) and machine learning (ML) are additional drivers. Competitive dynamics are characterized by ongoing innovation, strategic partnerships, and acquisitions, with established players and emerging companies vying for market share. Consumer preferences emphasize the ease of use, robust security features, and seamless integration with existing enterprise systems. Market penetration of advanced security features such as zero-trust network access and multi-factor authentication (MFA) are steadily increasing, reflecting the growing emphasis on enhanced security.

Dominant Markets & Segments in Enterprise Mobility Security Industry
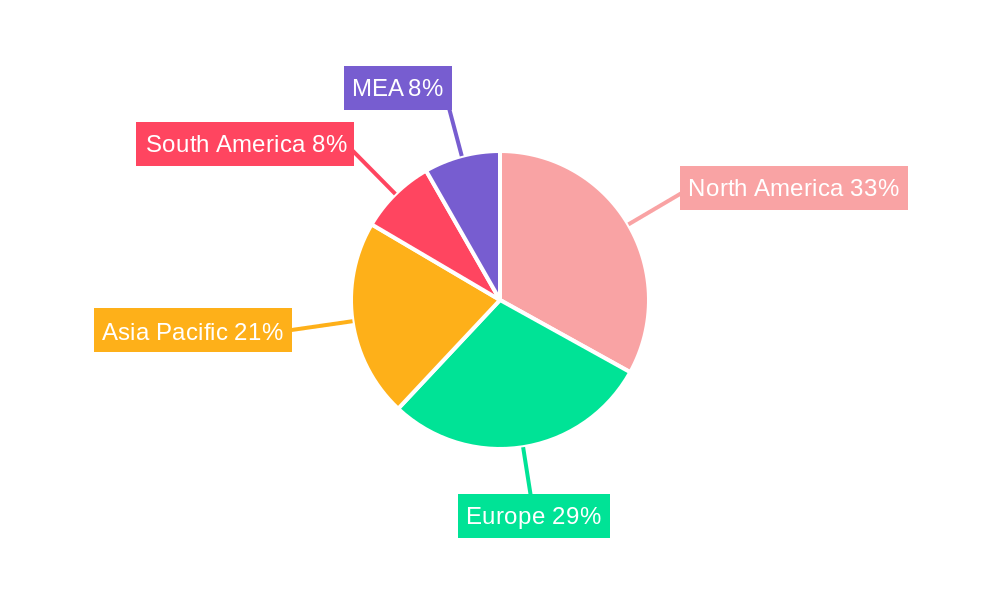
While a precise identification of the single most dominant region or country requires access to detailed sales data, North America and Western Europe are currently considered leading regions in terms of market value and adoption. The significant presence of technology companies and a high degree of digitalization in these regions drives higher demand for advanced EMS solutions. Amongst end-user industries, Banking/Insurance, Healthcare, and IT & Telecom sectors represent major segments in the EMS market. These sectors handle sensitive data and face significant regulatory pressures, leading them to invest heavily in security infrastructure.
Key Drivers for Leading Segments:
- Banking/Insurance: Stringent regulatory compliance, high volume of sensitive data.
- Healthcare: HIPAA compliance, patient data protection.
- IT & Telecom: Protection of critical infrastructure, sensitive customer data.
- Government: National security concerns, public data protection.
By Device: Smartphones currently hold the largest market share due to widespread usage, but tablets and laptops are also important segments.
- Smartphones: High penetration, need for BYOD solutions.
- Tablets: Increasing adoption for certain tasks and increased use in the workplace.
- Laptops: Essential devices in many industries, but pose specific security concerns.
The dominance of these segments and regions is expected to persist throughout the forecast period, driven by ongoing technological advancements and increasing security concerns.
Enterprise Mobility Security Industry Product Developments
Recent product innovations in the Enterprise Mobility Security (EMS) industry are significantly enhancing security postures. A key focus is the integration of Artificial Intelligence (AI) and Machine Learning (ML) for proactive threat detection and response, moving beyond reactive measures. This includes advanced behavioral analytics to identify anomalies and predict potential attacks. Enhanced endpoint security solutions provide granular control and protection across diverse mobile devices, including BYOD scenarios. Improvements in Data Loss Prevention (DLP) capabilities leverage advanced techniques like data masking and encryption to safeguard sensitive information, regardless of location or device. These developments directly address emerging threats such as sophisticated phishing attacks, ransomware, and insider threats, while simultaneously enhancing user experience through intuitive interfaces and streamlined workflows. Companies are also prioritizing seamless integration with existing enterprise systems (such as Active Directory and SIEM platforms), offering flexible deployment models (cloud, on-premise, hybrid) and diverse pricing structures tailored to various organizational sizes and budgets. The market demand for these advanced solutions remains robust, fueled by the ever-growing reliance on mobile devices and the increasing need for robust security in a mobile-first business environment.
Report Scope & Segmentation Analysis
This report segments the Enterprise Mobility Security market by device type (smartphones, laptops, tablets) and end-user industry (Banking/Insurance, Healthcare, IT & Telecom, Government, Other). Each segment is analyzed based on market size, growth projections, and competitive dynamics. For instance, the smartphone segment is expected to experience significant growth due to the high penetration of smartphones in the workplace. Similarly, the healthcare sector displays robust growth potential due to the increasing amount of sensitive patient data needing protection. Market sizes vary significantly across segments, with banking and insurance, and IT and Telecom likely holding the largest market shares due to their high dependence on data security. The competitive dynamics within each segment differ depending on the specific needs and regulatory environments.
Key Drivers of Enterprise Mobility Security Industry Growth
The explosive growth of the EMS market is driven by a confluence of factors. Technological advancements, particularly the sophisticated application of AI/ML in security solutions, are enabling more effective and predictive threat detection and response. Economic factors, such as the widespread adoption of cloud computing and the continued shift towards remote and hybrid work models, have dramatically increased the attack surface and the demand for robust EMS solutions to protect dispersed workforces and data. Stringent regulatory pressures, stemming from data privacy regulations like GDPR, CCPA, and others, are compelling organizations to invest in advanced security measures to ensure compliance and avoid hefty penalties. Furthermore, the rising frequency, sophistication, and financial impact of cyberattacks, including ransomware attacks targeting critical infrastructure, are fueling demand for comprehensive and proactive EMS solutions capable of mitigating these risks effectively.
Challenges in the Enterprise Mobility Security Industry Sector
Several challenges hinder the growth of the EMS industry. Regulatory hurdles associated with data privacy and compliance can increase compliance costs and complexity for companies. Supply chain disruptions can impact the availability of necessary hardware and software components. Intense competitive pressures and the constant emergence of sophisticated cyber threats necessitate continuous innovation, creating a dynamic and highly competitive environment. This continuous need for adaptation increases the cost and complexity of maintaining security infrastructure. These factors contribute to higher market entry barriers, especially for newer and smaller companies.
Emerging Opportunities in Enterprise Mobility Security Industry
The EMS market presents numerous compelling opportunities for innovation and growth. The rollout of 5G networks globally is paving the way for faster data transfer speeds, enabling more efficient real-time threat detection and response. Advancements in Internet of Things (IoT) security solutions are crucial to addressing the growing security challenges posed by the expanding ecosystem of connected devices. The development and implementation of improved user authentication methods, such as multi-factor authentication (MFA) and behavioral biometrics, are enhancing security while simultaneously improving user experience. The increasing adoption of cloud-based security solutions offers organizations of all sizes the benefits of scalable, cost-effective, and easily managed security infrastructure, removing the burden of significant upfront capital expenditure. These opportunities underscore the dynamism and considerable growth potential within the EMS industry.
Leading Players in the Enterprise Mobility Security Industry Market
- Honeywell International Inc
- Blackberry Limited
- IBM Corporation
- McAfee LLC
- AirWatch
- Cisco Systems Inc
- Microsoft Corporation
- Oracle Corporation
- Symantec Corporation
- Citrix Systems Inc
- MobileIron
- SAP SE
Key Developments in Enterprise Mobility Security Industry Industry
October 2022: Kocho acquires Mobliciti, expanding its enterprise mobility and security services offerings. This merger significantly enhances the capabilities of both companies, providing a broader range of services for their customers, and fostering faster digital transformation.
July 2022: CWSI purchases AVR International for EUR 5.2M, strengthening its position in the UK market and expanding its client base to include one of the world's largest private hospital groups. This acquisition enhances CWSI's capacity to provide comprehensive enterprise mobility and security solutions.
Strategic Outlook for Enterprise Mobility Security Industry Market
The Enterprise Mobility Security market is projected to experience continued robust growth, driven by the unrelenting need for enhanced security in an increasingly interconnected and digital world. The adoption of advanced technologies like AI/ML, the rising awareness of sophisticated cybersecurity threats, and the pervasive use of mobile devices across various sectors will continue to fuel market expansion. Significant opportunities exist for companies to develop innovative solutions that address emerging security challenges, such as zero-trust architectures and supply chain security vulnerabilities. These solutions must cater to the evolving needs of enterprises, offering flexibility, scalability, and user-friendliness while ensuring robust protection against a constantly evolving threat landscape. The future of the market rests upon the continuous development of secure, user-friendly, and adaptable technologies capable of keeping pace with rapid technological advancements and the ever-increasing sophistication of cyberattacks.
Enterprise Mobility Security Industry Segmentation
-
1. Device
- 1.1. Smartphones
- 1.2. Laptops
- 1.3. Tablets
-
2. End-User
- 2.1. Banking/Insurance
- 2.2. Healthcare
- 2.3. IT and Telecom
- 2.4. Government
- 2.5. Other End-user Industries
Enterprise Mobility Security Industry Segmentation By Geography
- 1. North America
- 2. Europe
- 3. Asia Pacific
- 4. Latin America
- 5. Middle East and Africa
Enterprise Mobility Security Industry REPORT HIGHLIGHTS
| Aspects | Details |
|---|---|
| Study Period | 2019-2033 |
| Base Year | 2024 |
| Estimated Year | 2025 |
| Forecast Period | 2025-2033 |
| Historical Period | 2019-2024 |
| Growth Rate | CAGR of 11.70% from 2019-2033 |
| Segmentation |
|
Table of Contents
- 1. Introduction
- 1.1. Research Scope
- 1.2. Market Segmentation
- 1.3. Research Methodology
- 1.4. Definitions and Assumptions
- 2. Executive Summary
- 2.1. Introduction
- 3. Market Dynamics
- 3.1. Introduction
- 3.2. Market Drivers
- 3.2.1. Industrial Internet of Things (IIoT) has Accelerated the Use-cases in the Market; Increasing Implementation of the BYOD Concept
- 3.3. Market Restrains
- 3.3.1. Security Vulnerability for Manufacturing Vendors is Discouraging the Market Growth.; Government Regulations and Infrastructure Maintenance act as Market Challenges
- 3.4. Market Trends
- 3.4.1. Banking/Insurance Industry to Hold Significant Market Share
- 4. Market Factor Analysis
- 4.1. Porters Five Forces
- 4.2. Supply/Value Chain
- 4.3. PESTEL analysis
- 4.4. Market Entropy
- 4.5. Patent/Trademark Analysis
- 5. Global Enterprise Mobility Security Industry Analysis, Insights and Forecast, 2019-2031
- 5.1. Market Analysis, Insights and Forecast - by Device
- 5.1.1. Smartphones
- 5.1.2. Laptops
- 5.1.3. Tablets
- 5.2. Market Analysis, Insights and Forecast - by End-User
- 5.2.1. Banking/Insurance
- 5.2.2. Healthcare
- 5.2.3. IT and Telecom
- 5.2.4. Government
- 5.2.5. Other End-user Industries
- 5.3. Market Analysis, Insights and Forecast - by Region
- 5.3.1. North America
- 5.3.2. Europe
- 5.3.3. Asia Pacific
- 5.3.4. Latin America
- 5.3.5. Middle East and Africa
- 5.1. Market Analysis, Insights and Forecast - by Device
- 6. North America Enterprise Mobility Security Industry Analysis, Insights and Forecast, 2019-2031
- 6.1. Market Analysis, Insights and Forecast - by Device
- 6.1.1. Smartphones
- 6.1.2. Laptops
- 6.1.3. Tablets
- 6.2. Market Analysis, Insights and Forecast - by End-User
- 6.2.1. Banking/Insurance
- 6.2.2. Healthcare
- 6.2.3. IT and Telecom
- 6.2.4. Government
- 6.2.5. Other End-user Industries
- 6.1. Market Analysis, Insights and Forecast - by Device
- 7. Europe Enterprise Mobility Security Industry Analysis, Insights and Forecast, 2019-2031
- 7.1. Market Analysis, Insights and Forecast - by Device
- 7.1.1. Smartphones
- 7.1.2. Laptops
- 7.1.3. Tablets
- 7.2. Market Analysis, Insights and Forecast - by End-User
- 7.2.1. Banking/Insurance
- 7.2.2. Healthcare
- 7.2.3. IT and Telecom
- 7.2.4. Government
- 7.2.5. Other End-user Industries
- 7.1. Market Analysis, Insights and Forecast - by Device
- 8. Asia Pacific Enterprise Mobility Security Industry Analysis, Insights and Forecast, 2019-2031
- 8.1. Market Analysis, Insights and Forecast - by Device
- 8.1.1. Smartphones
- 8.1.2. Laptops
- 8.1.3. Tablets
- 8.2. Market Analysis, Insights and Forecast - by End-User
- 8.2.1. Banking/Insurance
- 8.2.2. Healthcare
- 8.2.3. IT and Telecom
- 8.2.4. Government
- 8.2.5. Other End-user Industries
- 8.1. Market Analysis, Insights and Forecast - by Device
- 9. Latin America Enterprise Mobility Security Industry Analysis, Insights and Forecast, 2019-2031
- 9.1. Market Analysis, Insights and Forecast - by Device
- 9.1.1. Smartphones
- 9.1.2. Laptops
- 9.1.3. Tablets
- 9.2. Market Analysis, Insights and Forecast - by End-User
- 9.2.1. Banking/Insurance
- 9.2.2. Healthcare
- 9.2.3. IT and Telecom
- 9.2.4. Government
- 9.2.5. Other End-user Industries
- 9.1. Market Analysis, Insights and Forecast - by Device
- 10. Middle East and Africa Enterprise Mobility Security Industry Analysis, Insights and Forecast, 2019-2031
- 10.1. Market Analysis, Insights and Forecast - by Device
- 10.1.1. Smartphones
- 10.1.2. Laptops
- 10.1.3. Tablets
- 10.2. Market Analysis, Insights and Forecast - by End-User
- 10.2.1. Banking/Insurance
- 10.2.2. Healthcare
- 10.2.3. IT and Telecom
- 10.2.4. Government
- 10.2.5. Other End-user Industries
- 10.1. Market Analysis, Insights and Forecast - by Device
- 11. North America Enterprise Mobility Security Industry Analysis, Insights and Forecast, 2019-2031
- 11.1. Market Analysis, Insights and Forecast - By Country/Sub-region
- 11.1.1 United States
- 11.1.2 Canada
- 11.1.3 Mexico
- 12. Europe Enterprise Mobility Security Industry Analysis, Insights and Forecast, 2019-2031
- 12.1. Market Analysis, Insights and Forecast - By Country/Sub-region
- 12.1.1 Germany
- 12.1.2 United Kingdom
- 12.1.3 France
- 12.1.4 Spain
- 12.1.5 Italy
- 12.1.6 Spain
- 12.1.7 Belgium
- 12.1.8 Netherland
- 12.1.9 Nordics
- 12.1.10 Rest of Europe
- 13. Asia Pacific Enterprise Mobility Security Industry Analysis, Insights and Forecast, 2019-2031
- 13.1. Market Analysis, Insights and Forecast - By Country/Sub-region
- 13.1.1 China
- 13.1.2 Japan
- 13.1.3 India
- 13.1.4 South Korea
- 13.1.5 Southeast Asia
- 13.1.6 Australia
- 13.1.7 Indonesia
- 13.1.8 Phillipes
- 13.1.9 Singapore
- 13.1.10 Thailandc
- 13.1.11 Rest of Asia Pacific
- 14. South America Enterprise Mobility Security Industry Analysis, Insights and Forecast, 2019-2031
- 14.1. Market Analysis, Insights and Forecast - By Country/Sub-region
- 14.1.1 Brazil
- 14.1.2 Argentina
- 14.1.3 Peru
- 14.1.4 Chile
- 14.1.5 Colombia
- 14.1.6 Ecuador
- 14.1.7 Venezuela
- 14.1.8 Rest of South America
- 15. North America Enterprise Mobility Security Industry Analysis, Insights and Forecast, 2019-2031
- 15.1. Market Analysis, Insights and Forecast - By Country/Sub-region
- 15.1.1 United States
- 15.1.2 Canada
- 15.1.3 Mexico
- 16. MEA Enterprise Mobility Security Industry Analysis, Insights and Forecast, 2019-2031
- 16.1. Market Analysis, Insights and Forecast - By Country/Sub-region
- 16.1.1 United Arab Emirates
- 16.1.2 Saudi Arabia
- 16.1.3 South Africa
- 16.1.4 Rest of Middle East and Africa
- 17. Competitive Analysis
- 17.1. Global Market Share Analysis 2024
- 17.2. Company Profiles
- 17.2.1 Honeywell International Inc
- 17.2.1.1. Overview
- 17.2.1.2. Products
- 17.2.1.3. SWOT Analysis
- 17.2.1.4. Recent Developments
- 17.2.1.5. Financials (Based on Availability)
- 17.2.2 Blackberry Limited
- 17.2.2.1. Overview
- 17.2.2.2. Products
- 17.2.2.3. SWOT Analysis
- 17.2.2.4. Recent Developments
- 17.2.2.5. Financials (Based on Availability)
- 17.2.3 IBM Corporation
- 17.2.3.1. Overview
- 17.2.3.2. Products
- 17.2.3.3. SWOT Analysis
- 17.2.3.4. Recent Developments
- 17.2.3.5. Financials (Based on Availability)
- 17.2.4 McAfee LLC
- 17.2.4.1. Overview
- 17.2.4.2. Products
- 17.2.4.3. SWOT Analysis
- 17.2.4.4. Recent Developments
- 17.2.4.5. Financials (Based on Availability)
- 17.2.5 AirWatch
- 17.2.5.1. Overview
- 17.2.5.2. Products
- 17.2.5.3. SWOT Analysis
- 17.2.5.4. Recent Developments
- 17.2.5.5. Financials (Based on Availability)
- 17.2.6 Cisco Systems Inc
- 17.2.6.1. Overview
- 17.2.6.2. Products
- 17.2.6.3. SWOT Analysis
- 17.2.6.4. Recent Developments
- 17.2.6.5. Financials (Based on Availability)
- 17.2.7 Microsoft Corporation
- 17.2.7.1. Overview
- 17.2.7.2. Products
- 17.2.7.3. SWOT Analysis
- 17.2.7.4. Recent Developments
- 17.2.7.5. Financials (Based on Availability)
- 17.2.8 Oracle Corporation
- 17.2.8.1. Overview
- 17.2.8.2. Products
- 17.2.8.3. SWOT Analysis
- 17.2.8.4. Recent Developments
- 17.2.8.5. Financials (Based on Availability)
- 17.2.9 Symantec Corporation
- 17.2.9.1. Overview
- 17.2.9.2. Products
- 17.2.9.3. SWOT Analysis
- 17.2.9.4. Recent Developments
- 17.2.9.5. Financials (Based on Availability)
- 17.2.10 Citrix Systems Inc
- 17.2.10.1. Overview
- 17.2.10.2. Products
- 17.2.10.3. SWOT Analysis
- 17.2.10.4. Recent Developments
- 17.2.10.5. Financials (Based on Availability)
- 17.2.11 MobileIron
- 17.2.11.1. Overview
- 17.2.11.2. Products
- 17.2.11.3. SWOT Analysis
- 17.2.11.4. Recent Developments
- 17.2.11.5. Financials (Based on Availability)
- 17.2.12 SAP SE
- 17.2.12.1. Overview
- 17.2.12.2. Products
- 17.2.12.3. SWOT Analysis
- 17.2.12.4. Recent Developments
- 17.2.12.5. Financials (Based on Availability)
- 17.2.1 Honeywell International Inc
List of Figures
- Figure 1: Global Enterprise Mobility Security Industry Revenue Breakdown (Million, %) by Region 2024 & 2032
- Figure 2: North America Enterprise Mobility Security Industry Revenue (Million), by Country 2024 & 2032
- Figure 3: North America Enterprise Mobility Security Industry Revenue Share (%), by Country 2024 & 2032
- Figure 4: Europe Enterprise Mobility Security Industry Revenue (Million), by Country 2024 & 2032
- Figure 5: Europe Enterprise Mobility Security Industry Revenue Share (%), by Country 2024 & 2032
- Figure 6: Asia Pacific Enterprise Mobility Security Industry Revenue (Million), by Country 2024 & 2032
- Figure 7: Asia Pacific Enterprise Mobility Security Industry Revenue Share (%), by Country 2024 & 2032
- Figure 8: South America Enterprise Mobility Security Industry Revenue (Million), by Country 2024 & 2032
- Figure 9: South America Enterprise Mobility Security Industry Revenue Share (%), by Country 2024 & 2032
- Figure 10: North America Enterprise Mobility Security Industry Revenue (Million), by Country 2024 & 2032
- Figure 11: North America Enterprise Mobility Security Industry Revenue Share (%), by Country 2024 & 2032
- Figure 12: MEA Enterprise Mobility Security Industry Revenue (Million), by Country 2024 & 2032
- Figure 13: MEA Enterprise Mobility Security Industry Revenue Share (%), by Country 2024 & 2032
- Figure 14: North America Enterprise Mobility Security Industry Revenue (Million), by Device 2024 & 2032
- Figure 15: North America Enterprise Mobility Security Industry Revenue Share (%), by Device 2024 & 2032
- Figure 16: North America Enterprise Mobility Security Industry Revenue (Million), by End-User 2024 & 2032
- Figure 17: North America Enterprise Mobility Security Industry Revenue Share (%), by End-User 2024 & 2032
- Figure 18: North America Enterprise Mobility Security Industry Revenue (Million), by Country 2024 & 2032
- Figure 19: North America Enterprise Mobility Security Industry Revenue Share (%), by Country 2024 & 2032
- Figure 20: Europe Enterprise Mobility Security Industry Revenue (Million), by Device 2024 & 2032
- Figure 21: Europe Enterprise Mobility Security Industry Revenue Share (%), by Device 2024 & 2032
- Figure 22: Europe Enterprise Mobility Security Industry Revenue (Million), by End-User 2024 & 2032
- Figure 23: Europe Enterprise Mobility Security Industry Revenue Share (%), by End-User 2024 & 2032
- Figure 24: Europe Enterprise Mobility Security Industry Revenue (Million), by Country 2024 & 2032
- Figure 25: Europe Enterprise Mobility Security Industry Revenue Share (%), by Country 2024 & 2032
- Figure 26: Asia Pacific Enterprise Mobility Security Industry Revenue (Million), by Device 2024 & 2032
- Figure 27: Asia Pacific Enterprise Mobility Security Industry Revenue Share (%), by Device 2024 & 2032
- Figure 28: Asia Pacific Enterprise Mobility Security Industry Revenue (Million), by End-User 2024 & 2032
- Figure 29: Asia Pacific Enterprise Mobility Security Industry Revenue Share (%), by End-User 2024 & 2032
- Figure 30: Asia Pacific Enterprise Mobility Security Industry Revenue (Million), by Country 2024 & 2032
- Figure 31: Asia Pacific Enterprise Mobility Security Industry Revenue Share (%), by Country 2024 & 2032
- Figure 32: Latin America Enterprise Mobility Security Industry Revenue (Million), by Device 2024 & 2032
- Figure 33: Latin America Enterprise Mobility Security Industry Revenue Share (%), by Device 2024 & 2032
- Figure 34: Latin America Enterprise Mobility Security Industry Revenue (Million), by End-User 2024 & 2032
- Figure 35: Latin America Enterprise Mobility Security Industry Revenue Share (%), by End-User 2024 & 2032
- Figure 36: Latin America Enterprise Mobility Security Industry Revenue (Million), by Country 2024 & 2032
- Figure 37: Latin America Enterprise Mobility Security Industry Revenue Share (%), by Country 2024 & 2032
- Figure 38: Middle East and Africa Enterprise Mobility Security Industry Revenue (Million), by Device 2024 & 2032
- Figure 39: Middle East and Africa Enterprise Mobility Security Industry Revenue Share (%), by Device 2024 & 2032
- Figure 40: Middle East and Africa Enterprise Mobility Security Industry Revenue (Million), by End-User 2024 & 2032
- Figure 41: Middle East and Africa Enterprise Mobility Security Industry Revenue Share (%), by End-User 2024 & 2032
- Figure 42: Middle East and Africa Enterprise Mobility Security Industry Revenue (Million), by Country 2024 & 2032
- Figure 43: Middle East and Africa Enterprise Mobility Security Industry Revenue Share (%), by Country 2024 & 2032
List of Tables
- Table 1: Global Enterprise Mobility Security Industry Revenue Million Forecast, by Region 2019 & 2032
- Table 2: Global Enterprise Mobility Security Industry Revenue Million Forecast, by Device 2019 & 2032
- Table 3: Global Enterprise Mobility Security Industry Revenue Million Forecast, by End-User 2019 & 2032
- Table 4: Global Enterprise Mobility Security Industry Revenue Million Forecast, by Region 2019 & 2032
- Table 5: Global Enterprise Mobility Security Industry Revenue Million Forecast, by Country 2019 & 2032
- Table 6: United States Enterprise Mobility Security Industry Revenue (Million) Forecast, by Application 2019 & 2032
- Table 7: Canada Enterprise Mobility Security Industry Revenue (Million) Forecast, by Application 2019 & 2032
- Table 8: Mexico Enterprise Mobility Security Industry Revenue (Million) Forecast, by Application 2019 & 2032
- Table 9: Global Enterprise Mobility Security Industry Revenue Million Forecast, by Country 2019 & 2032
- Table 10: Germany Enterprise Mobility Security Industry Revenue (Million) Forecast, by Application 2019 & 2032
- Table 11: United Kingdom Enterprise Mobility Security Industry Revenue (Million) Forecast, by Application 2019 & 2032
- Table 12: France Enterprise Mobility Security Industry Revenue (Million) Forecast, by Application 2019 & 2032
- Table 13: Spain Enterprise Mobility Security Industry Revenue (Million) Forecast, by Application 2019 & 2032
- Table 14: Italy Enterprise Mobility Security Industry Revenue (Million) Forecast, by Application 2019 & 2032
- Table 15: Spain Enterprise Mobility Security Industry Revenue (Million) Forecast, by Application 2019 & 2032
- Table 16: Belgium Enterprise Mobility Security Industry Revenue (Million) Forecast, by Application 2019 & 2032
- Table 17: Netherland Enterprise Mobility Security Industry Revenue (Million) Forecast, by Application 2019 & 2032
- Table 18: Nordics Enterprise Mobility Security Industry Revenue (Million) Forecast, by Application 2019 & 2032
- Table 19: Rest of Europe Enterprise Mobility Security Industry Revenue (Million) Forecast, by Application 2019 & 2032
- Table 20: Global Enterprise Mobility Security Industry Revenue Million Forecast, by Country 2019 & 2032
- Table 21: China Enterprise Mobility Security Industry Revenue (Million) Forecast, by Application 2019 & 2032
- Table 22: Japan Enterprise Mobility Security Industry Revenue (Million) Forecast, by Application 2019 & 2032
- Table 23: India Enterprise Mobility Security Industry Revenue (Million) Forecast, by Application 2019 & 2032
- Table 24: South Korea Enterprise Mobility Security Industry Revenue (Million) Forecast, by Application 2019 & 2032
- Table 25: Southeast Asia Enterprise Mobility Security Industry Revenue (Million) Forecast, by Application 2019 & 2032
- Table 26: Australia Enterprise Mobility Security Industry Revenue (Million) Forecast, by Application 2019 & 2032
- Table 27: Indonesia Enterprise Mobility Security Industry Revenue (Million) Forecast, by Application 2019 & 2032
- Table 28: Phillipes Enterprise Mobility Security Industry Revenue (Million) Forecast, by Application 2019 & 2032
- Table 29: Singapore Enterprise Mobility Security Industry Revenue (Million) Forecast, by Application 2019 & 2032
- Table 30: Thailandc Enterprise Mobility Security Industry Revenue (Million) Forecast, by Application 2019 & 2032
- Table 31: Rest of Asia Pacific Enterprise Mobility Security Industry Revenue (Million) Forecast, by Application 2019 & 2032
- Table 32: Global Enterprise Mobility Security Industry Revenue Million Forecast, by Country 2019 & 2032
- Table 33: Brazil Enterprise Mobility Security Industry Revenue (Million) Forecast, by Application 2019 & 2032
- Table 34: Argentina Enterprise Mobility Security Industry Revenue (Million) Forecast, by Application 2019 & 2032
- Table 35: Peru Enterprise Mobility Security Industry Revenue (Million) Forecast, by Application 2019 & 2032
- Table 36: Chile Enterprise Mobility Security Industry Revenue (Million) Forecast, by Application 2019 & 2032
- Table 37: Colombia Enterprise Mobility Security Industry Revenue (Million) Forecast, by Application 2019 & 2032
- Table 38: Ecuador Enterprise Mobility Security Industry Revenue (Million) Forecast, by Application 2019 & 2032
- Table 39: Venezuela Enterprise Mobility Security Industry Revenue (Million) Forecast, by Application 2019 & 2032
- Table 40: Rest of South America Enterprise Mobility Security Industry Revenue (Million) Forecast, by Application 2019 & 2032
- Table 41: Global Enterprise Mobility Security Industry Revenue Million Forecast, by Country 2019 & 2032
- Table 42: United States Enterprise Mobility Security Industry Revenue (Million) Forecast, by Application 2019 & 2032
- Table 43: Canada Enterprise Mobility Security Industry Revenue (Million) Forecast, by Application 2019 & 2032
- Table 44: Mexico Enterprise Mobility Security Industry Revenue (Million) Forecast, by Application 2019 & 2032
- Table 45: Global Enterprise Mobility Security Industry Revenue Million Forecast, by Country 2019 & 2032
- Table 46: United Arab Emirates Enterprise Mobility Security Industry Revenue (Million) Forecast, by Application 2019 & 2032
- Table 47: Saudi Arabia Enterprise Mobility Security Industry Revenue (Million) Forecast, by Application 2019 & 2032
- Table 48: South Africa Enterprise Mobility Security Industry Revenue (Million) Forecast, by Application 2019 & 2032
- Table 49: Rest of Middle East and Africa Enterprise Mobility Security Industry Revenue (Million) Forecast, by Application 2019 & 2032
- Table 50: Global Enterprise Mobility Security Industry Revenue Million Forecast, by Device 2019 & 2032
- Table 51: Global Enterprise Mobility Security Industry Revenue Million Forecast, by End-User 2019 & 2032
- Table 52: Global Enterprise Mobility Security Industry Revenue Million Forecast, by Country 2019 & 2032
- Table 53: Global Enterprise Mobility Security Industry Revenue Million Forecast, by Device 2019 & 2032
- Table 54: Global Enterprise Mobility Security Industry Revenue Million Forecast, by End-User 2019 & 2032
- Table 55: Global Enterprise Mobility Security Industry Revenue Million Forecast, by Country 2019 & 2032
- Table 56: Global Enterprise Mobility Security Industry Revenue Million Forecast, by Device 2019 & 2032
- Table 57: Global Enterprise Mobility Security Industry Revenue Million Forecast, by End-User 2019 & 2032
- Table 58: Global Enterprise Mobility Security Industry Revenue Million Forecast, by Country 2019 & 2032
- Table 59: Global Enterprise Mobility Security Industry Revenue Million Forecast, by Device 2019 & 2032
- Table 60: Global Enterprise Mobility Security Industry Revenue Million Forecast, by End-User 2019 & 2032
- Table 61: Global Enterprise Mobility Security Industry Revenue Million Forecast, by Country 2019 & 2032
- Table 62: Global Enterprise Mobility Security Industry Revenue Million Forecast, by Device 2019 & 2032
- Table 63: Global Enterprise Mobility Security Industry Revenue Million Forecast, by End-User 2019 & 2032
- Table 64: Global Enterprise Mobility Security Industry Revenue Million Forecast, by Country 2019 & 2032
Frequently Asked Questions
1. What is the projected Compound Annual Growth Rate (CAGR) of the Enterprise Mobility Security Industry?
The projected CAGR is approximately 11.70%.
2. Which companies are prominent players in the Enterprise Mobility Security Industry?
Key companies in the market include Honeywell International Inc, Blackberry Limited, IBM Corporation, McAfee LLC, AirWatch, Cisco Systems Inc, Microsoft Corporation, Oracle Corporation, Symantec Corporation, Citrix Systems Inc, MobileIron, SAP SE.
3. What are the main segments of the Enterprise Mobility Security Industry?
The market segments include Device, End-User.
4. Can you provide details about the market size?
The market size is estimated to be USD 1.21 Million as of 2022.
5. What are some drivers contributing to market growth?
Industrial Internet of Things (IIoT) has Accelerated the Use-cases in the Market; Increasing Implementation of the BYOD Concept.
6. What are the notable trends driving market growth?
Banking/Insurance Industry to Hold Significant Market Share.
7. Are there any restraints impacting market growth?
Security Vulnerability for Manufacturing Vendors is Discouraging the Market Growth.; Government Regulations and Infrastructure Maintenance act as Market Challenges.
8. Can you provide examples of recent developments in the market?
October 2022: Mobliciti provides enterprise mobility, security, and wireless connectivity solutions. Kocho, a UK-based provider of managed services in cyber security, identity management, and cloud transition, acquired Mobliciti. By incorporating strategic mobile management and security capabilities, the partnership would enable Kocho's service offering and customers of both businesses to access a comprehensive lineup to accelerate the pace of their digital transformation activities.
9. What pricing options are available for accessing the report?
Pricing options include single-user, multi-user, and enterprise licenses priced at USD 4750, USD 5250, and USD 8750 respectively.
10. Is the market size provided in terms of value or volume?
The market size is provided in terms of value, measured in Million.
11. Are there any specific market keywords associated with the report?
Yes, the market keyword associated with the report is "Enterprise Mobility Security Industry," which aids in identifying and referencing the specific market segment covered.
12. How do I determine which pricing option suits my needs best?
The pricing options vary based on user requirements and access needs. Individual users may opt for single-user licenses, while businesses requiring broader access may choose multi-user or enterprise licenses for cost-effective access to the report.
13. Are there any additional resources or data provided in the Enterprise Mobility Security Industry report?
While the report offers comprehensive insights, it's advisable to review the specific contents or supplementary materials provided to ascertain if additional resources or data are available.
14. How can I stay updated on further developments or reports in the Enterprise Mobility Security Industry?
To stay informed about further developments, trends, and reports in the Enterprise Mobility Security Industry, consider subscribing to industry newsletters, following relevant companies and organizations, or regularly checking reputable industry news sources and publications.
Methodology
Step 1 - Identification of Relevant Samples Size from Population Database


Step 2 - Approaches for Defining Global Market Size (Value, Volume* & Price*)

Note*: In applicable scenarios
Step 3 - Data Sources
Primary Research
- Web Analytics
- Survey Reports
- Research Institute
- Latest Research Reports
- Opinion Leaders
Secondary Research
- Annual Reports
- White Paper
- Latest Press Release
- Industry Association
- Paid Database
- Investor Presentations

Step 4 - Data Triangulation
Involves using different sources of information in order to increase the validity of a study
These sources are likely to be stakeholders in a program - participants, other researchers, program staff, other community members, and so on.
Then we put all data in single framework & apply various statistical tools to find out the dynamic on the market.
During the analysis stage, feedback from the stakeholder groups would be compared to determine areas of agreement as well as areas of divergence


