

Key Insights
The European e-brokerage market is poised for significant expansion, driven by increasing digital adoption and evolving investment behaviors. With a projected Compound Annual Growth Rate (CAGR) of 9.4%, the market is estimated to reach $14.1 billion by 2024. This growth is propelled by widespread internet and mobile penetration across the continent, coupled with a burgeoning young, tech-savvy demographic actively engaging with online trading platforms. Enhanced accessibility to a diverse range of investment products and services via intuitive e-brokerage platforms is attracting a broader investor base, including millennials and Gen Z. Supportive regulatory frameworks designed to streamline investment processes and bolster investor protection are also contributing to this positive market trajectory. The competitive environment, characterized by both established leaders like Interactive Brokers, eToro, and Saxo Bank, and emerging innovators, fuels continuous innovation and market dynamism. Despite potential headwinds such as market volatility and cybersecurity risks, the outlook for the European e-brokerage sector remains robust, presenting substantial opportunities for growth and investment.
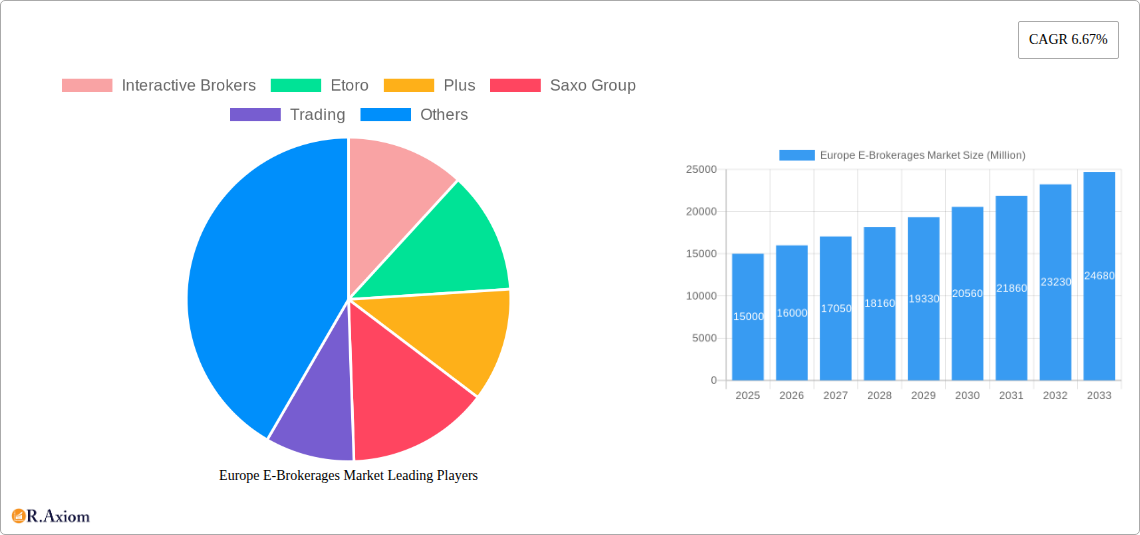
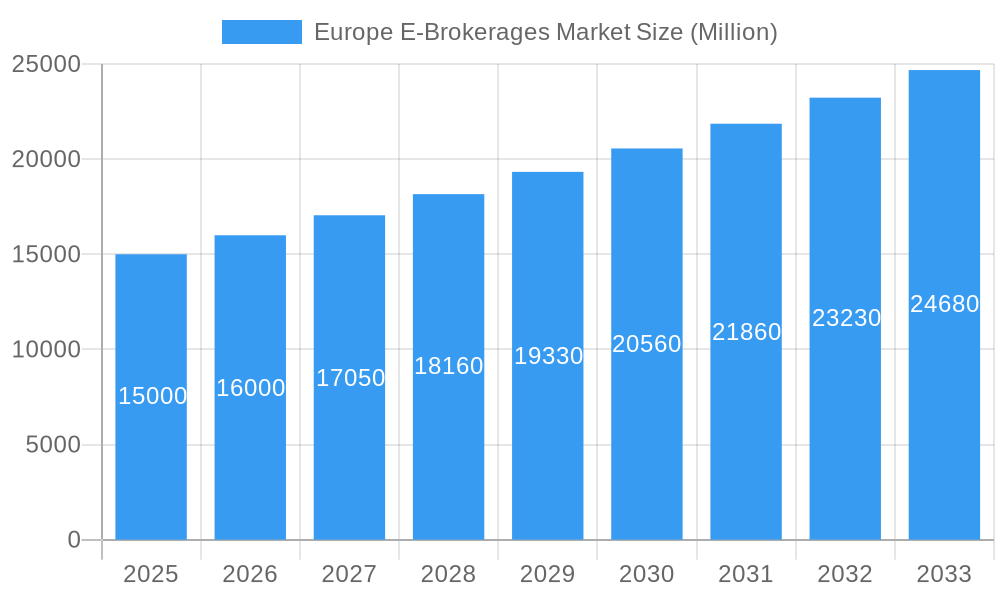
Europe E-Brokerages Market Market Size (In Billion)
Market segmentation highlights diverse engagement patterns across various demographics and investment strategies. Key players often dominate specific niches, underscoring the strategic importance of understanding target audience preferences and customizing offerings. Regional disparities within Europe are also critical; areas with higher financial literacy and technological advancement typically exhibit greater e-brokerage penetration. While precise segmentation figures are subject to specific data, a strong correlation is expected between regions with high per capita income and substantial adoption of online financial services, shaping European market share distribution. Ongoing advancements in technology, including AI-driven trading tools and sophisticated mobile applications, are set to further redefine the competitive landscape and stimulate future market growth.
Europe E-Brokerages Market Company Market Share
Europe E-Brokerages Market: A Comprehensive Report (2019-2033)
This in-depth report provides a comprehensive analysis of the Europe E-Brokerages Market, covering market size, growth drivers, challenges, key players, and future outlook. The study period spans from 2019 to 2033, with 2025 as the base and estimated year. The forecast period is 2025-2033, and the historical period is 2019-2024. This report is crucial for investors, industry stakeholders, and businesses seeking to understand and navigate this dynamic market.
Europe E-Brokerages Market Market Concentration & Innovation
This section analyzes the competitive landscape of the European e-brokerage market, exploring market concentration, innovation drivers, regulatory frameworks, and market dynamics. We delve into the impact of mergers and acquisitions (M&A) activities, examining deal values and their influence on market share. The report considers the influence of product substitutes, end-user trends, and the ever-evolving regulatory environment. Key metrics like market share for major players (Interactive Brokers, eToro, Plus500, Saxo Group, Degiro, etc.) are presented, along with an analysis of M&A deal values exceeding xx Million in the past five years. The highly fragmented nature of the market is examined, considering the presence of both large established players and numerous smaller niche brokers. The report also explores how technological innovations, such as AI-driven trading tools and improved mobile platforms, are driving market growth and shaping competitive dynamics. Regulatory changes impacting trading fees, leverage restrictions, and data privacy are analyzed for their impact on market concentration and profitability.
Europe E-Brokerages Market Industry Trends & Insights
This section provides a detailed analysis of the key trends and insights shaping the Europe E-Brokerages Market. We explore the factors driving market growth, including the increasing adoption of online trading platforms, rising retail investor participation, and technological advancements. The report examines the impact of technological disruptions, such as the rise of mobile trading apps and algorithmic trading, on the competitive landscape. Consumer preferences, including the demand for user-friendly platforms, advanced trading tools, and low-cost brokerage services are also analyzed. We quantify the market growth using CAGR (Compound Annual Growth Rate) projections for the forecast period and present data on market penetration rates across different segments. Competitive dynamics, including pricing strategies, product differentiation, and marketing initiatives employed by key players are thoroughly examined. The influence of macroeconomic factors, like interest rate changes and economic growth within Europe, on trading volumes and investor sentiment are assessed. The report concludes with a forecast of market size (in Millions) for the next decade.
Dominant Markets & Segments in Europe E-Brokerages Market
This section identifies the leading regions, countries, and segments within the European e-brokerage market. We analyze the factors contributing to the dominance of specific regions or segments, highlighting key drivers such as economic policies, infrastructure development, and investor demographics.
- Key Drivers in Dominant Markets:
- Stronger economic growth
- Higher levels of digital literacy and internet penetration
- Favorable regulatory environment
- Presence of significant financial centers
- Supportive government initiatives promoting fintech.
A detailed analysis of the dominant market is provided, exploring its market size (in Millions), growth trajectory, and the competitive intensity within that specific region or segment. The report examines market penetration in various countries, considering factors such as investor sophistication and access to financial technology.
Europe E-Brokerages Market Product Developments
This section summarizes recent product innovations in the European e-brokerage sector, highlighting technological advancements and competitive advantages. The discussion includes new trading platforms, mobile apps, algorithmic trading tools, and other product features catering to evolving investor needs. We analyze how these innovations are impacting market competition and customer acquisition. The focus is on technological trends, such as the integration of AI and machine learning, and how they contribute to improved trading experiences and enhanced market fit.
Report Scope & Segmentation Analysis
This report segments the Europe E-brokerages market based on various factors, including:
By Brokerage Type: Full-service brokers, discount brokers, mobile-first brokers, etc. Each segment's growth projection, market size (in Millions), and competitive dynamics are analyzed.
By Investor Type: Retail investors, institutional investors, high-net-worth individuals (HNWIs). Market size and growth forecasts for each segment are provided, along with a discussion of their unique needs and preferences.
By Product Offering: Stocks, bonds, options, futures, forex, ETFs, etc. The report assesses the popularity and growth of each product category.
By Geographic Location: A regional breakdown of the market, considering key European countries and their specific market dynamics.
Each segment's analysis includes projections for future growth, market size (in Millions), and competitive landscape.
Key Drivers of Europe E-Brokerages Market Growth
Several factors drive the growth of the Europe E-Brokerages Market:
Technological Advancements: Increased accessibility through mobile platforms and user-friendly interfaces. The adoption of AI and machine learning for algorithmic trading and personalized investment recommendations.
Economic Factors: Growing disposable incomes in several European countries resulting in increased participation in investment activities.
Regulatory Changes: Favorable regulatory environments in some European countries encouraging fintech innovation and attracting more investors.
These drivers are discussed in detail, showcasing their contribution to the market's expansion.
Challenges in the Europe E-Brokerages Market Sector
The Europe E-Brokerages Market faces several challenges:
Regulatory Hurdles: Strict regulations on trading activities and data privacy can increase operating costs and limit market expansion. This impact is quantified in terms of operational expenses or restrictions on services.
Cybersecurity Threats: The increasing reliance on digital platforms makes the industry vulnerable to cyberattacks, leading to potential financial losses and reputational damage.
Competitive Pressure: The intense competition among numerous e-brokerage firms necessitates continuous innovation and efficient cost management to maintain profitability.
These challenges are analyzed, quantifying their impact whenever possible.
Emerging Opportunities in Europe E-Brokerages Market
Emerging trends and opportunities include:
Growth of Fintech: The increasing integration of financial technology solutions is opening new avenues for innovation and market expansion.
Expansion into Underserved Markets: Targeting less-penetrated markets within Europe can provide significant growth potential.
Development of Niche Products: Creating specialized trading platforms or products to cater to specific investor needs can improve market share.
These opportunities are discussed in detail, emphasizing their potential for future growth.
Leading Players in the Europe E-Brokerages Market Market
- Interactive Brokers
- Etoro
- Plus500
- Saxo Group
- Trading 212
- Degiro
- Exante
- X-Trade Brokers
- Robinhood
- SwissQuote
- BUX
- Vanguard
- Capital Com
- Tradestation
- Freetrade
- Hargreaves Lansdown
- IC Markets
- Other Key Players (List Not Exhaustive)
Key Developments in Europe E-Brokerages Market Industry
February 2023: Interactive Brokers announced the launch of its new IBUSOPT order destination, aiming to improve price execution for options trades. This significantly enhances the platform's functionality for both retail and institutional clients, potentially increasing market share.
January 2023: eToro launched ValueGurus, a portfolio offering long-term exposure to value-investing strategies. This innovative product expands eToro's offerings and targets a niche market segment, potentially attracting new customers.
Strategic Outlook for Europe E-Brokerages Market Market
The Europe E-Brokerages Market is poised for continued growth, driven by technological innovation, increasing investor participation, and favorable regulatory environments in certain regions. Opportunities abound for companies that can adapt to evolving investor preferences, embrace fintech innovations, and effectively manage regulatory challenges. The market's future potential is significant, with considerable room for expansion in several European countries and across different investor segments. The report concludes with a positive outlook, highlighting the key catalysts for sustained market growth in the coming years.
Europe E-Brokerages Market Segmentation
-
1. Investor Type
- 1.1. Retail
- 1.2. Institutional
-
2. Services Offered
- 2.1. Full Time Brokers
- 2.2. Discount Brokers
-
3. Operation
- 3.1. Domestic
- 3.2. Foreign
Europe E-Brokerages Market Segmentation By Geography
- 1. Germany
- 2. United Kingdom
- 3. Russia
- 4. Spain
- 5. Netherlands
- 6. Denmark
- 7. Sweden
- 8. Finland
- 9. Norway
- 10. Rest of Europe
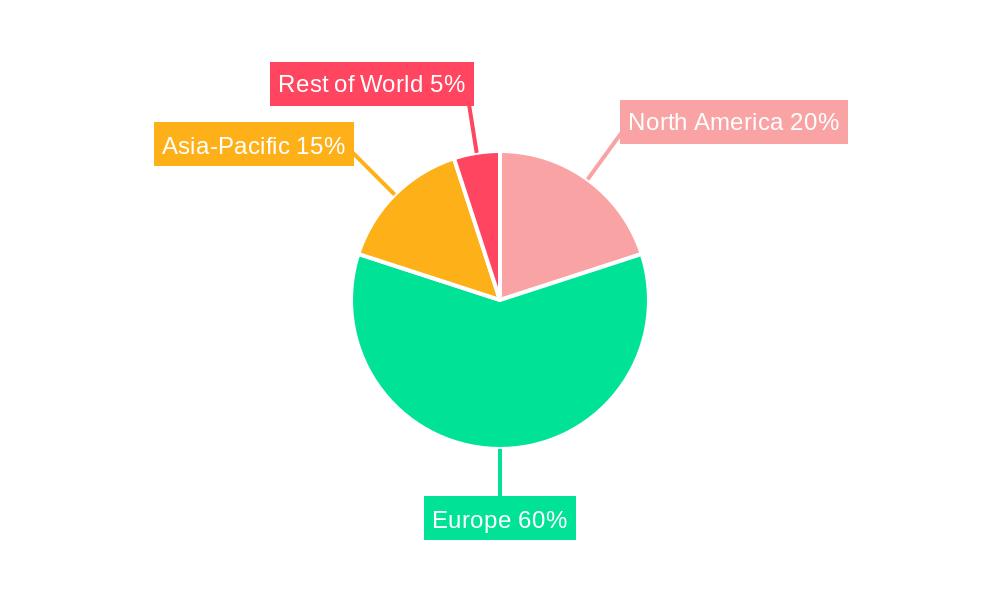
Europe E-Brokerages Market Regional Market Share
Geographic Coverage of Europe E-Brokerages Market
Europe E-Brokerages Market REPORT HIGHLIGHTS
| Aspects | Details |
|---|---|
| Study Period | 2020-2034 |
| Base Year | 2025 |
| Estimated Year | 2026 |
| Forecast Period | 2026-2034 |
| Historical Period | 2020-2025 |
| Growth Rate | CAGR of 9.4% from 2020-2034 |
| Segmentation |
|
Table of Contents
- 1. Introduction
- 1.1. Research Scope
- 1.2. Market Segmentation
- 1.3. Research Objective
- 1.4. Definitions and Assumptions
- 2. Executive Summary
- 2.1. Market Snapshot
- 3. Market Dynamics
- 3.1. Market Drivers
- 3.2. Market Restrains
- 3.3. Market Trends
- 3.4. Market Opportunities
- 4. Market Factor Analysis
- 4.1. Porters Five Forces
- 4.1.1. Bargaining Power of Suppliers
- 4.1.2. Bargaining Power of Buyers
- 4.1.3. Threat of New Entrants
- 4.1.4. Threat of Substitutes
- 4.1.5. Competitive Rivalry
- 4.2. PESTEL analysis
- 4.3. BCG Analysis
- 4.3.1. Stars (High Growth, High Market Share)
- 4.3.2. Cash Cows (Low Growth, High Market Share)
- 4.3.3. Question Mark (High Growth, Low Market Share)
- 4.3.4. Dogs (Low Growth, Low Market Share)
- 4.4. Ansoff Matrix Analysis
- 4.5. Supply Chain Analysis
- 4.6. Regulatory Landscape
- 4.7. Current Market Potential and Opportunity Assessment (TAM–SAM–SOM Framework)
- 4.8. RAX Analyst Note
- 4.1. Porters Five Forces
- 5. Market Analysis, Insights and Forecast 2021-2033
- 5.1. Market Analysis, Insights and Forecast - by Investor Type
- 5.1.1. Retail
- 5.1.2. Institutional
- 5.2. Market Analysis, Insights and Forecast - by Services Offered
- 5.2.1. Full Time Brokers
- 5.2.2. Discount Brokers
- 5.3. Market Analysis, Insights and Forecast - by Operation
- 5.3.1. Domestic
- 5.3.2. Foreign
- 5.4. Market Analysis, Insights and Forecast - by Region
- 5.4.1. Germany
- 5.4.2. United Kingdom
- 5.4.3. Russia
- 5.4.4. Spain
- 5.4.5. Netherlands
- 5.4.6. Denmark
- 5.4.7. Sweden
- 5.4.8. Finland
- 5.4.9. Norway
- 5.4.10. Rest of Europe
- 5.1. Market Analysis, Insights and Forecast - by Investor Type
- 6. Global Europe E-Brokerages Market Analysis, Insights and Forecast, 2021-2033
- 6.1. Market Analysis, Insights and Forecast - by Investor Type
- 6.1.1. Retail
- 6.1.2. Institutional
- 6.2. Market Analysis, Insights and Forecast - by Services Offered
- 6.2.1. Full Time Brokers
- 6.2.2. Discount Brokers
- 6.3. Market Analysis, Insights and Forecast - by Operation
- 6.3.1. Domestic
- 6.3.2. Foreign
- 6.1. Market Analysis, Insights and Forecast - by Investor Type
- 7. Germany Europe E-Brokerages Market Analysis, Insights and Forecast, 2020-2032
- 7.1. Market Analysis, Insights and Forecast - by Investor Type
- 7.1.1. Retail
- 7.1.2. Institutional
- 7.2. Market Analysis, Insights and Forecast - by Services Offered
- 7.2.1. Full Time Brokers
- 7.2.2. Discount Brokers
- 7.3. Market Analysis, Insights and Forecast - by Operation
- 7.3.1. Domestic
- 7.3.2. Foreign
- 7.1. Market Analysis, Insights and Forecast - by Investor Type
- 8. United Kingdom Europe E-Brokerages Market Analysis, Insights and Forecast, 2020-2032
- 8.1. Market Analysis, Insights and Forecast - by Investor Type
- 8.1.1. Retail
- 8.1.2. Institutional
- 8.2. Market Analysis, Insights and Forecast - by Services Offered
- 8.2.1. Full Time Brokers
- 8.2.2. Discount Brokers
- 8.3. Market Analysis, Insights and Forecast - by Operation
- 8.3.1. Domestic
- 8.3.2. Foreign
- 8.1. Market Analysis, Insights and Forecast - by Investor Type
- 9. Russia Europe E-Brokerages Market Analysis, Insights and Forecast, 2020-2032
- 9.1. Market Analysis, Insights and Forecast - by Investor Type
- 9.1.1. Retail
- 9.1.2. Institutional
- 9.2. Market Analysis, Insights and Forecast - by Services Offered
- 9.2.1. Full Time Brokers
- 9.2.2. Discount Brokers
- 9.3. Market Analysis, Insights and Forecast - by Operation
- 9.3.1. Domestic
- 9.3.2. Foreign
- 9.1. Market Analysis, Insights and Forecast - by Investor Type
- 10. Spain Europe E-Brokerages Market Analysis, Insights and Forecast, 2020-2032
- 10.1. Market Analysis, Insights and Forecast - by Investor Type
- 10.1.1. Retail
- 10.1.2. Institutional
- 10.2. Market Analysis, Insights and Forecast - by Services Offered
- 10.2.1. Full Time Brokers
- 10.2.2. Discount Brokers
- 10.3. Market Analysis, Insights and Forecast - by Operation
- 10.3.1. Domestic
- 10.3.2. Foreign
- 10.1. Market Analysis, Insights and Forecast - by Investor Type
- 11. Netherlands Europe E-Brokerages Market Analysis, Insights and Forecast, 2020-2032
- 11.1. Market Analysis, Insights and Forecast - by Investor Type
- 11.1.1. Retail
- 11.1.2. Institutional
- 11.2. Market Analysis, Insights and Forecast - by Services Offered
- 11.2.1. Full Time Brokers
- 11.2.2. Discount Brokers
- 11.3. Market Analysis, Insights and Forecast - by Operation
- 11.3.1. Domestic
- 11.3.2. Foreign
- 11.1. Market Analysis, Insights and Forecast - by Investor Type
- 12. Denmark Europe E-Brokerages Market Analysis, Insights and Forecast, 2020-2032
- 12.1. Market Analysis, Insights and Forecast - by Investor Type
- 12.1.1. Retail
- 12.1.2. Institutional
- 12.2. Market Analysis, Insights and Forecast - by Services Offered
- 12.2.1. Full Time Brokers
- 12.2.2. Discount Brokers
- 12.3. Market Analysis, Insights and Forecast - by Operation
- 12.3.1. Domestic
- 12.3.2. Foreign
- 12.1. Market Analysis, Insights and Forecast - by Investor Type
- 13. Sweden Europe E-Brokerages Market Analysis, Insights and Forecast, 2020-2032
- 13.1. Market Analysis, Insights and Forecast - by Investor Type
- 13.1.1. Retail
- 13.1.2. Institutional
- 13.2. Market Analysis, Insights and Forecast - by Services Offered
- 13.2.1. Full Time Brokers
- 13.2.2. Discount Brokers
- 13.3. Market Analysis, Insights and Forecast - by Operation
- 13.3.1. Domestic
- 13.3.2. Foreign
- 13.1. Market Analysis, Insights and Forecast - by Investor Type
- 14. Finland Europe E-Brokerages Market Analysis, Insights and Forecast, 2020-2032
- 14.1. Market Analysis, Insights and Forecast - by Investor Type
- 14.1.1. Retail
- 14.1.2. Institutional
- 14.2. Market Analysis, Insights and Forecast - by Services Offered
- 14.2.1. Full Time Brokers
- 14.2.2. Discount Brokers
- 14.3. Market Analysis, Insights and Forecast - by Operation
- 14.3.1. Domestic
- 14.3.2. Foreign
- 14.1. Market Analysis, Insights and Forecast - by Investor Type
- 15. Norway Europe E-Brokerages Market Analysis, Insights and Forecast, 2020-2032
- 15.1. Market Analysis, Insights and Forecast - by Investor Type
- 15.1.1. Retail
- 15.1.2. Institutional
- 15.2. Market Analysis, Insights and Forecast - by Services Offered
- 15.2.1. Full Time Brokers
- 15.2.2. Discount Brokers
- 15.3. Market Analysis, Insights and Forecast - by Operation
- 15.3.1. Domestic
- 15.3.2. Foreign
- 15.1. Market Analysis, Insights and Forecast - by Investor Type
- 16. Rest of Europe Europe E-Brokerages Market Analysis, Insights and Forecast, 2020-2032
- 16.1. Market Analysis, Insights and Forecast - by Investor Type
- 16.1.1. Retail
- 16.1.2. Institutional
- 16.2. Market Analysis, Insights and Forecast - by Services Offered
- 16.2.1. Full Time Brokers
- 16.2.2. Discount Brokers
- 16.3. Market Analysis, Insights and Forecast - by Operation
- 16.3.1. Domestic
- 16.3.2. Foreign
- 16.1. Market Analysis, Insights and Forecast - by Investor Type
- 17. Competitive Analysis
- 17.1. Company Profiles
- 17.1.1 Interactive Brokers
- 17.1.1.1. Company Overview
- 17.1.1.2. Products
- 17.1.1.3. Company Financials
- 17.1.1.4. SWOT Analysis
- 17.1.2 Etoro
- 17.1.2.1. Company Overview
- 17.1.2.2. Products
- 17.1.2.3. Company Financials
- 17.1.2.4. SWOT Analysis
- 17.1.3 Plus
- 17.1.3.1. Company Overview
- 17.1.3.2. Products
- 17.1.3.3. Company Financials
- 17.1.3.4. SWOT Analysis
- 17.1.4 Saxo Group
- 17.1.4.1. Company Overview
- 17.1.4.2. Products
- 17.1.4.3. Company Financials
- 17.1.4.4. SWOT Analysis
- 17.1.5 Trading
- 17.1.5.1. Company Overview
- 17.1.5.2. Products
- 17.1.5.3. Company Financials
- 17.1.5.4. SWOT Analysis
- 17.1.6 Degiro
- 17.1.6.1. Company Overview
- 17.1.6.2. Products
- 17.1.6.3. Company Financials
- 17.1.6.4. SWOT Analysis
- 17.1.7 Exante
- 17.1.7.1. Company Overview
- 17.1.7.2. Products
- 17.1.7.3. Company Financials
- 17.1.7.4. SWOT Analysis
- 17.1.8 X-Trade Brokers
- 17.1.8.1. Company Overview
- 17.1.8.2. Products
- 17.1.8.3. Company Financials
- 17.1.8.4. SWOT Analysis
- 17.1.9 Robinhood
- 17.1.9.1. Company Overview
- 17.1.9.2. Products
- 17.1.9.3. Company Financials
- 17.1.9.4. SWOT Analysis
- 17.1.10 SwissQuote
- 17.1.10.1. Company Overview
- 17.1.10.2. Products
- 17.1.10.3. Company Financials
- 17.1.10.4. SWOT Analysis
- 17.1.11 BUX
- 17.1.11.1. Company Overview
- 17.1.11.2. Products
- 17.1.11.3. Company Financials
- 17.1.11.4. SWOT Analysis
- 17.1.12 Vanguard
- 17.1.12.1. Company Overview
- 17.1.12.2. Products
- 17.1.12.3. Company Financials
- 17.1.12.4. SWOT Analysis
- 17.1.13 Capital Com
- 17.1.13.1. Company Overview
- 17.1.13.2. Products
- 17.1.13.3. Company Financials
- 17.1.13.4. SWOT Analysis
- 17.1.14 Tradestation
- 17.1.14.1. Company Overview
- 17.1.14.2. Products
- 17.1.14.3. Company Financials
- 17.1.14.4. SWOT Analysis
- 17.1.15 Freetrade
- 17.1.15.1. Company Overview
- 17.1.15.2. Products
- 17.1.15.3. Company Financials
- 17.1.15.4. SWOT Analysis
- 17.1.16 Hargreaves Lansdown
- 17.1.16.1. Company Overview
- 17.1.16.2. Products
- 17.1.16.3. Company Financials
- 17.1.16.4. SWOT Analysis
- 17.1.17 IC Market
- 17.1.17.1. Company Overview
- 17.1.17.2. Products
- 17.1.17.3. Company Financials
- 17.1.17.4. SWOT Analysis
- 17.1.18 Other Key Players**List Not Exhaustive
- 17.1.18.1. Company Overview
- 17.1.18.2. Products
- 17.1.18.3. Company Financials
- 17.1.18.4. SWOT Analysis
- 17.1.1 Interactive Brokers
- 17.2. Market Entropy
- 17.2.1 Company's Key Areas Served
- 17.2.2 Recent Developments
- 17.3. Company Market Share Analysis 2025
- 17.3.1 Top 5 Companies Market Share Analysis
- 17.3.2 Top 3 Companies Market Share Analysis
- 17.4. List of Potential Customers
- 18. Research Methodology
List of Figures
- Figure 1: Global Europe E-Brokerages Market Revenue Breakdown (billion, %) by Region 2025 & 2033
- Figure 2: Germany Europe E-Brokerages Market Revenue (billion), by Investor Type 2025 & 2033
- Figure 3: Germany Europe E-Brokerages Market Revenue Share (%), by Investor Type 2025 & 2033
- Figure 4: Germany Europe E-Brokerages Market Revenue (billion), by Services Offered 2025 & 2033
- Figure 5: Germany Europe E-Brokerages Market Revenue Share (%), by Services Offered 2025 & 2033
- Figure 6: Germany Europe E-Brokerages Market Revenue (billion), by Operation 2025 & 2033
- Figure 7: Germany Europe E-Brokerages Market Revenue Share (%), by Operation 2025 & 2033
- Figure 8: Germany Europe E-Brokerages Market Revenue (billion), by Country 2025 & 2033
- Figure 9: Germany Europe E-Brokerages Market Revenue Share (%), by Country 2025 & 2033
- Figure 10: United Kingdom Europe E-Brokerages Market Revenue (billion), by Investor Type 2025 & 2033
- Figure 11: United Kingdom Europe E-Brokerages Market Revenue Share (%), by Investor Type 2025 & 2033
- Figure 12: United Kingdom Europe E-Brokerages Market Revenue (billion), by Services Offered 2025 & 2033
- Figure 13: United Kingdom Europe E-Brokerages Market Revenue Share (%), by Services Offered 2025 & 2033
- Figure 14: United Kingdom Europe E-Brokerages Market Revenue (billion), by Operation 2025 & 2033
- Figure 15: United Kingdom Europe E-Brokerages Market Revenue Share (%), by Operation 2025 & 2033
- Figure 16: United Kingdom Europe E-Brokerages Market Revenue (billion), by Country 2025 & 2033
- Figure 17: United Kingdom Europe E-Brokerages Market Revenue Share (%), by Country 2025 & 2033
- Figure 18: Russia Europe E-Brokerages Market Revenue (billion), by Investor Type 2025 & 2033
- Figure 19: Russia Europe E-Brokerages Market Revenue Share (%), by Investor Type 2025 & 2033
- Figure 20: Russia Europe E-Brokerages Market Revenue (billion), by Services Offered 2025 & 2033
- Figure 21: Russia Europe E-Brokerages Market Revenue Share (%), by Services Offered 2025 & 2033
- Figure 22: Russia Europe E-Brokerages Market Revenue (billion), by Operation 2025 & 2033
- Figure 23: Russia Europe E-Brokerages Market Revenue Share (%), by Operation 2025 & 2033
- Figure 24: Russia Europe E-Brokerages Market Revenue (billion), by Country 2025 & 2033
- Figure 25: Russia Europe E-Brokerages Market Revenue Share (%), by Country 2025 & 2033
- Figure 26: Spain Europe E-Brokerages Market Revenue (billion), by Investor Type 2025 & 2033
- Figure 27: Spain Europe E-Brokerages Market Revenue Share (%), by Investor Type 2025 & 2033
- Figure 28: Spain Europe E-Brokerages Market Revenue (billion), by Services Offered 2025 & 2033
- Figure 29: Spain Europe E-Brokerages Market Revenue Share (%), by Services Offered 2025 & 2033
- Figure 30: Spain Europe E-Brokerages Market Revenue (billion), by Operation 2025 & 2033
- Figure 31: Spain Europe E-Brokerages Market Revenue Share (%), by Operation 2025 & 2033
- Figure 32: Spain Europe E-Brokerages Market Revenue (billion), by Country 2025 & 2033
- Figure 33: Spain Europe E-Brokerages Market Revenue Share (%), by Country 2025 & 2033
- Figure 34: Netherlands Europe E-Brokerages Market Revenue (billion), by Investor Type 2025 & 2033
- Figure 35: Netherlands Europe E-Brokerages Market Revenue Share (%), by Investor Type 2025 & 2033
- Figure 36: Netherlands Europe E-Brokerages Market Revenue (billion), by Services Offered 2025 & 2033
- Figure 37: Netherlands Europe E-Brokerages Market Revenue Share (%), by Services Offered 2025 & 2033
- Figure 38: Netherlands Europe E-Brokerages Market Revenue (billion), by Operation 2025 & 2033
- Figure 39: Netherlands Europe E-Brokerages Market Revenue Share (%), by Operation 2025 & 2033
- Figure 40: Netherlands Europe E-Brokerages Market Revenue (billion), by Country 2025 & 2033
- Figure 41: Netherlands Europe E-Brokerages Market Revenue Share (%), by Country 2025 & 2033
- Figure 42: Denmark Europe E-Brokerages Market Revenue (billion), by Investor Type 2025 & 2033
- Figure 43: Denmark Europe E-Brokerages Market Revenue Share (%), by Investor Type 2025 & 2033
- Figure 44: Denmark Europe E-Brokerages Market Revenue (billion), by Services Offered 2025 & 2033
- Figure 45: Denmark Europe E-Brokerages Market Revenue Share (%), by Services Offered 2025 & 2033
- Figure 46: Denmark Europe E-Brokerages Market Revenue (billion), by Operation 2025 & 2033
- Figure 47: Denmark Europe E-Brokerages Market Revenue Share (%), by Operation 2025 & 2033
- Figure 48: Denmark Europe E-Brokerages Market Revenue (billion), by Country 2025 & 2033
- Figure 49: Denmark Europe E-Brokerages Market Revenue Share (%), by Country 2025 & 2033
- Figure 50: Sweden Europe E-Brokerages Market Revenue (billion), by Investor Type 2025 & 2033
- Figure 51: Sweden Europe E-Brokerages Market Revenue Share (%), by Investor Type 2025 & 2033
- Figure 52: Sweden Europe E-Brokerages Market Revenue (billion), by Services Offered 2025 & 2033
- Figure 53: Sweden Europe E-Brokerages Market Revenue Share (%), by Services Offered 2025 & 2033
- Figure 54: Sweden Europe E-Brokerages Market Revenue (billion), by Operation 2025 & 2033
- Figure 55: Sweden Europe E-Brokerages Market Revenue Share (%), by Operation 2025 & 2033
- Figure 56: Sweden Europe E-Brokerages Market Revenue (billion), by Country 2025 & 2033
- Figure 57: Sweden Europe E-Brokerages Market Revenue Share (%), by Country 2025 & 2033
- Figure 58: Finland Europe E-Brokerages Market Revenue (billion), by Investor Type 2025 & 2033
- Figure 59: Finland Europe E-Brokerages Market Revenue Share (%), by Investor Type 2025 & 2033
- Figure 60: Finland Europe E-Brokerages Market Revenue (billion), by Services Offered 2025 & 2033
- Figure 61: Finland Europe E-Brokerages Market Revenue Share (%), by Services Offered 2025 & 2033
- Figure 62: Finland Europe E-Brokerages Market Revenue (billion), by Operation 2025 & 2033
- Figure 63: Finland Europe E-Brokerages Market Revenue Share (%), by Operation 2025 & 2033
- Figure 64: Finland Europe E-Brokerages Market Revenue (billion), by Country 2025 & 2033
- Figure 65: Finland Europe E-Brokerages Market Revenue Share (%), by Country 2025 & 2033
- Figure 66: Norway Europe E-Brokerages Market Revenue (billion), by Investor Type 2025 & 2033
- Figure 67: Norway Europe E-Brokerages Market Revenue Share (%), by Investor Type 2025 & 2033
- Figure 68: Norway Europe E-Brokerages Market Revenue (billion), by Services Offered 2025 & 2033
- Figure 69: Norway Europe E-Brokerages Market Revenue Share (%), by Services Offered 2025 & 2033
- Figure 70: Norway Europe E-Brokerages Market Revenue (billion), by Operation 2025 & 2033
- Figure 71: Norway Europe E-Brokerages Market Revenue Share (%), by Operation 2025 & 2033
- Figure 72: Norway Europe E-Brokerages Market Revenue (billion), by Country 2025 & 2033
- Figure 73: Norway Europe E-Brokerages Market Revenue Share (%), by Country 2025 & 2033
- Figure 74: Rest of Europe Europe E-Brokerages Market Revenue (billion), by Investor Type 2025 & 2033
- Figure 75: Rest of Europe Europe E-Brokerages Market Revenue Share (%), by Investor Type 2025 & 2033
- Figure 76: Rest of Europe Europe E-Brokerages Market Revenue (billion), by Services Offered 2025 & 2033
- Figure 77: Rest of Europe Europe E-Brokerages Market Revenue Share (%), by Services Offered 2025 & 2033
- Figure 78: Rest of Europe Europe E-Brokerages Market Revenue (billion), by Operation 2025 & 2033
- Figure 79: Rest of Europe Europe E-Brokerages Market Revenue Share (%), by Operation 2025 & 2033
- Figure 80: Rest of Europe Europe E-Brokerages Market Revenue (billion), by Country 2025 & 2033
- Figure 81: Rest of Europe Europe E-Brokerages Market Revenue Share (%), by Country 2025 & 2033
List of Tables
- Table 1: Global Europe E-Brokerages Market Revenue billion Forecast, by Investor Type 2020 & 2033
- Table 2: Global Europe E-Brokerages Market Revenue billion Forecast, by Services Offered 2020 & 2033
- Table 3: Global Europe E-Brokerages Market Revenue billion Forecast, by Operation 2020 & 2033
- Table 4: Global Europe E-Brokerages Market Revenue billion Forecast, by Region 2020 & 2033
- Table 5: Global Europe E-Brokerages Market Revenue billion Forecast, by Investor Type 2020 & 2033
- Table 6: Global Europe E-Brokerages Market Revenue billion Forecast, by Services Offered 2020 & 2033
- Table 7: Global Europe E-Brokerages Market Revenue billion Forecast, by Operation 2020 & 2033
- Table 8: Global Europe E-Brokerages Market Revenue billion Forecast, by Country 2020 & 2033
- Table 9: Global Europe E-Brokerages Market Revenue billion Forecast, by Investor Type 2020 & 2033
- Table 10: Global Europe E-Brokerages Market Revenue billion Forecast, by Services Offered 2020 & 2033
- Table 11: Global Europe E-Brokerages Market Revenue billion Forecast, by Operation 2020 & 2033
- Table 12: Global Europe E-Brokerages Market Revenue billion Forecast, by Country 2020 & 2033
- Table 13: Global Europe E-Brokerages Market Revenue billion Forecast, by Investor Type 2020 & 2033
- Table 14: Global Europe E-Brokerages Market Revenue billion Forecast, by Services Offered 2020 & 2033
- Table 15: Global Europe E-Brokerages Market Revenue billion Forecast, by Operation 2020 & 2033
- Table 16: Global Europe E-Brokerages Market Revenue billion Forecast, by Country 2020 & 2033
- Table 17: Global Europe E-Brokerages Market Revenue billion Forecast, by Investor Type 2020 & 2033
- Table 18: Global Europe E-Brokerages Market Revenue billion Forecast, by Services Offered 2020 & 2033
- Table 19: Global Europe E-Brokerages Market Revenue billion Forecast, by Operation 2020 & 2033
- Table 20: Global Europe E-Brokerages Market Revenue billion Forecast, by Country 2020 & 2033
- Table 21: Global Europe E-Brokerages Market Revenue billion Forecast, by Investor Type 2020 & 2033
- Table 22: Global Europe E-Brokerages Market Revenue billion Forecast, by Services Offered 2020 & 2033
- Table 23: Global Europe E-Brokerages Market Revenue billion Forecast, by Operation 2020 & 2033
- Table 24: Global Europe E-Brokerages Market Revenue billion Forecast, by Country 2020 & 2033
- Table 25: Global Europe E-Brokerages Market Revenue billion Forecast, by Investor Type 2020 & 2033
- Table 26: Global Europe E-Brokerages Market Revenue billion Forecast, by Services Offered 2020 & 2033
- Table 27: Global Europe E-Brokerages Market Revenue billion Forecast, by Operation 2020 & 2033
- Table 28: Global Europe E-Brokerages Market Revenue billion Forecast, by Country 2020 & 2033
- Table 29: Global Europe E-Brokerages Market Revenue billion Forecast, by Investor Type 2020 & 2033
- Table 30: Global Europe E-Brokerages Market Revenue billion Forecast, by Services Offered 2020 & 2033
- Table 31: Global Europe E-Brokerages Market Revenue billion Forecast, by Operation 2020 & 2033
- Table 32: Global Europe E-Brokerages Market Revenue billion Forecast, by Country 2020 & 2033
- Table 33: Global Europe E-Brokerages Market Revenue billion Forecast, by Investor Type 2020 & 2033
- Table 34: Global Europe E-Brokerages Market Revenue billion Forecast, by Services Offered 2020 & 2033
- Table 35: Global Europe E-Brokerages Market Revenue billion Forecast, by Operation 2020 & 2033
- Table 36: Global Europe E-Brokerages Market Revenue billion Forecast, by Country 2020 & 2033
- Table 37: Global Europe E-Brokerages Market Revenue billion Forecast, by Investor Type 2020 & 2033
- Table 38: Global Europe E-Brokerages Market Revenue billion Forecast, by Services Offered 2020 & 2033
- Table 39: Global Europe E-Brokerages Market Revenue billion Forecast, by Operation 2020 & 2033
- Table 40: Global Europe E-Brokerages Market Revenue billion Forecast, by Country 2020 & 2033
- Table 41: Global Europe E-Brokerages Market Revenue billion Forecast, by Investor Type 2020 & 2033
- Table 42: Global Europe E-Brokerages Market Revenue billion Forecast, by Services Offered 2020 & 2033
- Table 43: Global Europe E-Brokerages Market Revenue billion Forecast, by Operation 2020 & 2033
- Table 44: Global Europe E-Brokerages Market Revenue billion Forecast, by Country 2020 & 2033
Frequently Asked Questions
1. What is the projected Compound Annual Growth Rate (CAGR) of the Europe E-Brokerages Market?
The projected CAGR is approximately 9.4%.
2. Which companies are prominent players in the Europe E-Brokerages Market?
Key companies in the market include Interactive Brokers, Etoro, Plus, Saxo Group, Trading, Degiro, Exante, X-Trade Brokers, Robinhood, SwissQuote, BUX, Vanguard, Capital Com, Tradestation, Freetrade, Hargreaves Lansdown, IC Market, Other Key Players**List Not Exhaustive.
3. What are the main segments of the Europe E-Brokerages Market?
The market segments include Investor Type, Services Offered, Operation.
4. Can you provide details about the market size?
The market size is estimated to be USD 14.1 billion as of 2022.
5. What are some drivers contributing to market growth?
N/A
6. What are the notable trends driving market growth?
Growing Retail Investors in The Region is Driving The E-Brokerages Market.
7. Are there any restraints impacting market growth?
N/A
8. Can you provide examples of recent developments in the market?
February 2023: Interactive Brokers announced the launch of its new IBUSOPT order destination. With the dramatic increase in retail options trading, Interactive Brokers has launched this new order destination to help its retail and institutional clients achieve better price execution on their options trades.
9. What pricing options are available for accessing the report?
Pricing options include single-user, multi-user, and enterprise licenses priced at USD 4750, USD 5250, and USD 8750 respectively.
10. Is the market size provided in terms of value or volume?
The market size is provided in terms of value, measured in billion.
11. Are there any specific market keywords associated with the report?
Yes, the market keyword associated with the report is "Europe E-Brokerages Market," which aids in identifying and referencing the specific market segment covered.
12. How do I determine which pricing option suits my needs best?
The pricing options vary based on user requirements and access needs. Individual users may opt for single-user licenses, while businesses requiring broader access may choose multi-user or enterprise licenses for cost-effective access to the report.
13. Are there any additional resources or data provided in the Europe E-Brokerages Market report?
While the report offers comprehensive insights, it's advisable to review the specific contents or supplementary materials provided to ascertain if additional resources or data are available.
14. How can I stay updated on further developments or reports in the Europe E-Brokerages Market?
To stay informed about further developments, trends, and reports in the Europe E-Brokerages Market, consider subscribing to industry newsletters, following relevant companies and organizations, or regularly checking reputable industry news sources and publications.
Methodology
Step 1 - Identification of Relevant Samples Size from Population Database


Step 2 - Approaches for Defining Global Market Size (Value, Volume* & Price*)

Note*: In applicable scenarios
Step 3 - Data Sources
Primary Research
- Web Analytics
- Survey Reports
- Research Institute
- Latest Research Reports
- Opinion Leaders
Secondary Research
- Annual Reports
- White Paper
- Latest Press Release
- Industry Association
- Paid Database
- Investor Presentations

Step 4 - Data Triangulation
Involves using different sources of information in order to increase the validity of a study
These sources are likely to be stakeholders in a program - participants, other researchers, program staff, other community members, and so on.
Then we put all data in single framework & apply various statistical tools to find out the dynamic on the market.
During the analysis stage, feedback from the stakeholder groups would be compared to determine areas of agreement as well as areas of divergence