
Key Insights
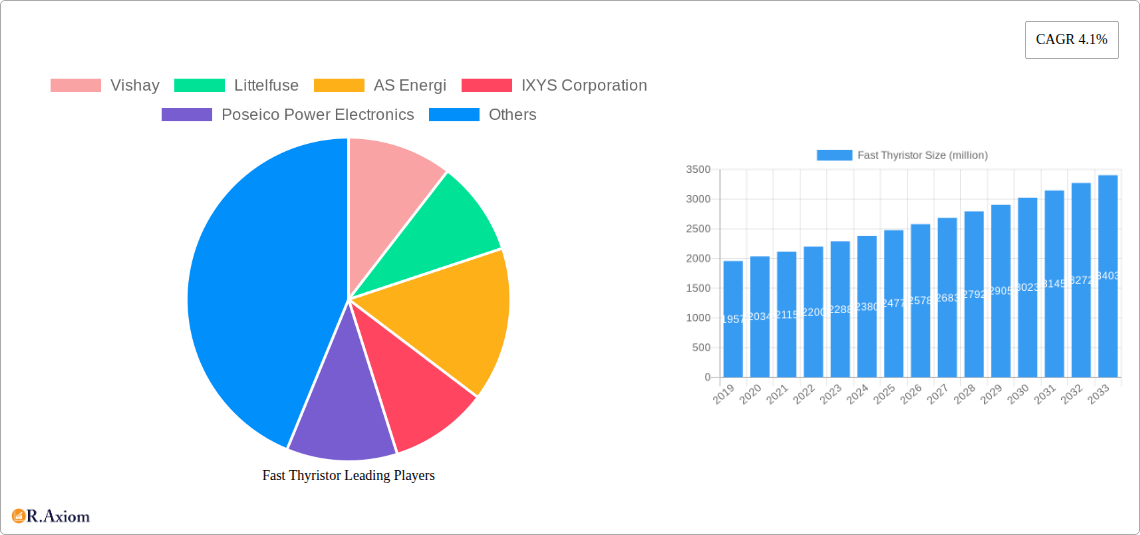
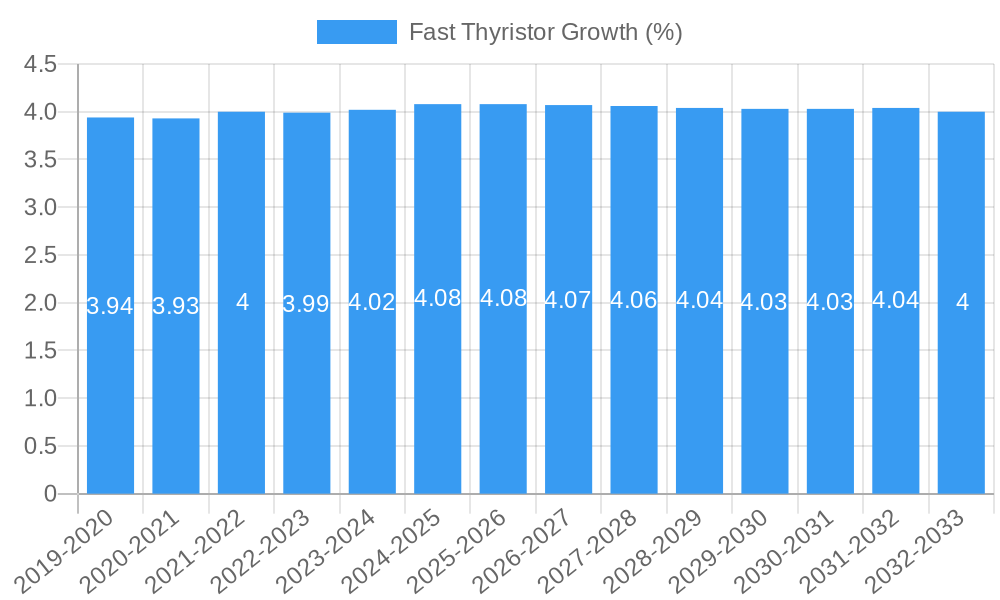
The global Fast Thyristor market is poised for robust expansion, demonstrating a healthy Compound Annual Growth Rate (CAGR) of 4.1% from its estimated base year of 2025. Building upon a market size of approximately $1957 million in 2019, the industry is projected to reach significant new heights by 2033. This growth is primarily propelled by the escalating demand for efficient power control solutions across various industrial sectors, particularly in renewable energy integration, electric vehicle charging infrastructure, and advanced industrial automation. The inherent capabilities of fast thyristors in high-speed switching applications make them indispensable components in inverters for solar and wind power systems, motor drives, and uninterruptible power supplies (UPS). Furthermore, the ongoing miniaturization and increased power handling capabilities of these devices are fueling their adoption in next-generation electronic equipment.
While the market exhibits strong upward momentum, certain factors could influence its trajectory. The development of more advanced semiconductor technologies, such as Silicon Carbide (SiC) and Gallium Nitride (GaN) devices, while offering superior performance, also presents a competitive landscape and potential long-term substitute for traditional silicon-based fast thyristors. Additionally, stringent regulatory requirements and the need for high-reliability components in critical applications necessitate continuous innovation and adherence to quality standards. Key players like Vishay, Littelfuse, and IXYS Corporation are actively investing in research and development to introduce enhanced products and cater to evolving market demands, particularly within the Inverter and Chopper segments, which are expected to dominate application-wise. The Stud Type segment is likely to see significant traction due to its ease of integration and robust performance in demanding environments.
Fast Thyristor Market Concentration & Innovation
The fast thyristor market is characterized by a moderate level of concentration, with a few key players dominating a significant portion of the global market share. Companies such as Vishay, Littelfuse, IXYS Corporation, and Poseico Power Electronics are recognized for their extensive product portfolios and established distribution networks. The innovation landscape is driven by the increasing demand for higher switching speeds, improved efficiency, and enhanced power density in electronic power systems. Regulatory frameworks, particularly those concerning energy efficiency and industrial safety standards, play a crucial role in shaping product development and market entry. For instance, stringent environmental regulations in regions like Europe are pushing manufacturers to develop more energy-efficient thyristor solutions.
Product substitutes, such as IGBTs (Insulated Gate Bipolar Transistors) and MOSFETs (Metal-Oxide-Semiconductor Field-Effect Transistors), offer alternative solutions for certain power switching applications. However, fast thyristors continue to hold a competitive edge in high-voltage, high-current applications where their robustness and cost-effectiveness are paramount. End-user trends are largely influenced by the growth of industries like renewable energy, electric vehicles, and industrial automation. For example, the burgeoning electric vehicle market is a significant driver for advanced power semiconductor devices, including fast thyristors used in EV inverters and chargers. Mergers and acquisitions (M&A) activities, while not as prevalent as in more mature semiconductor sectors, are strategic moves aimed at consolidating market share, acquiring innovative technologies, and expanding geographical reach. Recent M&A deals in the broader power semiconductor space, with reported values in the range of several hundred million to over a billion dollars, indicate a strategic consolidation trend that could extend to the fast thyristor segment.
Fast Thyristor Industry Trends & Insights
The fast thyristor industry is poised for substantial growth, projected to expand at a Compound Annual Growth Rate (CAGR) of approximately 6.5% over the forecast period of 2025–2033. This robust growth is underpinned by a confluence of technological advancements, evolving industrial demands, and expanding application frontiers. The historical period from 2019–2024 witnessed steady adoption of fast thyristors, driven by initial investments in renewable energy infrastructure and the increasing electrification of transportation. The base year of 2025 represents a critical inflection point, with anticipated acceleration in market penetration across key sectors.
Technological disruptions are continuously redefining the capabilities of fast thyristors. Innovations in semiconductor materials, such as Silicon Carbide (SiC) and Gallium Nitride (GaN), while currently more prominent in other power semiconductor devices, are influencing research and development for next-generation thyristors, aiming for even faster switching speeds and higher efficiency. The integration of advanced packaging techniques, including press-pack technology and intelligent modules, enhances thermal management and reliability, crucial for demanding industrial applications. Consumer preferences, indirectly, play a role by driving demand for more energy-efficient and sustainable products, which in turn spurs the adoption of advanced power electronics components like fast thyristors in appliances, renewable energy systems, and electric vehicles. The competitive dynamics within the fast thyristor market are shaped by factors such as product performance, price competitiveness, supply chain reliability, and the ability to offer customized solutions. Key market players are investing heavily in research and development to maintain a competitive edge.
The penetration of fast thyristors in emerging applications, such as grid-connected renewable energy systems (solar and wind power inverters), electric vehicle charging infrastructure, and high-speed trains, is expected to surge. The demand for efficient power conversion and control in these sectors directly translates into increased market adoption for fast thyristors. Furthermore, the ongoing digital transformation across industries is leading to greater automation and the use of advanced control systems, where fast and reliable power switching is essential. This trend is expected to create sustained demand for these critical components. The market penetration of fast thyristors is currently estimated at around 25% in key industrial applications, with projections to reach over 40% by 2033. The increasing complexity of power grids and the need for grid stabilization further enhance the demand for high-performance thyristor solutions.
Dominant Markets & Segments in Fast Thyristor
The fast thyristor market is segmented by application and type, with significant regional variations in dominance. In terms of application, the Inverter segment is currently the largest and is projected to maintain its leading position throughout the forecast period. This dominance is primarily driven by the exponential growth in renewable energy installations, particularly solar and wind power, where inverters are crucial for converting DC power to AC power. The expanding electric vehicle market also significantly contributes to the demand for inverters used in vehicle powertrains and charging stations. Economic policies that promote renewable energy adoption, such as tax incentives and feed-in tariffs, are key drivers in regions like North America and Europe, bolstering the inverter segment. Infrastructure development, especially the expansion of charging networks for electric vehicles, further solidifies the inverter's market leadership.
The Chopper application segment, while smaller than inverters, is experiencing robust growth, fueled by its widespread use in industrial motor drives, electric forklifts, and power supplies. The increasing industrial automation and the need for efficient speed control in electric motors are key drivers for this segment. Furthermore, advancements in chopper circuit designs are enabling higher efficiency and power handling capabilities, making them more attractive for a wider range of applications. The "Others" application segment, encompassing diverse uses like welding equipment, UPS systems, and high-power industrial furnaces, also contributes steadily to market growth, driven by the general expansion of industrial manufacturing globally.
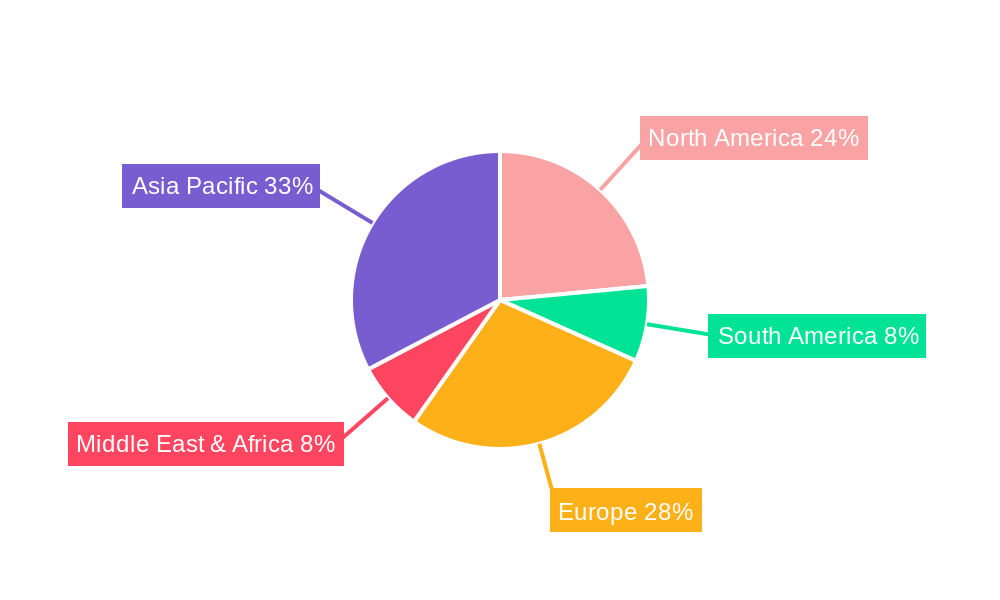
Geographically, Asia Pacific is the dominant region in the fast thyristor market. This dominance is attributed to the region's strong manufacturing base, rapid industrialization, and significant investments in renewable energy projects. Countries like China are leading the charge, not only as major consumers but also as significant producers of fast thyristors. Favorable government policies, a large domestic market, and the presence of key manufacturing hubs contribute to Asia Pacific's leading position. The Stud Type thyristor segment holds a substantial market share due to its established reliability and cost-effectiveness in a wide array of industrial applications. Its ease of mounting and robust construction make it a preferred choice for many power electronic designs. However, the Capsule Type thyristor is gaining traction, particularly in high-performance applications where space constraints and higher efficiency are critical. Innovations in capsule packaging are enhancing their thermal performance and reliability, making them competitive in more demanding scenarios.
Fast Thyristor Product Developments
Recent fast thyristor product developments focus on enhancing switching speed, reducing conduction losses, and improving thermal management. Manufacturers are introducing new generations of thyristors with improved performance characteristics, targeting applications that demand higher efficiency and compactness. For instance, advancements in semiconductor doping profiles and junction isolation techniques are leading to devices capable of switching at higher frequencies with lower energy dissipation. Novel packaging solutions, including advanced press-pack designs and integrated cooling systems, are also being developed to handle increased power densities and ensure long-term reliability. These product innovations are crucial for meeting the evolving demands of industries such as electric vehicles, renewable energy, and industrial automation, where optimizing power conversion is paramount for efficiency and performance.
Report Scope & Segmentation Analysis
This report provides a comprehensive analysis of the fast thyristor market, segmented by application and type. The Application segment includes Inverter, Chopper, and Others. The Inverter segment is expected to exhibit a significant CAGR of approximately 7.0% over the forecast period, driven by renewable energy and EV adoption, with a projected market size of over $1.5 billion by 2033. The Chopper segment is anticipated to grow at a CAGR of around 6.0%, fueled by industrial automation, reaching an estimated market size of over $800 million. The Others segment, encompassing a wide range of industrial uses, is projected to grow at a CAGR of 5.5%, with a market size projected to exceed $600 million.
The Type segment comprises Capsule Type and Stud Type thyristors. The Stud Type segment, currently dominant, is expected to witness a CAGR of around 5.8%, with its market size projected to reach over $2 billion by 2033, owing to its broad industrial applicability. The Capsule Type segment, while smaller, is projected for robust growth at a CAGR of approximately 7.5%, driven by its adoption in high-performance and space-constrained applications, with a forecast market size of over $1.7 billion. Competitive dynamics within each segment are influenced by product innovation, pricing strategies, and the ability to cater to specific end-user requirements.
Key Drivers of Fast Thyristor Growth
The growth of the fast thyristor market is primarily propelled by several key factors. Firstly, the escalating global demand for renewable energy sources, such as solar and wind power, necessitates efficient inverters and power conditioning systems, where fast thyristors play a crucial role. Secondly, the rapid expansion of the electric vehicle (EV) sector, with increasing adoption of EVs for both personal and commercial use, drives demand for high-performance power electronics, including fast thyristors used in EV chargers and powertrains. Thirdly, the ongoing trend of industrial automation and electrification across various manufacturing sectors requires sophisticated power control and conversion solutions, directly benefiting the fast thyristor market. Finally, government initiatives and favorable policies promoting energy efficiency and sustainable technologies further incentivize the adoption of advanced power semiconductor devices, including fast thyristors.
Challenges in the Fast Thyristor Sector
Despite the positive growth trajectory, the fast thyristor sector faces several challenges. One significant barrier is the increasing competition from alternative semiconductor technologies like IGBTs and MOSFETs, which offer comparable or superior performance in certain applications, particularly at lower to medium voltage levels. Supply chain disruptions and raw material price volatility, exacerbated by geopolitical factors and global economic uncertainties, can impact production costs and lead times, potentially hindering market expansion. Furthermore, stringent regulatory compliance requirements, especially concerning environmental standards and safety certifications in different regions, can add to the complexity and cost of product development and market entry. The need for specialized manufacturing expertise and capital investment for high-performance fast thyristors also presents a hurdle for new entrants.
Emerging Opportunities in Fast Thyristor
Emerging opportunities in the fast thyristor market are closely tied to technological advancements and evolving industrial needs. The development of advanced materials like Silicon Carbide (SiC) and Gallium Nitride (GaN) for power electronics, while currently more prevalent in other devices, presents a long-term opportunity for next-generation fast thyristors with even higher efficiency and switching speeds. The expanding use of smart grid technologies and energy storage systems offers new avenues for fast thyristors in grid stabilization and power management applications. Furthermore, the growing demand for electric mobility, beyond passenger cars to include heavy-duty vehicles and electric aviation, will create significant opportunities for high-power, high-reliability fast thyristor solutions. The increasing focus on industrial IoT (Internet of Things) and the need for efficient power control in connected devices also represent a burgeoning market segment.
Leading Players in the Fast Thyristor Market
- Vishay
- Littelfuse
- AS Energi
- IXYS Corporation
- Poseico Power Electronics
- Jiangsu Runau Electronics Manufacturing Co.,Ltd
- SAILING TECH
- Tianjin Rosen Technology Co.,Ltd
- PANHAO
Key Developments in Fast Thyristor Industry
- 2023: Introduction of enhanced high-power fast thyristor modules by Vishay, offering improved thermal performance and reliability for industrial applications.
- 2023: Littelfuse expands its portfolio with new series of fast-switching thyristors optimized for electric vehicle charging infrastructure.
- 2022: IXYS Corporation launches a new generation of fast thyristors with reduced switching losses, targeting high-frequency inverter designs.
- 2022: Poseico Power Electronics announces strategic partnerships to enhance its manufacturing capacity for high-voltage fast thyristors.
- 2021: SAILING TECH introduces advanced packaging technologies for fast thyristors, enabling higher power density and improved heat dissipation.
- 2021: Jiangsu Runau Electronics Manufacturing Co.,Ltd invests in R&D for next-generation fast thyristors using advanced semiconductor materials.
Strategic Outlook for Fast Thyristor Market
The strategic outlook for the fast thyristor market is characterized by sustained growth driven by global megatrends in electrification and sustainability. The increasing integration of renewable energy sources and the burgeoning electric vehicle market will continue to be the primary growth catalysts. Strategic focus for market players will involve investing in research and development to enhance device performance, particularly in terms of switching speed, efficiency, and power density. Furthermore, companies will need to strengthen their supply chain resilience and explore opportunities for technological collaboration or strategic acquisitions to maintain a competitive edge. The development of thyristors utilizing advanced semiconductor materials and intelligent packaging solutions will be crucial for capturing future market share in high-performance applications. Expansion into emerging geographical markets and diversification of product offerings to cater to a wider range of industrial applications will also be key strategic imperatives.
Fast Thyristor Segmentation
-
1. Application
- 1.1. Inverter
- 1.2. Chopper
- 1.3. Others
-
2. Type
- 2.1. Capsule Type
- 2.2. Stud Type
Fast Thyristor Segmentation By Geography
-
1. North America
- 1.1. United States
- 1.2. Canada
- 1.3. Mexico
-
2. South America
- 2.1. Brazil
- 2.2. Argentina
- 2.3. Rest of South America
-
3. Europe
- 3.1. United Kingdom
- 3.2. Germany
- 3.3. France
- 3.4. Italy
- 3.5. Spain
- 3.6. Russia
- 3.7. Benelux
- 3.8. Nordics
- 3.9. Rest of Europe
-
4. Middle East & Africa
- 4.1. Turkey
- 4.2. Israel
- 4.3. GCC
- 4.4. North Africa
- 4.5. South Africa
- 4.6. Rest of Middle East & Africa
-
5. Asia Pacific
- 5.1. China
- 5.2. India
- 5.3. Japan
- 5.4. South Korea
- 5.5. ASEAN
- 5.6. Oceania
- 5.7. Rest of Asia Pacific
Fast Thyristor REPORT HIGHLIGHTS
| Aspects | Details |
|---|---|
| Study Period | 2019-2033 |
| Base Year | 2024 |
| Estimated Year | 2025 |
| Forecast Period | 2025-2033 |
| Historical Period | 2019-2024 |
| Growth Rate | CAGR of 4.1% from 2019-2033 |
| Segmentation |
|
Table of Contents
- 1. Introduction
- 1.1. Research Scope
- 1.2. Market Segmentation
- 1.3. Research Methodology
- 1.4. Definitions and Assumptions
- 2. Executive Summary
- 2.1. Introduction
- 3. Market Dynamics
- 3.1. Introduction
- 3.2. Market Drivers
- 3.3. Market Restrains
- 3.4. Market Trends
- 4. Market Factor Analysis
- 4.1. Porters Five Forces
- 4.2. Supply/Value Chain
- 4.3. PESTEL analysis
- 4.4. Market Entropy
- 4.5. Patent/Trademark Analysis
- 5. Global Fast Thyristor Analysis, Insights and Forecast, 2019-2031
- 5.1. Market Analysis, Insights and Forecast - by Application
- 5.1.1. Inverter
- 5.1.2. Chopper
- 5.1.3. Others
- 5.2. Market Analysis, Insights and Forecast - by Type
- 5.2.1. Capsule Type
- 5.2.2. Stud Type
- 5.3. Market Analysis, Insights and Forecast - by Region
- 5.3.1. North America
- 5.3.2. South America
- 5.3.3. Europe
- 5.3.4. Middle East & Africa
- 5.3.5. Asia Pacific
- 5.1. Market Analysis, Insights and Forecast - by Application
- 6. North America Fast Thyristor Analysis, Insights and Forecast, 2019-2031
- 6.1. Market Analysis, Insights and Forecast - by Application
- 6.1.1. Inverter
- 6.1.2. Chopper
- 6.1.3. Others
- 6.2. Market Analysis, Insights and Forecast - by Type
- 6.2.1. Capsule Type
- 6.2.2. Stud Type
- 6.1. Market Analysis, Insights and Forecast - by Application
- 7. South America Fast Thyristor Analysis, Insights and Forecast, 2019-2031
- 7.1. Market Analysis, Insights and Forecast - by Application
- 7.1.1. Inverter
- 7.1.2. Chopper
- 7.1.3. Others
- 7.2. Market Analysis, Insights and Forecast - by Type
- 7.2.1. Capsule Type
- 7.2.2. Stud Type
- 7.1. Market Analysis, Insights and Forecast - by Application
- 8. Europe Fast Thyristor Analysis, Insights and Forecast, 2019-2031
- 8.1. Market Analysis, Insights and Forecast - by Application
- 8.1.1. Inverter
- 8.1.2. Chopper
- 8.1.3. Others
- 8.2. Market Analysis, Insights and Forecast - by Type
- 8.2.1. Capsule Type
- 8.2.2. Stud Type
- 8.1. Market Analysis, Insights and Forecast - by Application
- 9. Middle East & Africa Fast Thyristor Analysis, Insights and Forecast, 2019-2031
- 9.1. Market Analysis, Insights and Forecast - by Application
- 9.1.1. Inverter
- 9.1.2. Chopper
- 9.1.3. Others
- 9.2. Market Analysis, Insights and Forecast - by Type
- 9.2.1. Capsule Type
- 9.2.2. Stud Type
- 9.1. Market Analysis, Insights and Forecast - by Application
- 10. Asia Pacific Fast Thyristor Analysis, Insights and Forecast, 2019-2031
- 10.1. Market Analysis, Insights and Forecast - by Application
- 10.1.1. Inverter
- 10.1.2. Chopper
- 10.1.3. Others
- 10.2. Market Analysis, Insights and Forecast - by Type
- 10.2.1. Capsule Type
- 10.2.2. Stud Type
- 10.1. Market Analysis, Insights and Forecast - by Application
- 11. Competitive Analysis
- 11.1. Global Market Share Analysis 2024
- 11.2. Company Profiles
- 11.2.1 Vishay
- 11.2.1.1. Overview
- 11.2.1.2. Products
- 11.2.1.3. SWOT Analysis
- 11.2.1.4. Recent Developments
- 11.2.1.5. Financials (Based on Availability)
- 11.2.2 Littelfuse
- 11.2.2.1. Overview
- 11.2.2.2. Products
- 11.2.2.3. SWOT Analysis
- 11.2.2.4. Recent Developments
- 11.2.2.5. Financials (Based on Availability)
- 11.2.3 AS Energi
- 11.2.3.1. Overview
- 11.2.3.2. Products
- 11.2.3.3. SWOT Analysis
- 11.2.3.4. Recent Developments
- 11.2.3.5. Financials (Based on Availability)
- 11.2.4 IXYS Corporation
- 11.2.4.1. Overview
- 11.2.4.2. Products
- 11.2.4.3. SWOT Analysis
- 11.2.4.4. Recent Developments
- 11.2.4.5. Financials (Based on Availability)
- 11.2.5 Poseico Power Electronics
- 11.2.5.1. Overview
- 11.2.5.2. Products
- 11.2.5.3. SWOT Analysis
- 11.2.5.4. Recent Developments
- 11.2.5.5. Financials (Based on Availability)
- 11.2.6 Jiangsu Runau Electronics Manufacturing Co.Ltd
- 11.2.6.1. Overview
- 11.2.6.2. Products
- 11.2.6.3. SWOT Analysis
- 11.2.6.4. Recent Developments
- 11.2.6.5. Financials (Based on Availability)
- 11.2.7 SAILING TECH
- 11.2.7.1. Overview
- 11.2.7.2. Products
- 11.2.7.3. SWOT Analysis
- 11.2.7.4. Recent Developments
- 11.2.7.5. Financials (Based on Availability)
- 11.2.8 Tianjin Rosen Technology Co.Ltd
- 11.2.8.1. Overview
- 11.2.8.2. Products
- 11.2.8.3. SWOT Analysis
- 11.2.8.4. Recent Developments
- 11.2.8.5. Financials (Based on Availability)
- 11.2.9 PANHAO
- 11.2.9.1. Overview
- 11.2.9.2. Products
- 11.2.9.3. SWOT Analysis
- 11.2.9.4. Recent Developments
- 11.2.9.5. Financials (Based on Availability)
- 11.2.1 Vishay
List of Figures
- Figure 1: Global Fast Thyristor Revenue Breakdown (million, %) by Region 2024 & 2032
- Figure 2: Global Fast Thyristor Volume Breakdown (K, %) by Region 2024 & 2032
- Figure 3: North America Fast Thyristor Revenue (million), by Application 2024 & 2032
- Figure 4: North America Fast Thyristor Volume (K), by Application 2024 & 2032
- Figure 5: North America Fast Thyristor Revenue Share (%), by Application 2024 & 2032
- Figure 6: North America Fast Thyristor Volume Share (%), by Application 2024 & 2032
- Figure 7: North America Fast Thyristor Revenue (million), by Type 2024 & 2032
- Figure 8: North America Fast Thyristor Volume (K), by Type 2024 & 2032
- Figure 9: North America Fast Thyristor Revenue Share (%), by Type 2024 & 2032
- Figure 10: North America Fast Thyristor Volume Share (%), by Type 2024 & 2032
- Figure 11: North America Fast Thyristor Revenue (million), by Country 2024 & 2032
- Figure 12: North America Fast Thyristor Volume (K), by Country 2024 & 2032
- Figure 13: North America Fast Thyristor Revenue Share (%), by Country 2024 & 2032
- Figure 14: North America Fast Thyristor Volume Share (%), by Country 2024 & 2032
- Figure 15: South America Fast Thyristor Revenue (million), by Application 2024 & 2032
- Figure 16: South America Fast Thyristor Volume (K), by Application 2024 & 2032
- Figure 17: South America Fast Thyristor Revenue Share (%), by Application 2024 & 2032
- Figure 18: South America Fast Thyristor Volume Share (%), by Application 2024 & 2032
- Figure 19: South America Fast Thyristor Revenue (million), by Type 2024 & 2032
- Figure 20: South America Fast Thyristor Volume (K), by Type 2024 & 2032
- Figure 21: South America Fast Thyristor Revenue Share (%), by Type 2024 & 2032
- Figure 22: South America Fast Thyristor Volume Share (%), by Type 2024 & 2032
- Figure 23: South America Fast Thyristor Revenue (million), by Country 2024 & 2032
- Figure 24: South America Fast Thyristor Volume (K), by Country 2024 & 2032
- Figure 25: South America Fast Thyristor Revenue Share (%), by Country 2024 & 2032
- Figure 26: South America Fast Thyristor Volume Share (%), by Country 2024 & 2032
- Figure 27: Europe Fast Thyristor Revenue (million), by Application 2024 & 2032
- Figure 28: Europe Fast Thyristor Volume (K), by Application 2024 & 2032
- Figure 29: Europe Fast Thyristor Revenue Share (%), by Application 2024 & 2032
- Figure 30: Europe Fast Thyristor Volume Share (%), by Application 2024 & 2032
- Figure 31: Europe Fast Thyristor Revenue (million), by Type 2024 & 2032
- Figure 32: Europe Fast Thyristor Volume (K), by Type 2024 & 2032
- Figure 33: Europe Fast Thyristor Revenue Share (%), by Type 2024 & 2032
- Figure 34: Europe Fast Thyristor Volume Share (%), by Type 2024 & 2032
- Figure 35: Europe Fast Thyristor Revenue (million), by Country 2024 & 2032
- Figure 36: Europe Fast Thyristor Volume (K), by Country 2024 & 2032
- Figure 37: Europe Fast Thyristor Revenue Share (%), by Country 2024 & 2032
- Figure 38: Europe Fast Thyristor Volume Share (%), by Country 2024 & 2032
- Figure 39: Middle East & Africa Fast Thyristor Revenue (million), by Application 2024 & 2032
- Figure 40: Middle East & Africa Fast Thyristor Volume (K), by Application 2024 & 2032
- Figure 41: Middle East & Africa Fast Thyristor Revenue Share (%), by Application 2024 & 2032
- Figure 42: Middle East & Africa Fast Thyristor Volume Share (%), by Application 2024 & 2032
- Figure 43: Middle East & Africa Fast Thyristor Revenue (million), by Type 2024 & 2032
- Figure 44: Middle East & Africa Fast Thyristor Volume (K), by Type 2024 & 2032
- Figure 45: Middle East & Africa Fast Thyristor Revenue Share (%), by Type 2024 & 2032
- Figure 46: Middle East & Africa Fast Thyristor Volume Share (%), by Type 2024 & 2032
- Figure 47: Middle East & Africa Fast Thyristor Revenue (million), by Country 2024 & 2032
- Figure 48: Middle East & Africa Fast Thyristor Volume (K), by Country 2024 & 2032
- Figure 49: Middle East & Africa Fast Thyristor Revenue Share (%), by Country 2024 & 2032
- Figure 50: Middle East & Africa Fast Thyristor Volume Share (%), by Country 2024 & 2032
- Figure 51: Asia Pacific Fast Thyristor Revenue (million), by Application 2024 & 2032
- Figure 52: Asia Pacific Fast Thyristor Volume (K), by Application 2024 & 2032
- Figure 53: Asia Pacific Fast Thyristor Revenue Share (%), by Application 2024 & 2032
- Figure 54: Asia Pacific Fast Thyristor Volume Share (%), by Application 2024 & 2032
- Figure 55: Asia Pacific Fast Thyristor Revenue (million), by Type 2024 & 2032
- Figure 56: Asia Pacific Fast Thyristor Volume (K), by Type 2024 & 2032
- Figure 57: Asia Pacific Fast Thyristor Revenue Share (%), by Type 2024 & 2032
- Figure 58: Asia Pacific Fast Thyristor Volume Share (%), by Type 2024 & 2032
- Figure 59: Asia Pacific Fast Thyristor Revenue (million), by Country 2024 & 2032
- Figure 60: Asia Pacific Fast Thyristor Volume (K), by Country 2024 & 2032
- Figure 61: Asia Pacific Fast Thyristor Revenue Share (%), by Country 2024 & 2032
- Figure 62: Asia Pacific Fast Thyristor Volume Share (%), by Country 2024 & 2032
List of Tables
- Table 1: Global Fast Thyristor Revenue million Forecast, by Region 2019 & 2032
- Table 2: Global Fast Thyristor Volume K Forecast, by Region 2019 & 2032
- Table 3: Global Fast Thyristor Revenue million Forecast, by Application 2019 & 2032
- Table 4: Global Fast Thyristor Volume K Forecast, by Application 2019 & 2032
- Table 5: Global Fast Thyristor Revenue million Forecast, by Type 2019 & 2032
- Table 6: Global Fast Thyristor Volume K Forecast, by Type 2019 & 2032
- Table 7: Global Fast Thyristor Revenue million Forecast, by Region 2019 & 2032
- Table 8: Global Fast Thyristor Volume K Forecast, by Region 2019 & 2032
- Table 9: Global Fast Thyristor Revenue million Forecast, by Application 2019 & 2032
- Table 10: Global Fast Thyristor Volume K Forecast, by Application 2019 & 2032
- Table 11: Global Fast Thyristor Revenue million Forecast, by Type 2019 & 2032
- Table 12: Global Fast Thyristor Volume K Forecast, by Type 2019 & 2032
- Table 13: Global Fast Thyristor Revenue million Forecast, by Country 2019 & 2032
- Table 14: Global Fast Thyristor Volume K Forecast, by Country 2019 & 2032
- Table 15: United States Fast Thyristor Revenue (million) Forecast, by Application 2019 & 2032
- Table 16: United States Fast Thyristor Volume (K) Forecast, by Application 2019 & 2032
- Table 17: Canada Fast Thyristor Revenue (million) Forecast, by Application 2019 & 2032
- Table 18: Canada Fast Thyristor Volume (K) Forecast, by Application 2019 & 2032
- Table 19: Mexico Fast Thyristor Revenue (million) Forecast, by Application 2019 & 2032
- Table 20: Mexico Fast Thyristor Volume (K) Forecast, by Application 2019 & 2032
- Table 21: Global Fast Thyristor Revenue million Forecast, by Application 2019 & 2032
- Table 22: Global Fast Thyristor Volume K Forecast, by Application 2019 & 2032
- Table 23: Global Fast Thyristor Revenue million Forecast, by Type 2019 & 2032
- Table 24: Global Fast Thyristor Volume K Forecast, by Type 2019 & 2032
- Table 25: Global Fast Thyristor Revenue million Forecast, by Country 2019 & 2032
- Table 26: Global Fast Thyristor Volume K Forecast, by Country 2019 & 2032
- Table 27: Brazil Fast Thyristor Revenue (million) Forecast, by Application 2019 & 2032
- Table 28: Brazil Fast Thyristor Volume (K) Forecast, by Application 2019 & 2032
- Table 29: Argentina Fast Thyristor Revenue (million) Forecast, by Application 2019 & 2032
- Table 30: Argentina Fast Thyristor Volume (K) Forecast, by Application 2019 & 2032
- Table 31: Rest of South America Fast Thyristor Revenue (million) Forecast, by Application 2019 & 2032
- Table 32: Rest of South America Fast Thyristor Volume (K) Forecast, by Application 2019 & 2032
- Table 33: Global Fast Thyristor Revenue million Forecast, by Application 2019 & 2032
- Table 34: Global Fast Thyristor Volume K Forecast, by Application 2019 & 2032
- Table 35: Global Fast Thyristor Revenue million Forecast, by Type 2019 & 2032
- Table 36: Global Fast Thyristor Volume K Forecast, by Type 2019 & 2032
- Table 37: Global Fast Thyristor Revenue million Forecast, by Country 2019 & 2032
- Table 38: Global Fast Thyristor Volume K Forecast, by Country 2019 & 2032
- Table 39: United Kingdom Fast Thyristor Revenue (million) Forecast, by Application 2019 & 2032
- Table 40: United Kingdom Fast Thyristor Volume (K) Forecast, by Application 2019 & 2032
- Table 41: Germany Fast Thyristor Revenue (million) Forecast, by Application 2019 & 2032
- Table 42: Germany Fast Thyristor Volume (K) Forecast, by Application 2019 & 2032
- Table 43: France Fast Thyristor Revenue (million) Forecast, by Application 2019 & 2032
- Table 44: France Fast Thyristor Volume (K) Forecast, by Application 2019 & 2032
- Table 45: Italy Fast Thyristor Revenue (million) Forecast, by Application 2019 & 2032
- Table 46: Italy Fast Thyristor Volume (K) Forecast, by Application 2019 & 2032
- Table 47: Spain Fast Thyristor Revenue (million) Forecast, by Application 2019 & 2032
- Table 48: Spain Fast Thyristor Volume (K) Forecast, by Application 2019 & 2032
- Table 49: Russia Fast Thyristor Revenue (million) Forecast, by Application 2019 & 2032
- Table 50: Russia Fast Thyristor Volume (K) Forecast, by Application 2019 & 2032
- Table 51: Benelux Fast Thyristor Revenue (million) Forecast, by Application 2019 & 2032
- Table 52: Benelux Fast Thyristor Volume (K) Forecast, by Application 2019 & 2032
- Table 53: Nordics Fast Thyristor Revenue (million) Forecast, by Application 2019 & 2032
- Table 54: Nordics Fast Thyristor Volume (K) Forecast, by Application 2019 & 2032
- Table 55: Rest of Europe Fast Thyristor Revenue (million) Forecast, by Application 2019 & 2032
- Table 56: Rest of Europe Fast Thyristor Volume (K) Forecast, by Application 2019 & 2032
- Table 57: Global Fast Thyristor Revenue million Forecast, by Application 2019 & 2032
- Table 58: Global Fast Thyristor Volume K Forecast, by Application 2019 & 2032
- Table 59: Global Fast Thyristor Revenue million Forecast, by Type 2019 & 2032
- Table 60: Global Fast Thyristor Volume K Forecast, by Type 2019 & 2032
- Table 61: Global Fast Thyristor Revenue million Forecast, by Country 2019 & 2032
- Table 62: Global Fast Thyristor Volume K Forecast, by Country 2019 & 2032
- Table 63: Turkey Fast Thyristor Revenue (million) Forecast, by Application 2019 & 2032
- Table 64: Turkey Fast Thyristor Volume (K) Forecast, by Application 2019 & 2032
- Table 65: Israel Fast Thyristor Revenue (million) Forecast, by Application 2019 & 2032
- Table 66: Israel Fast Thyristor Volume (K) Forecast, by Application 2019 & 2032
- Table 67: GCC Fast Thyristor Revenue (million) Forecast, by Application 2019 & 2032
- Table 68: GCC Fast Thyristor Volume (K) Forecast, by Application 2019 & 2032
- Table 69: North Africa Fast Thyristor Revenue (million) Forecast, by Application 2019 & 2032
- Table 70: North Africa Fast Thyristor Volume (K) Forecast, by Application 2019 & 2032
- Table 71: South Africa Fast Thyristor Revenue (million) Forecast, by Application 2019 & 2032
- Table 72: South Africa Fast Thyristor Volume (K) Forecast, by Application 2019 & 2032
- Table 73: Rest of Middle East & Africa Fast Thyristor Revenue (million) Forecast, by Application 2019 & 2032
- Table 74: Rest of Middle East & Africa Fast Thyristor Volume (K) Forecast, by Application 2019 & 2032
- Table 75: Global Fast Thyristor Revenue million Forecast, by Application 2019 & 2032
- Table 76: Global Fast Thyristor Volume K Forecast, by Application 2019 & 2032
- Table 77: Global Fast Thyristor Revenue million Forecast, by Type 2019 & 2032
- Table 78: Global Fast Thyristor Volume K Forecast, by Type 2019 & 2032
- Table 79: Global Fast Thyristor Revenue million Forecast, by Country 2019 & 2032
- Table 80: Global Fast Thyristor Volume K Forecast, by Country 2019 & 2032
- Table 81: China Fast Thyristor Revenue (million) Forecast, by Application 2019 & 2032
- Table 82: China Fast Thyristor Volume (K) Forecast, by Application 2019 & 2032
- Table 83: India Fast Thyristor Revenue (million) Forecast, by Application 2019 & 2032
- Table 84: India Fast Thyristor Volume (K) Forecast, by Application 2019 & 2032
- Table 85: Japan Fast Thyristor Revenue (million) Forecast, by Application 2019 & 2032
- Table 86: Japan Fast Thyristor Volume (K) Forecast, by Application 2019 & 2032
- Table 87: South Korea Fast Thyristor Revenue (million) Forecast, by Application 2019 & 2032
- Table 88: South Korea Fast Thyristor Volume (K) Forecast, by Application 2019 & 2032
- Table 89: ASEAN Fast Thyristor Revenue (million) Forecast, by Application 2019 & 2032
- Table 90: ASEAN Fast Thyristor Volume (K) Forecast, by Application 2019 & 2032
- Table 91: Oceania Fast Thyristor Revenue (million) Forecast, by Application 2019 & 2032
- Table 92: Oceania Fast Thyristor Volume (K) Forecast, by Application 2019 & 2032
- Table 93: Rest of Asia Pacific Fast Thyristor Revenue (million) Forecast, by Application 2019 & 2032
- Table 94: Rest of Asia Pacific Fast Thyristor Volume (K) Forecast, by Application 2019 & 2032
Frequently Asked Questions
1. What is the projected Compound Annual Growth Rate (CAGR) of the Fast Thyristor?
The projected CAGR is approximately 4.1%.
2. Which companies are prominent players in the Fast Thyristor?
Key companies in the market include Vishay, Littelfuse, AS Energi, IXYS Corporation, Poseico Power Electronics, Jiangsu Runau Electronics Manufacturing Co.,Ltd, SAILING TECH, Tianjin Rosen Technology Co.,Ltd, PANHAO.
3. What are the main segments of the Fast Thyristor?
The market segments include Application, Type.
4. Can you provide details about the market size?
The market size is estimated to be USD 1957 million as of 2022.
5. What are some drivers contributing to market growth?
N/A
6. What are the notable trends driving market growth?
N/A
7. Are there any restraints impacting market growth?
N/A
8. Can you provide examples of recent developments in the market?
N/A
9. What pricing options are available for accessing the report?
Pricing options include single-user, multi-user, and enterprise licenses priced at USD 3950.00, USD 5925.00, and USD 7900.00 respectively.
10. Is the market size provided in terms of value or volume?
The market size is provided in terms of value, measured in million and volume, measured in K.
11. Are there any specific market keywords associated with the report?
Yes, the market keyword associated with the report is "Fast Thyristor," which aids in identifying and referencing the specific market segment covered.
12. How do I determine which pricing option suits my needs best?
The pricing options vary based on user requirements and access needs. Individual users may opt for single-user licenses, while businesses requiring broader access may choose multi-user or enterprise licenses for cost-effective access to the report.
13. Are there any additional resources or data provided in the Fast Thyristor report?
While the report offers comprehensive insights, it's advisable to review the specific contents or supplementary materials provided to ascertain if additional resources or data are available.
14. How can I stay updated on further developments or reports in the Fast Thyristor?
To stay informed about further developments, trends, and reports in the Fast Thyristor, consider subscribing to industry newsletters, following relevant companies and organizations, or regularly checking reputable industry news sources and publications.
Methodology
Step 1 - Identification of Relevant Samples Size from Population Database


Step 2 - Approaches for Defining Global Market Size (Value, Volume* & Price*)

Note*: In applicable scenarios
Step 3 - Data Sources
Primary Research
- Web Analytics
- Survey Reports
- Research Institute
- Latest Research Reports
- Opinion Leaders
Secondary Research
- Annual Reports
- White Paper
- Latest Press Release
- Industry Association
- Paid Database
- Investor Presentations

Step 4 - Data Triangulation
Involves using different sources of information in order to increase the validity of a study
These sources are likely to be stakeholders in a program - participants, other researchers, program staff, other community members, and so on.
Then we put all data in single framework & apply various statistical tools to find out the dynamic on the market.
During the analysis stage, feedback from the stakeholder groups would be compared to determine areas of agreement as well as areas of divergence


