
Key Insights
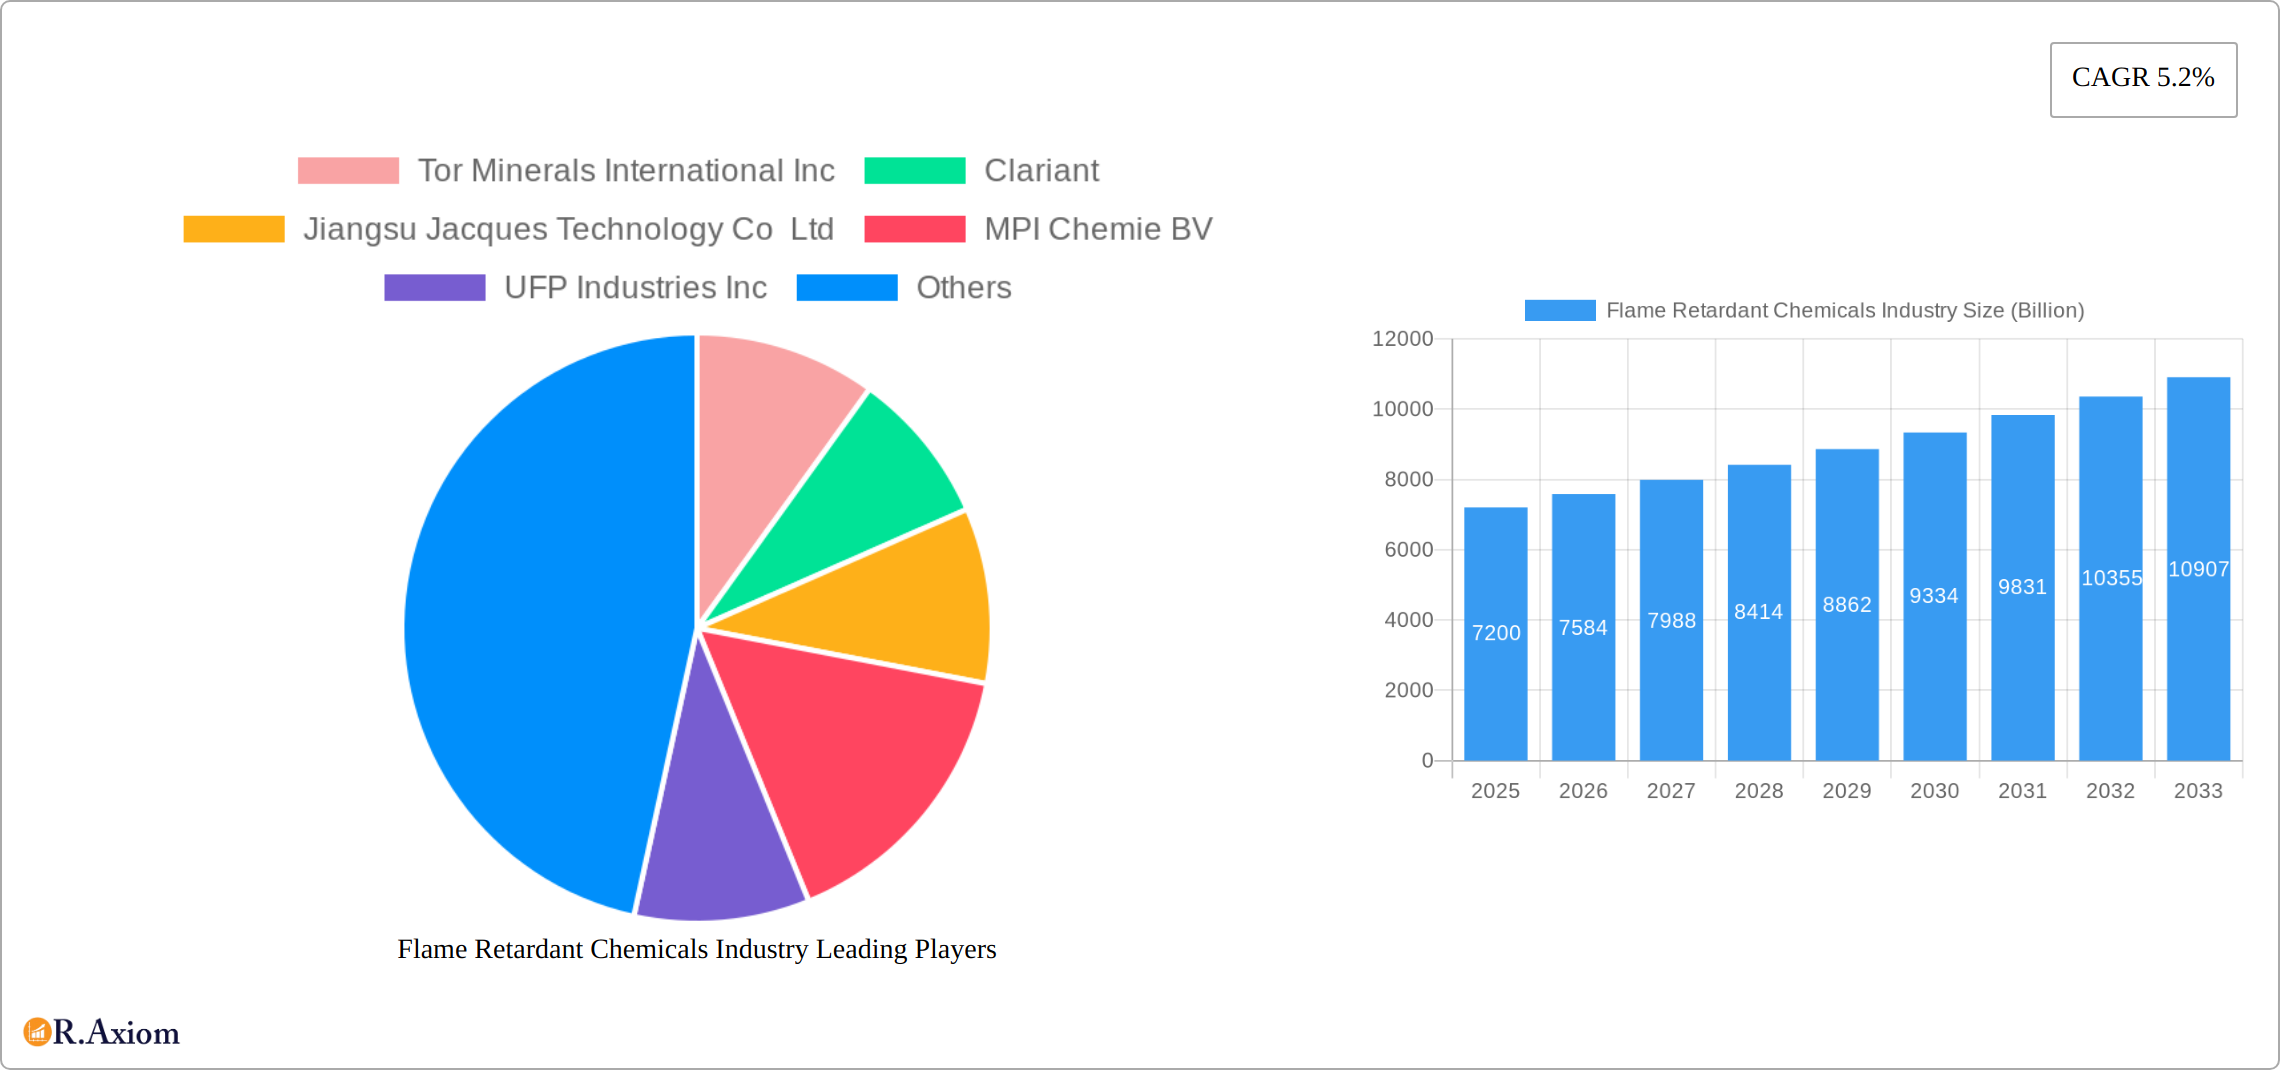
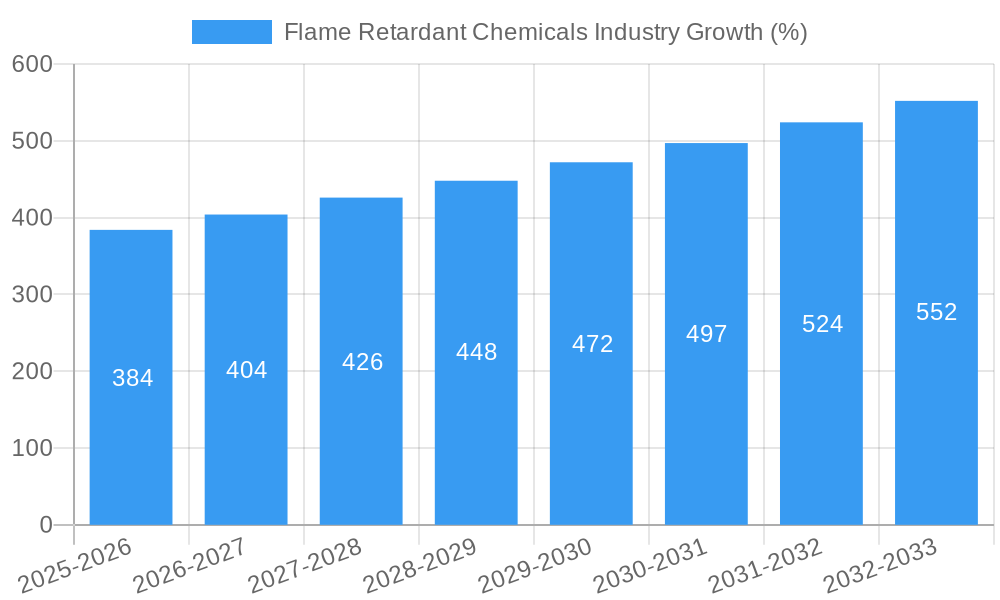
The global flame retardant chemicals market, valued at $7.2 billion in 2025, is projected to experience robust growth, driven by a Compound Annual Growth Rate (CAGR) of 5.2% from 2025 to 2033. This expansion is fueled by several key factors. The burgeoning electrical and electronics sector, coupled with stringent safety regulations mandating fire-resistant materials in buildings and transportation, significantly boosts demand. Increased construction activity globally, particularly in developing economies, further fuels market growth. The rising adoption of flame retardants in textiles and furniture, driven by consumer safety concerns, contributes to this upward trend. However, environmental concerns surrounding certain halogenated flame retardants and their potential impact on human health and the ecosystem pose a significant restraint. The industry is actively transitioning towards eco-friendly, non-halogenated alternatives like aluminum hydroxide and magnesium hydroxide, presenting opportunities for manufacturers focusing on sustainable solutions. Market segmentation reveals that non-halogenated flame retardants hold a considerable market share, reflecting this growing preference for safer and more environmentally responsible products. Competition is fierce, with established players like BASF, Clariant, and LANXESS alongside emerging regional companies vying for market dominance. Innovation in material science, focusing on improved performance and reduced environmental impact, will shape future market dynamics.
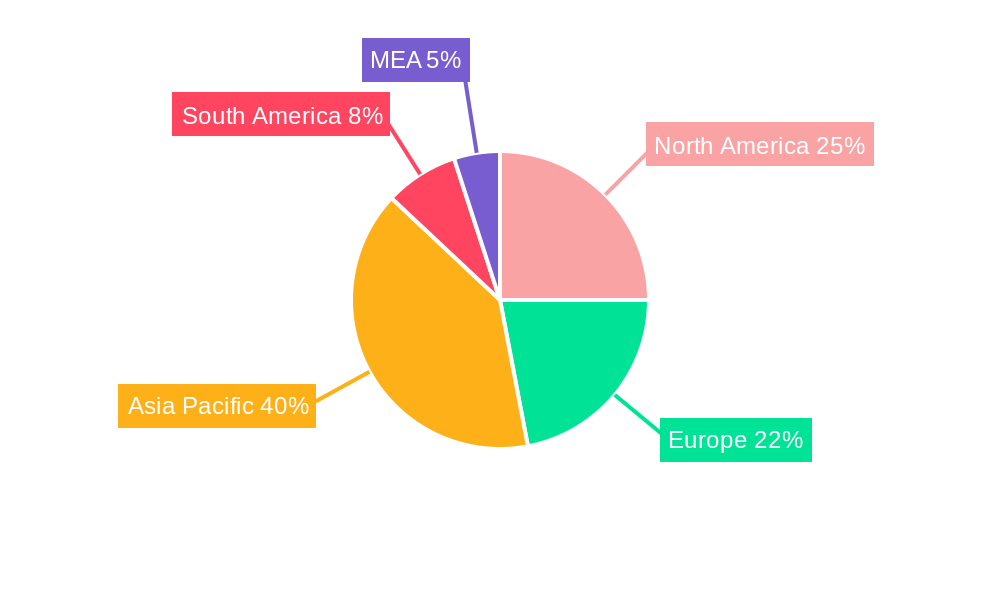
The geographical distribution of the market indicates strong growth across all regions, with Asia-Pacific, driven by rapid industrialization and urbanization in countries like China and India, expected to dominate the market. North America and Europe, while mature markets, continue to show healthy growth fueled by stringent safety standards and a focus on sustainable solutions. The South American and MEA regions are projected to exhibit moderate growth, driven by increasing infrastructure development and rising demand from various end-use sectors. The competitive landscape necessitates strategic partnerships, acquisitions, and continuous research and development to maintain a competitive edge. Manufacturers are increasingly focusing on customization and product diversification to cater to the specific needs of diverse end-user industries.
Flame Retardant Chemicals Industry: A Comprehensive Market Report (2019-2033)
This comprehensive report provides an in-depth analysis of the global flame retardant chemicals industry, encompassing market size, growth projections, competitive landscape, and future trends. The study period covers 2019-2033, with 2025 as the base and estimated year. The report's findings are crucial for industry stakeholders, investors, and strategic decision-makers seeking to navigate this dynamic market. The global market value is projected to reach xx Billion by 2033.
Flame Retardant Chemicals Industry Market Concentration & Innovation
The flame retardant chemicals market presents a moderately concentrated landscape, dominated by a few key players commanding substantial market share. However, a dynamic competitive environment is fostered by the presence of numerous smaller regional players and innovative startups. Preliminary 2024 market share data indicates that BASF SE, Clariant, and LANXESS collectively hold approximately xx% of the global market, with the remaining share distributed among other prominent companies such as Dow, ICL Group, and Albemarle Corporation. Innovation is a crucial driver within this sector, propelled by increasingly stringent safety regulations and the escalating demand for high-performance, environmentally responsible products. Significant R&D investments are focused on developing halogen-free alternatives and enhancing the efficacy and sustainability of existing solutions. This includes exploring bio-based and recycled materials as potential substitutes and focusing on circular economy principles for waste management.
- Market Concentration: Moderately high (xx%), with several dominant players and a competitive fringe of smaller companies.
- Innovation Drivers: Stringent safety regulations, growing consumer demand for eco-friendly solutions, and continuous technological advancements, including nanotechnology and material science innovations.
- Regulatory Frameworks: Differ significantly across global regions, directly influencing product selection, market access, and overall competitive dynamics.
- Product Substitutes: The emergence of bio-based and recycled materials, along with alternative fire-safety approaches, presents both opportunities and challenges for established players.
- End-User Trends: Booming demand from the electronics, construction, transportation, and furniture sectors are key growth drivers.
- M&A Activities: Industry consolidation through mergers and acquisitions is projected to continue, with deal values estimated to exceed xx Billion in the forecast period (2025-2033). This consolidation may lead to further market concentration.
Flame Retardant Chemicals Industry Industry Trends & Insights
The flame retardant chemicals market is experiencing robust growth, driven by several factors. The increasing demand for fire safety in various applications, including construction, electronics, and transportation, is a major catalyst. The market is projected to grow at a Compound Annual Growth Rate (CAGR) of xx% during the forecast period (2025-2033). Technological advancements, such as the development of novel non-halogenated flame retardants, are significantly influencing market dynamics. Consumer preference for safer and more sustainable products is also shaping the industry's trajectory. Competitive dynamics are intensifying, with companies focusing on product diversification, strategic partnerships, and geographical expansion. Market penetration of non-halogenated flame retardants is steadily increasing, driven by environmental concerns and regulatory pressures.
Dominant Markets & Segments in Flame Retardant Chemicals Industry
The Asia-Pacific region is projected to remain the dominant market for flame retardant chemicals, fueled by rapid industrialization and urbanization, especially within China and India. Within product types, non-halogenated flame retardants are exhibiting significantly higher growth rates compared to their halogenated counterparts, driven largely by stricter environmental regulations globally. Among inorganic flame retardants, aluminum hydroxide maintains a substantial market share due to its cost-effectiveness and versatile applicability across diverse end-use sectors. However, the market is witnessing the rise of novel inorganic and hybrid materials offering enhanced performance and reduced environmental impact.
Leading Region: Asia-Pacific (China, India), followed by North America and Europe.
Key Drivers:
- Rapid industrialization and urbanization, particularly in emerging economies.
- Stringent building codes and increasingly stringent fire safety standards globally.
- Growing infrastructure development and investment in renewable energy infrastructure.
Dominant Product Type: Non-halogenated flame retardants, reflecting a global shift towards more sustainable solutions.
Dominant End-User Industry: Electrical and Electronics, followed by the Building and Construction sector.
Dominant Inorganic Segment: Aluminum Hydroxide, although competition from alternative materials is increasing.
Detailed Dominance Analysis: The Asia-Pacific region's prominence stems from its vast and rapidly expanding construction and electronics industries. China's substantial manufacturing sector significantly contributes to the demand for flame retardant chemicals. The growing preference for non-halogenated flame retardants reflects the global emphasis on environmental sustainability and compliance with stringent regulatory frameworks. The dominance of aluminum hydroxide is largely due to its comparatively lower cost, however, this could be challenged by the emergence of more innovative and efficient materials in the near future.
Flame Retardant Chemicals Industry Product Developments
Recent years have witnessed significant product innovation in the flame retardant chemicals industry. Companies are focusing on developing high-performance, environmentally friendly alternatives to traditional halogenated flame retardants. Key developments include novel phosphorus-based compounds, innovative polymer blends, and nanotechnology-enhanced formulations. These innovations cater to the demand for enhanced flame retardancy, improved thermal stability, and better compatibility with various materials. The focus is on optimizing performance, enhancing safety, and meeting stringent regulatory requirements across various end-use applications.
Report Scope & Segmentation Analysis
This report provides a comprehensive segmentation of the flame retardant chemicals market based on product type (non-halogenated and halogenated), inorganic type (aluminum hydroxide, magnesium hydroxide, boron compounds, and others), and end-user industry (electrical & electronics, buildings & construction, transportation, textiles & furniture, and others). The report offers detailed growth projections, precise market sizing, and an in-depth analysis of the competitive dynamics within each segment. It delivers granular insights into the growth trajectories of individual segments and their contribution to the overall market expansion. Moreover, the report provides detailed market size projections for each segment across the forecast period, highlighting areas with significant growth potential and investment opportunities.
Key Drivers of Flame Retardant Chemicals Industry Growth
The flame retardant chemicals industry's growth is propelled by several key factors. These include increasingly stringent government regulations mandating fire safety in buildings and vehicles, the surging demand for electronics and electric vehicles, and a growing consumer awareness about fire safety. Technological advancements in flame retardant formulations—including the development of more effective and environmentally benign alternatives—significantly contribute to market expansion. The expansion of global infrastructure projects and the consistent rise in construction activity worldwide further fuels the demand for flame retardant chemicals. The increasing focus on sustainable building practices and green building certifications also plays a significant role.
Challenges in the Flame Retardant Chemicals Industry Sector
The flame retardant chemicals industry faces a multitude of challenges, including increasingly stringent environmental regulations that restrict the use of certain chemicals (e.g., phase-out of certain halogenated flame retardants), fluctuations in raw material prices, and fierce competition amongst both established players and new entrants. Supply chain disruptions, exacerbated by geopolitical events and material shortages, can severely impact the industry's profitability and production capacity. The continuous development and commercialization of substitute materials and eco-friendly alternatives introduce ongoing competitive pressures, necessitating constant innovation and adaptation for industry players to maintain market share and profitability. Furthermore, managing the perception and addressing potential public health concerns related to certain flame retardant chemicals remains a significant challenge.
Emerging Opportunities in Flame Retardant Chemicals Industry
Emerging opportunities lie in developing sustainable and environmentally friendly flame retardants, expanding into new applications (e.g., renewable energy sectors), and catering to emerging markets. The focus on bio-based and recycled materials offers a significant avenue for growth. Technological advancements, such as nanotechnology and advanced materials, create opportunities for developing novel flame retardant solutions. The increasing demand for higher-performance and multifunctional flame retardants presents significant growth opportunities.
Leading Players in the Flame Retardant Chemicals Industry Market
- Tor Minerals International Inc
- Clariant
- Jiangsu Jacques Technology Co Ltd
- MPI Chemie BV
- UFP Industries Inc
- Italmatch Chemicals SpA
- LANXESS
- Kemipex
- BASF SE
- Tosoh Corporation
- RTP Company
- Dow
- DAIHACHI CHEMICAL INDUSTRY CO LTD
- Sanwa Chemical Co Ltd
- Nabaltec AG
- Thor
- ICL Group
- DIC CORPORATION
- Shandong Brother Sci & Tech Co Ltd
- J M Huber Corporation
- Albemarle Corporation
- Nyacol Nano Technologies Inc
- Eti Maden
- Apexical Inc
- RIN KAGAKU KOGYO Co Ltd
Key Developments in Flame Retardant Chemicals Industry Industry
- September 2022: LANXESS launched new phosphorous-based flame retardants with enhanced thermal and mechanical stability.
- July 2022: BASF SE partnered with THOR GmBH to strengthen its non-halogenated flame retardant portfolio.
- April 2022: BASF launched a new flame retardant product range for the electronics industry, featuring corrosion-resistant polyphthalamides.
Strategic Outlook for Flame Retardant Chemicals Industry Market
The flame retardant chemicals market is poised for continued growth, driven by increasing demand from key end-use sectors and the ongoing development of innovative, sustainable solutions. Opportunities for expansion exist in emerging markets and new applications, particularly within renewable energy technologies. The focus on sustainable and environmentally friendly products will continue to shape industry dynamics, presenting both challenges and opportunities for market players. The overall outlook remains positive, with significant growth potential in the coming years.
Flame Retardant Chemicals Industry Segmentation
-
1. Product Type
-
1.1. Non-halogenated Flame Retardant Chemicals
-
1.1.1. Inorganic
- 1.1.1.1. Aluminum Hydroxide
- 1.1.1.2. Magnesium Hydroxide
- 1.1.1.3. Boron Compounds
- 1.1.2. Phosphorus
- 1.1.3. Nitrogen
- 1.1.4. Other Product Types
-
1.1.1. Inorganic
-
1.2. Halogenated Flame Retardants Chemicals
- 1.2.1. Brominated Compounds
- 1.2.2. Chlorinated Compounds
-
1.1. Non-halogenated Flame Retardant Chemicals
-
2. End-user Industry
- 2.1. Electrical and Electronics
- 2.2. Buildings and Construction
- 2.3. Transportation
- 2.4. Textiles and Furniture
Flame Retardant Chemicals Industry Segmentation By Geography
-
1. Asia Pacific
- 1.1. China
- 1.2. India
- 1.3. Japan
- 1.4. South Korea
- 1.5. Australia and New Zealand
- 1.6. Rest of Asia Pacific
-
2. North America
- 2.1. United States
- 2.2. Canada
- 2.3. Mexico
- 2.4. Rest of North America
-
3. Europe
- 3.1. Germany
- 3.2. United Kingdom
- 3.3. Italy
- 3.4. France
- 3.5. Spain
- 3.6. Rest of Europe
-
4. South America
- 4.1. Brazil
- 4.2. Argentina
- 4.3. Rest of South America
- 5. Middle East
-
6. Saudi Arabia
- 6.1. South Africa
- 6.2. Qatar
- 6.3. Rest of Middle East
Flame Retardant Chemicals Industry REPORT HIGHLIGHTS
| Aspects | Details |
|---|---|
| Study Period | 2019-2033 |
| Base Year | 2024 |
| Estimated Year | 2025 |
| Forecast Period | 2025-2033 |
| Historical Period | 2019-2024 |
| Growth Rate | CAGR of 5.2% from 2019-2033 |
| Segmentation |
|
Table of Contents
- 1. Introduction
- 1.1. Research Scope
- 1.2. Market Segmentation
- 1.3. Research Methodology
- 1.4. Definitions and Assumptions
- 2. Executive Summary
- 2.1. Introduction
- 3. Market Dynamics
- 3.1. Introduction
- 3.2. Market Drivers
- 3.2.1. Increasing Infrastructure Activities in Asia-Pacific; Rise in Safety Standards in Building Construction; Rising Consumer Electrical and Electronic Goods Manufacturing
- 3.3. Market Restrains
- 3.3.1. Environmental and Health Concerns Regarding Brominated and Halogenated Flame Retardants
- 3.4. Market Trends
- 3.4.1. Building and Construction Segment to Dominate the Market
- 4. Market Factor Analysis
- 4.1. Porters Five Forces
- 4.2. Supply/Value Chain
- 4.3. PESTEL analysis
- 4.4. Market Entropy
- 4.5. Patent/Trademark Analysis
- 5. Global Flame Retardant Chemicals Industry Analysis, Insights and Forecast, 2019-2031
- 5.1. Market Analysis, Insights and Forecast - by Product Type
- 5.1.1. Non-halogenated Flame Retardant Chemicals
- 5.1.1.1. Inorganic
- 5.1.1.1.1. Aluminum Hydroxide
- 5.1.1.1.2. Magnesium Hydroxide
- 5.1.1.1.3. Boron Compounds
- 5.1.1.2. Phosphorus
- 5.1.1.3. Nitrogen
- 5.1.1.4. Other Product Types
- 5.1.1.1. Inorganic
- 5.1.2. Halogenated Flame Retardants Chemicals
- 5.1.2.1. Brominated Compounds
- 5.1.2.2. Chlorinated Compounds
- 5.1.1. Non-halogenated Flame Retardant Chemicals
- 5.2. Market Analysis, Insights and Forecast - by End-user Industry
- 5.2.1. Electrical and Electronics
- 5.2.2. Buildings and Construction
- 5.2.3. Transportation
- 5.2.4. Textiles and Furniture
- 5.3. Market Analysis, Insights and Forecast - by Region
- 5.3.1. Asia Pacific
- 5.3.2. North America
- 5.3.3. Europe
- 5.3.4. South America
- 5.3.5. Middle East
- 5.3.6. Saudi Arabia
- 5.1. Market Analysis, Insights and Forecast - by Product Type
- 6. Asia Pacific Flame Retardant Chemicals Industry Analysis, Insights and Forecast, 2019-2031
- 6.1. Market Analysis, Insights and Forecast - by Product Type
- 6.1.1. Non-halogenated Flame Retardant Chemicals
- 6.1.1.1. Inorganic
- 6.1.1.1.1. Aluminum Hydroxide
- 6.1.1.1.2. Magnesium Hydroxide
- 6.1.1.1.3. Boron Compounds
- 6.1.1.2. Phosphorus
- 6.1.1.3. Nitrogen
- 6.1.1.4. Other Product Types
- 6.1.1.1. Inorganic
- 6.1.2. Halogenated Flame Retardants Chemicals
- 6.1.2.1. Brominated Compounds
- 6.1.2.2. Chlorinated Compounds
- 6.1.1. Non-halogenated Flame Retardant Chemicals
- 6.2. Market Analysis, Insights and Forecast - by End-user Industry
- 6.2.1. Electrical and Electronics
- 6.2.2. Buildings and Construction
- 6.2.3. Transportation
- 6.2.4. Textiles and Furniture
- 6.1. Market Analysis, Insights and Forecast - by Product Type
- 7. North America Flame Retardant Chemicals Industry Analysis, Insights and Forecast, 2019-2031
- 7.1. Market Analysis, Insights and Forecast - by Product Type
- 7.1.1. Non-halogenated Flame Retardant Chemicals
- 7.1.1.1. Inorganic
- 7.1.1.1.1. Aluminum Hydroxide
- 7.1.1.1.2. Magnesium Hydroxide
- 7.1.1.1.3. Boron Compounds
- 7.1.1.2. Phosphorus
- 7.1.1.3. Nitrogen
- 7.1.1.4. Other Product Types
- 7.1.1.1. Inorganic
- 7.1.2. Halogenated Flame Retardants Chemicals
- 7.1.2.1. Brominated Compounds
- 7.1.2.2. Chlorinated Compounds
- 7.1.1. Non-halogenated Flame Retardant Chemicals
- 7.2. Market Analysis, Insights and Forecast - by End-user Industry
- 7.2.1. Electrical and Electronics
- 7.2.2. Buildings and Construction
- 7.2.3. Transportation
- 7.2.4. Textiles and Furniture
- 7.1. Market Analysis, Insights and Forecast - by Product Type
- 8. Europe Flame Retardant Chemicals Industry Analysis, Insights and Forecast, 2019-2031
- 8.1. Market Analysis, Insights and Forecast - by Product Type
- 8.1.1. Non-halogenated Flame Retardant Chemicals
- 8.1.1.1. Inorganic
- 8.1.1.1.1. Aluminum Hydroxide
- 8.1.1.1.2. Magnesium Hydroxide
- 8.1.1.1.3. Boron Compounds
- 8.1.1.2. Phosphorus
- 8.1.1.3. Nitrogen
- 8.1.1.4. Other Product Types
- 8.1.1.1. Inorganic
- 8.1.2. Halogenated Flame Retardants Chemicals
- 8.1.2.1. Brominated Compounds
- 8.1.2.2. Chlorinated Compounds
- 8.1.1. Non-halogenated Flame Retardant Chemicals
- 8.2. Market Analysis, Insights and Forecast - by End-user Industry
- 8.2.1. Electrical and Electronics
- 8.2.2. Buildings and Construction
- 8.2.3. Transportation
- 8.2.4. Textiles and Furniture
- 8.1. Market Analysis, Insights and Forecast - by Product Type
- 9. South America Flame Retardant Chemicals Industry Analysis, Insights and Forecast, 2019-2031
- 9.1. Market Analysis, Insights and Forecast - by Product Type
- 9.1.1. Non-halogenated Flame Retardant Chemicals
- 9.1.1.1. Inorganic
- 9.1.1.1.1. Aluminum Hydroxide
- 9.1.1.1.2. Magnesium Hydroxide
- 9.1.1.1.3. Boron Compounds
- 9.1.1.2. Phosphorus
- 9.1.1.3. Nitrogen
- 9.1.1.4. Other Product Types
- 9.1.1.1. Inorganic
- 9.1.2. Halogenated Flame Retardants Chemicals
- 9.1.2.1. Brominated Compounds
- 9.1.2.2. Chlorinated Compounds
- 9.1.1. Non-halogenated Flame Retardant Chemicals
- 9.2. Market Analysis, Insights and Forecast - by End-user Industry
- 9.2.1. Electrical and Electronics
- 9.2.2. Buildings and Construction
- 9.2.3. Transportation
- 9.2.4. Textiles and Furniture
- 9.1. Market Analysis, Insights and Forecast - by Product Type
- 10. Middle East Flame Retardant Chemicals Industry Analysis, Insights and Forecast, 2019-2031
- 10.1. Market Analysis, Insights and Forecast - by Product Type
- 10.1.1. Non-halogenated Flame Retardant Chemicals
- 10.1.1.1. Inorganic
- 10.1.1.1.1. Aluminum Hydroxide
- 10.1.1.1.2. Magnesium Hydroxide
- 10.1.1.1.3. Boron Compounds
- 10.1.1.2. Phosphorus
- 10.1.1.3. Nitrogen
- 10.1.1.4. Other Product Types
- 10.1.1.1. Inorganic
- 10.1.2. Halogenated Flame Retardants Chemicals
- 10.1.2.1. Brominated Compounds
- 10.1.2.2. Chlorinated Compounds
- 10.1.1. Non-halogenated Flame Retardant Chemicals
- 10.2. Market Analysis, Insights and Forecast - by End-user Industry
- 10.2.1. Electrical and Electronics
- 10.2.2. Buildings and Construction
- 10.2.3. Transportation
- 10.2.4. Textiles and Furniture
- 10.1. Market Analysis, Insights and Forecast - by Product Type
- 11. Saudi Arabia Flame Retardant Chemicals Industry Analysis, Insights and Forecast, 2019-2031
- 11.1. Market Analysis, Insights and Forecast - by Product Type
- 11.1.1. Non-halogenated Flame Retardant Chemicals
- 11.1.1.1. Inorganic
- 11.1.1.1.1. Aluminum Hydroxide
- 11.1.1.1.2. Magnesium Hydroxide
- 11.1.1.1.3. Boron Compounds
- 11.1.1.2. Phosphorus
- 11.1.1.3. Nitrogen
- 11.1.1.4. Other Product Types
- 11.1.1.1. Inorganic
- 11.1.2. Halogenated Flame Retardants Chemicals
- 11.1.2.1. Brominated Compounds
- 11.1.2.2. Chlorinated Compounds
- 11.1.1. Non-halogenated Flame Retardant Chemicals
- 11.2. Market Analysis, Insights and Forecast - by End-user Industry
- 11.2.1. Electrical and Electronics
- 11.2.2. Buildings and Construction
- 11.2.3. Transportation
- 11.2.4. Textiles and Furniture
- 11.1. Market Analysis, Insights and Forecast - by Product Type
- 12. North America Flame Retardant Chemicals Industry Analysis, Insights and Forecast, 2019-2031
- 12.1. Market Analysis, Insights and Forecast - By Country/Sub-region
- 12.1.1 United States
- 12.1.2 Canada
- 12.1.3 Mexico
- 13. Europe Flame Retardant Chemicals Industry Analysis, Insights and Forecast, 2019-2031
- 13.1. Market Analysis, Insights and Forecast - By Country/Sub-region
- 13.1.1 Germany
- 13.1.2 France
- 13.1.3 Italy
- 13.1.4 United Kingdom
- 13.1.5 Netherlands
- 13.1.6 Rest of Europe
- 14. Asia Pacific Flame Retardant Chemicals Industry Analysis, Insights and Forecast, 2019-2031
- 14.1. Market Analysis, Insights and Forecast - By Country/Sub-region
- 14.1.1 China
- 14.1.2 Japan
- 14.1.3 India
- 14.1.4 South Korea
- 14.1.5 Taiwan
- 14.1.6 Australia
- 14.1.7 Rest of Asia-Pacific
- 15. South America Flame Retardant Chemicals Industry Analysis, Insights and Forecast, 2019-2031
- 15.1. Market Analysis, Insights and Forecast - By Country/Sub-region
- 15.1.1 Brazil
- 15.1.2 Argentina
- 15.1.3 Rest of South America
- 16. MEA Flame Retardant Chemicals Industry Analysis, Insights and Forecast, 2019-2031
- 16.1. Market Analysis, Insights and Forecast - By Country/Sub-region
- 16.1.1 Middle East
- 16.1.2 Africa
- 17. Competitive Analysis
- 17.1. Global Market Share Analysis 2024
- 17.2. Company Profiles
- 17.2.1 Tor Minerals International Inc
- 17.2.1.1. Overview
- 17.2.1.2. Products
- 17.2.1.3. SWOT Analysis
- 17.2.1.4. Recent Developments
- 17.2.1.5. Financials (Based on Availability)
- 17.2.2 Clariant
- 17.2.2.1. Overview
- 17.2.2.2. Products
- 17.2.2.3. SWOT Analysis
- 17.2.2.4. Recent Developments
- 17.2.2.5. Financials (Based on Availability)
- 17.2.3 Jiangsu Jacques Technology Co Ltd
- 17.2.3.1. Overview
- 17.2.3.2. Products
- 17.2.3.3. SWOT Analysis
- 17.2.3.4. Recent Developments
- 17.2.3.5. Financials (Based on Availability)
- 17.2.4 MPI Chemie BV
- 17.2.4.1. Overview
- 17.2.4.2. Products
- 17.2.4.3. SWOT Analysis
- 17.2.4.4. Recent Developments
- 17.2.4.5. Financials (Based on Availability)
- 17.2.5 UFP Industries Inc
- 17.2.5.1. Overview
- 17.2.5.2. Products
- 17.2.5.3. SWOT Analysis
- 17.2.5.4. Recent Developments
- 17.2.5.5. Financials (Based on Availability)
- 17.2.6 Italmatch Chemicals SpA
- 17.2.6.1. Overview
- 17.2.6.2. Products
- 17.2.6.3. SWOT Analysis
- 17.2.6.4. Recent Developments
- 17.2.6.5. Financials (Based on Availability)
- 17.2.7 LANXESS
- 17.2.7.1. Overview
- 17.2.7.2. Products
- 17.2.7.3. SWOT Analysis
- 17.2.7.4. Recent Developments
- 17.2.7.5. Financials (Based on Availability)
- 17.2.8 Kemipex
- 17.2.8.1. Overview
- 17.2.8.2. Products
- 17.2.8.3. SWOT Analysis
- 17.2.8.4. Recent Developments
- 17.2.8.5. Financials (Based on Availability)
- 17.2.9 BASF SE
- 17.2.9.1. Overview
- 17.2.9.2. Products
- 17.2.9.3. SWOT Analysis
- 17.2.9.4. Recent Developments
- 17.2.9.5. Financials (Based on Availability)
- 17.2.10 Tosoh Corporation
- 17.2.10.1. Overview
- 17.2.10.2. Products
- 17.2.10.3. SWOT Analysis
- 17.2.10.4. Recent Developments
- 17.2.10.5. Financials (Based on Availability)
- 17.2.11 RTP Company
- 17.2.11.1. Overview
- 17.2.11.2. Products
- 17.2.11.3. SWOT Analysis
- 17.2.11.4. Recent Developments
- 17.2.11.5. Financials (Based on Availability)
- 17.2.12 Dow
- 17.2.12.1. Overview
- 17.2.12.2. Products
- 17.2.12.3. SWOT Analysis
- 17.2.12.4. Recent Developments
- 17.2.12.5. Financials (Based on Availability)
- 17.2.13 DAIHACHI CHEMICAL INDUSTRY CO LTD
- 17.2.13.1. Overview
- 17.2.13.2. Products
- 17.2.13.3. SWOT Analysis
- 17.2.13.4. Recent Developments
- 17.2.13.5. Financials (Based on Availability)
- 17.2.14 Sanwa Chemical Co Ltd
- 17.2.14.1. Overview
- 17.2.14.2. Products
- 17.2.14.3. SWOT Analysis
- 17.2.14.4. Recent Developments
- 17.2.14.5. Financials (Based on Availability)
- 17.2.15 Nabaltec AG
- 17.2.15.1. Overview
- 17.2.15.2. Products
- 17.2.15.3. SWOT Analysis
- 17.2.15.4. Recent Developments
- 17.2.15.5. Financials (Based on Availability)
- 17.2.16 Thor
- 17.2.16.1. Overview
- 17.2.16.2. Products
- 17.2.16.3. SWOT Analysis
- 17.2.16.4. Recent Developments
- 17.2.16.5. Financials (Based on Availability)
- 17.2.17 ICL Group
- 17.2.17.1. Overview
- 17.2.17.2. Products
- 17.2.17.3. SWOT Analysis
- 17.2.17.4. Recent Developments
- 17.2.17.5. Financials (Based on Availability)
- 17.2.18 DIC CORPORATION
- 17.2.18.1. Overview
- 17.2.18.2. Products
- 17.2.18.3. SWOT Analysis
- 17.2.18.4. Recent Developments
- 17.2.18.5. Financials (Based on Availability)
- 17.2.19 Shandong Brother Sci & Tech Co Ltd
- 17.2.19.1. Overview
- 17.2.19.2. Products
- 17.2.19.3. SWOT Analysis
- 17.2.19.4. Recent Developments
- 17.2.19.5. Financials (Based on Availability)
- 17.2.20 J M Huber Corporation
- 17.2.20.1. Overview
- 17.2.20.2. Products
- 17.2.20.3. SWOT Analysis
- 17.2.20.4. Recent Developments
- 17.2.20.5. Financials (Based on Availability)
- 17.2.21 Albemarle Corporation
- 17.2.21.1. Overview
- 17.2.21.2. Products
- 17.2.21.3. SWOT Analysis
- 17.2.21.4. Recent Developments
- 17.2.21.5. Financials (Based on Availability)
- 17.2.22 Nyacol Nano Technologies Inc
- 17.2.22.1. Overview
- 17.2.22.2. Products
- 17.2.22.3. SWOT Analysis
- 17.2.22.4. Recent Developments
- 17.2.22.5. Financials (Based on Availability)
- 17.2.23 Eti Maden
- 17.2.23.1. Overview
- 17.2.23.2. Products
- 17.2.23.3. SWOT Analysis
- 17.2.23.4. Recent Developments
- 17.2.23.5. Financials (Based on Availability)
- 17.2.24 Apexical Inc
- 17.2.24.1. Overview
- 17.2.24.2. Products
- 17.2.24.3. SWOT Analysis
- 17.2.24.4. Recent Developments
- 17.2.24.5. Financials (Based on Availability)
- 17.2.25 RIN KAGAKU KOGYO Co Ltd
- 17.2.25.1. Overview
- 17.2.25.2. Products
- 17.2.25.3. SWOT Analysis
- 17.2.25.4. Recent Developments
- 17.2.25.5. Financials (Based on Availability)
- 17.2.1 Tor Minerals International Inc
List of Figures
- Figure 1: Global Flame Retardant Chemicals Industry Revenue Breakdown (Billion, %) by Region 2024 & 2032
- Figure 2: Global Flame Retardant Chemicals Industry Volume Breakdown (K Tons, %) by Region 2024 & 2032
- Figure 3: North America Flame Retardant Chemicals Industry Revenue (Billion), by Country 2024 & 2032
- Figure 4: North America Flame Retardant Chemicals Industry Volume (K Tons), by Country 2024 & 2032
- Figure 5: North America Flame Retardant Chemicals Industry Revenue Share (%), by Country 2024 & 2032
- Figure 6: North America Flame Retardant Chemicals Industry Volume Share (%), by Country 2024 & 2032
- Figure 7: Europe Flame Retardant Chemicals Industry Revenue (Billion), by Country 2024 & 2032
- Figure 8: Europe Flame Retardant Chemicals Industry Volume (K Tons), by Country 2024 & 2032
- Figure 9: Europe Flame Retardant Chemicals Industry Revenue Share (%), by Country 2024 & 2032
- Figure 10: Europe Flame Retardant Chemicals Industry Volume Share (%), by Country 2024 & 2032
- Figure 11: Asia Pacific Flame Retardant Chemicals Industry Revenue (Billion), by Country 2024 & 2032
- Figure 12: Asia Pacific Flame Retardant Chemicals Industry Volume (K Tons), by Country 2024 & 2032
- Figure 13: Asia Pacific Flame Retardant Chemicals Industry Revenue Share (%), by Country 2024 & 2032
- Figure 14: Asia Pacific Flame Retardant Chemicals Industry Volume Share (%), by Country 2024 & 2032
- Figure 15: South America Flame Retardant Chemicals Industry Revenue (Billion), by Country 2024 & 2032
- Figure 16: South America Flame Retardant Chemicals Industry Volume (K Tons), by Country 2024 & 2032
- Figure 17: South America Flame Retardant Chemicals Industry Revenue Share (%), by Country 2024 & 2032
- Figure 18: South America Flame Retardant Chemicals Industry Volume Share (%), by Country 2024 & 2032
- Figure 19: MEA Flame Retardant Chemicals Industry Revenue (Billion), by Country 2024 & 2032
- Figure 20: MEA Flame Retardant Chemicals Industry Volume (K Tons), by Country 2024 & 2032
- Figure 21: MEA Flame Retardant Chemicals Industry Revenue Share (%), by Country 2024 & 2032
- Figure 22: MEA Flame Retardant Chemicals Industry Volume Share (%), by Country 2024 & 2032
- Figure 23: Asia Pacific Flame Retardant Chemicals Industry Revenue (Billion), by Product Type 2024 & 2032
- Figure 24: Asia Pacific Flame Retardant Chemicals Industry Volume (K Tons), by Product Type 2024 & 2032
- Figure 25: Asia Pacific Flame Retardant Chemicals Industry Revenue Share (%), by Product Type 2024 & 2032
- Figure 26: Asia Pacific Flame Retardant Chemicals Industry Volume Share (%), by Product Type 2024 & 2032
- Figure 27: Asia Pacific Flame Retardant Chemicals Industry Revenue (Billion), by End-user Industry 2024 & 2032
- Figure 28: Asia Pacific Flame Retardant Chemicals Industry Volume (K Tons), by End-user Industry 2024 & 2032
- Figure 29: Asia Pacific Flame Retardant Chemicals Industry Revenue Share (%), by End-user Industry 2024 & 2032
- Figure 30: Asia Pacific Flame Retardant Chemicals Industry Volume Share (%), by End-user Industry 2024 & 2032
- Figure 31: Asia Pacific Flame Retardant Chemicals Industry Revenue (Billion), by Country 2024 & 2032
- Figure 32: Asia Pacific Flame Retardant Chemicals Industry Volume (K Tons), by Country 2024 & 2032
- Figure 33: Asia Pacific Flame Retardant Chemicals Industry Revenue Share (%), by Country 2024 & 2032
- Figure 34: Asia Pacific Flame Retardant Chemicals Industry Volume Share (%), by Country 2024 & 2032
- Figure 35: North America Flame Retardant Chemicals Industry Revenue (Billion), by Product Type 2024 & 2032
- Figure 36: North America Flame Retardant Chemicals Industry Volume (K Tons), by Product Type 2024 & 2032
- Figure 37: North America Flame Retardant Chemicals Industry Revenue Share (%), by Product Type 2024 & 2032
- Figure 38: North America Flame Retardant Chemicals Industry Volume Share (%), by Product Type 2024 & 2032
- Figure 39: North America Flame Retardant Chemicals Industry Revenue (Billion), by End-user Industry 2024 & 2032
- Figure 40: North America Flame Retardant Chemicals Industry Volume (K Tons), by End-user Industry 2024 & 2032
- Figure 41: North America Flame Retardant Chemicals Industry Revenue Share (%), by End-user Industry 2024 & 2032
- Figure 42: North America Flame Retardant Chemicals Industry Volume Share (%), by End-user Industry 2024 & 2032
- Figure 43: North America Flame Retardant Chemicals Industry Revenue (Billion), by Country 2024 & 2032
- Figure 44: North America Flame Retardant Chemicals Industry Volume (K Tons), by Country 2024 & 2032
- Figure 45: North America Flame Retardant Chemicals Industry Revenue Share (%), by Country 2024 & 2032
- Figure 46: North America Flame Retardant Chemicals Industry Volume Share (%), by Country 2024 & 2032
- Figure 47: Europe Flame Retardant Chemicals Industry Revenue (Billion), by Product Type 2024 & 2032
- Figure 48: Europe Flame Retardant Chemicals Industry Volume (K Tons), by Product Type 2024 & 2032
- Figure 49: Europe Flame Retardant Chemicals Industry Revenue Share (%), by Product Type 2024 & 2032
- Figure 50: Europe Flame Retardant Chemicals Industry Volume Share (%), by Product Type 2024 & 2032
- Figure 51: Europe Flame Retardant Chemicals Industry Revenue (Billion), by End-user Industry 2024 & 2032
- Figure 52: Europe Flame Retardant Chemicals Industry Volume (K Tons), by End-user Industry 2024 & 2032
- Figure 53: Europe Flame Retardant Chemicals Industry Revenue Share (%), by End-user Industry 2024 & 2032
- Figure 54: Europe Flame Retardant Chemicals Industry Volume Share (%), by End-user Industry 2024 & 2032
- Figure 55: Europe Flame Retardant Chemicals Industry Revenue (Billion), by Country 2024 & 2032
- Figure 56: Europe Flame Retardant Chemicals Industry Volume (K Tons), by Country 2024 & 2032
- Figure 57: Europe Flame Retardant Chemicals Industry Revenue Share (%), by Country 2024 & 2032
- Figure 58: Europe Flame Retardant Chemicals Industry Volume Share (%), by Country 2024 & 2032
- Figure 59: South America Flame Retardant Chemicals Industry Revenue (Billion), by Product Type 2024 & 2032
- Figure 60: South America Flame Retardant Chemicals Industry Volume (K Tons), by Product Type 2024 & 2032
- Figure 61: South America Flame Retardant Chemicals Industry Revenue Share (%), by Product Type 2024 & 2032
- Figure 62: South America Flame Retardant Chemicals Industry Volume Share (%), by Product Type 2024 & 2032
- Figure 63: South America Flame Retardant Chemicals Industry Revenue (Billion), by End-user Industry 2024 & 2032
- Figure 64: South America Flame Retardant Chemicals Industry Volume (K Tons), by End-user Industry 2024 & 2032
- Figure 65: South America Flame Retardant Chemicals Industry Revenue Share (%), by End-user Industry 2024 & 2032
- Figure 66: South America Flame Retardant Chemicals Industry Volume Share (%), by End-user Industry 2024 & 2032
- Figure 67: South America Flame Retardant Chemicals Industry Revenue (Billion), by Country 2024 & 2032
- Figure 68: South America Flame Retardant Chemicals Industry Volume (K Tons), by Country 2024 & 2032
- Figure 69: South America Flame Retardant Chemicals Industry Revenue Share (%), by Country 2024 & 2032
- Figure 70: South America Flame Retardant Chemicals Industry Volume Share (%), by Country 2024 & 2032
- Figure 71: Middle East Flame Retardant Chemicals Industry Revenue (Billion), by Product Type 2024 & 2032
- Figure 72: Middle East Flame Retardant Chemicals Industry Volume (K Tons), by Product Type 2024 & 2032
- Figure 73: Middle East Flame Retardant Chemicals Industry Revenue Share (%), by Product Type 2024 & 2032
- Figure 74: Middle East Flame Retardant Chemicals Industry Volume Share (%), by Product Type 2024 & 2032
- Figure 75: Middle East Flame Retardant Chemicals Industry Revenue (Billion), by End-user Industry 2024 & 2032
- Figure 76: Middle East Flame Retardant Chemicals Industry Volume (K Tons), by End-user Industry 2024 & 2032
- Figure 77: Middle East Flame Retardant Chemicals Industry Revenue Share (%), by End-user Industry 2024 & 2032
- Figure 78: Middle East Flame Retardant Chemicals Industry Volume Share (%), by End-user Industry 2024 & 2032
- Figure 79: Middle East Flame Retardant Chemicals Industry Revenue (Billion), by Country 2024 & 2032
- Figure 80: Middle East Flame Retardant Chemicals Industry Volume (K Tons), by Country 2024 & 2032
- Figure 81: Middle East Flame Retardant Chemicals Industry Revenue Share (%), by Country 2024 & 2032
- Figure 82: Middle East Flame Retardant Chemicals Industry Volume Share (%), by Country 2024 & 2032
- Figure 83: Saudi Arabia Flame Retardant Chemicals Industry Revenue (Billion), by Product Type 2024 & 2032
- Figure 84: Saudi Arabia Flame Retardant Chemicals Industry Volume (K Tons), by Product Type 2024 & 2032
- Figure 85: Saudi Arabia Flame Retardant Chemicals Industry Revenue Share (%), by Product Type 2024 & 2032
- Figure 86: Saudi Arabia Flame Retardant Chemicals Industry Volume Share (%), by Product Type 2024 & 2032
- Figure 87: Saudi Arabia Flame Retardant Chemicals Industry Revenue (Billion), by End-user Industry 2024 & 2032
- Figure 88: Saudi Arabia Flame Retardant Chemicals Industry Volume (K Tons), by End-user Industry 2024 & 2032
- Figure 89: Saudi Arabia Flame Retardant Chemicals Industry Revenue Share (%), by End-user Industry 2024 & 2032
- Figure 90: Saudi Arabia Flame Retardant Chemicals Industry Volume Share (%), by End-user Industry 2024 & 2032
- Figure 91: Saudi Arabia Flame Retardant Chemicals Industry Revenue (Billion), by Country 2024 & 2032
- Figure 92: Saudi Arabia Flame Retardant Chemicals Industry Volume (K Tons), by Country 2024 & 2032
- Figure 93: Saudi Arabia Flame Retardant Chemicals Industry Revenue Share (%), by Country 2024 & 2032
- Figure 94: Saudi Arabia Flame Retardant Chemicals Industry Volume Share (%), by Country 2024 & 2032
List of Tables
- Table 1: Global Flame Retardant Chemicals Industry Revenue Billion Forecast, by Region 2019 & 2032
- Table 2: Global Flame Retardant Chemicals Industry Volume K Tons Forecast, by Region 2019 & 2032
- Table 3: Global Flame Retardant Chemicals Industry Revenue Billion Forecast, by Product Type 2019 & 2032
- Table 4: Global Flame Retardant Chemicals Industry Volume K Tons Forecast, by Product Type 2019 & 2032
- Table 5: Global Flame Retardant Chemicals Industry Revenue Billion Forecast, by End-user Industry 2019 & 2032
- Table 6: Global Flame Retardant Chemicals Industry Volume K Tons Forecast, by End-user Industry 2019 & 2032
- Table 7: Global Flame Retardant Chemicals Industry Revenue Billion Forecast, by Region 2019 & 2032
- Table 8: Global Flame Retardant Chemicals Industry Volume K Tons Forecast, by Region 2019 & 2032
- Table 9: Global Flame Retardant Chemicals Industry Revenue Billion Forecast, by Country 2019 & 2032
- Table 10: Global Flame Retardant Chemicals Industry Volume K Tons Forecast, by Country 2019 & 2032
- Table 11: United States Flame Retardant Chemicals Industry Revenue (Billion) Forecast, by Application 2019 & 2032
- Table 12: United States Flame Retardant Chemicals Industry Volume (K Tons) Forecast, by Application 2019 & 2032
- Table 13: Canada Flame Retardant Chemicals Industry Revenue (Billion) Forecast, by Application 2019 & 2032
- Table 14: Canada Flame Retardant Chemicals Industry Volume (K Tons) Forecast, by Application 2019 & 2032
- Table 15: Mexico Flame Retardant Chemicals Industry Revenue (Billion) Forecast, by Application 2019 & 2032
- Table 16: Mexico Flame Retardant Chemicals Industry Volume (K Tons) Forecast, by Application 2019 & 2032
- Table 17: Global Flame Retardant Chemicals Industry Revenue Billion Forecast, by Country 2019 & 2032
- Table 18: Global Flame Retardant Chemicals Industry Volume K Tons Forecast, by Country 2019 & 2032
- Table 19: Germany Flame Retardant Chemicals Industry Revenue (Billion) Forecast, by Application 2019 & 2032
- Table 20: Germany Flame Retardant Chemicals Industry Volume (K Tons) Forecast, by Application 2019 & 2032
- Table 21: France Flame Retardant Chemicals Industry Revenue (Billion) Forecast, by Application 2019 & 2032
- Table 22: France Flame Retardant Chemicals Industry Volume (K Tons) Forecast, by Application 2019 & 2032
- Table 23: Italy Flame Retardant Chemicals Industry Revenue (Billion) Forecast, by Application 2019 & 2032
- Table 24: Italy Flame Retardant Chemicals Industry Volume (K Tons) Forecast, by Application 2019 & 2032
- Table 25: United Kingdom Flame Retardant Chemicals Industry Revenue (Billion) Forecast, by Application 2019 & 2032
- Table 26: United Kingdom Flame Retardant Chemicals Industry Volume (K Tons) Forecast, by Application 2019 & 2032
- Table 27: Netherlands Flame Retardant Chemicals Industry Revenue (Billion) Forecast, by Application 2019 & 2032
- Table 28: Netherlands Flame Retardant Chemicals Industry Volume (K Tons) Forecast, by Application 2019 & 2032
- Table 29: Rest of Europe Flame Retardant Chemicals Industry Revenue (Billion) Forecast, by Application 2019 & 2032
- Table 30: Rest of Europe Flame Retardant Chemicals Industry Volume (K Tons) Forecast, by Application 2019 & 2032
- Table 31: Global Flame Retardant Chemicals Industry Revenue Billion Forecast, by Country 2019 & 2032
- Table 32: Global Flame Retardant Chemicals Industry Volume K Tons Forecast, by Country 2019 & 2032
- Table 33: China Flame Retardant Chemicals Industry Revenue (Billion) Forecast, by Application 2019 & 2032
- Table 34: China Flame Retardant Chemicals Industry Volume (K Tons) Forecast, by Application 2019 & 2032
- Table 35: Japan Flame Retardant Chemicals Industry Revenue (Billion) Forecast, by Application 2019 & 2032
- Table 36: Japan Flame Retardant Chemicals Industry Volume (K Tons) Forecast, by Application 2019 & 2032
- Table 37: India Flame Retardant Chemicals Industry Revenue (Billion) Forecast, by Application 2019 & 2032
- Table 38: India Flame Retardant Chemicals Industry Volume (K Tons) Forecast, by Application 2019 & 2032
- Table 39: South Korea Flame Retardant Chemicals Industry Revenue (Billion) Forecast, by Application 2019 & 2032
- Table 40: South Korea Flame Retardant Chemicals Industry Volume (K Tons) Forecast, by Application 2019 & 2032
- Table 41: Taiwan Flame Retardant Chemicals Industry Revenue (Billion) Forecast, by Application 2019 & 2032
- Table 42: Taiwan Flame Retardant Chemicals Industry Volume (K Tons) Forecast, by Application 2019 & 2032
- Table 43: Australia Flame Retardant Chemicals Industry Revenue (Billion) Forecast, by Application 2019 & 2032
- Table 44: Australia Flame Retardant Chemicals Industry Volume (K Tons) Forecast, by Application 2019 & 2032
- Table 45: Rest of Asia-Pacific Flame Retardant Chemicals Industry Revenue (Billion) Forecast, by Application 2019 & 2032
- Table 46: Rest of Asia-Pacific Flame Retardant Chemicals Industry Volume (K Tons) Forecast, by Application 2019 & 2032
- Table 47: Global Flame Retardant Chemicals Industry Revenue Billion Forecast, by Country 2019 & 2032
- Table 48: Global Flame Retardant Chemicals Industry Volume K Tons Forecast, by Country 2019 & 2032
- Table 49: Brazil Flame Retardant Chemicals Industry Revenue (Billion) Forecast, by Application 2019 & 2032
- Table 50: Brazil Flame Retardant Chemicals Industry Volume (K Tons) Forecast, by Application 2019 & 2032
- Table 51: Argentina Flame Retardant Chemicals Industry Revenue (Billion) Forecast, by Application 2019 & 2032
- Table 52: Argentina Flame Retardant Chemicals Industry Volume (K Tons) Forecast, by Application 2019 & 2032
- Table 53: Rest of South America Flame Retardant Chemicals Industry Revenue (Billion) Forecast, by Application 2019 & 2032
- Table 54: Rest of South America Flame Retardant Chemicals Industry Volume (K Tons) Forecast, by Application 2019 & 2032
- Table 55: Global Flame Retardant Chemicals Industry Revenue Billion Forecast, by Country 2019 & 2032
- Table 56: Global Flame Retardant Chemicals Industry Volume K Tons Forecast, by Country 2019 & 2032
- Table 57: Middle East Flame Retardant Chemicals Industry Revenue (Billion) Forecast, by Application 2019 & 2032
- Table 58: Middle East Flame Retardant Chemicals Industry Volume (K Tons) Forecast, by Application 2019 & 2032
- Table 59: Africa Flame Retardant Chemicals Industry Revenue (Billion) Forecast, by Application 2019 & 2032
- Table 60: Africa Flame Retardant Chemicals Industry Volume (K Tons) Forecast, by Application 2019 & 2032
- Table 61: Global Flame Retardant Chemicals Industry Revenue Billion Forecast, by Product Type 2019 & 2032
- Table 62: Global Flame Retardant Chemicals Industry Volume K Tons Forecast, by Product Type 2019 & 2032
- Table 63: Global Flame Retardant Chemicals Industry Revenue Billion Forecast, by End-user Industry 2019 & 2032
- Table 64: Global Flame Retardant Chemicals Industry Volume K Tons Forecast, by End-user Industry 2019 & 2032
- Table 65: Global Flame Retardant Chemicals Industry Revenue Billion Forecast, by Country 2019 & 2032
- Table 66: Global Flame Retardant Chemicals Industry Volume K Tons Forecast, by Country 2019 & 2032
- Table 67: China Flame Retardant Chemicals Industry Revenue (Billion) Forecast, by Application 2019 & 2032
- Table 68: China Flame Retardant Chemicals Industry Volume (K Tons) Forecast, by Application 2019 & 2032
- Table 69: India Flame Retardant Chemicals Industry Revenue (Billion) Forecast, by Application 2019 & 2032
- Table 70: India Flame Retardant Chemicals Industry Volume (K Tons) Forecast, by Application 2019 & 2032
- Table 71: Japan Flame Retardant Chemicals Industry Revenue (Billion) Forecast, by Application 2019 & 2032
- Table 72: Japan Flame Retardant Chemicals Industry Volume (K Tons) Forecast, by Application 2019 & 2032
- Table 73: South Korea Flame Retardant Chemicals Industry Revenue (Billion) Forecast, by Application 2019 & 2032
- Table 74: South Korea Flame Retardant Chemicals Industry Volume (K Tons) Forecast, by Application 2019 & 2032
- Table 75: Australia and New Zealand Flame Retardant Chemicals Industry Revenue (Billion) Forecast, by Application 2019 & 2032
- Table 76: Australia and New Zealand Flame Retardant Chemicals Industry Volume (K Tons) Forecast, by Application 2019 & 2032
- Table 77: Rest of Asia Pacific Flame Retardant Chemicals Industry Revenue (Billion) Forecast, by Application 2019 & 2032
- Table 78: Rest of Asia Pacific Flame Retardant Chemicals Industry Volume (K Tons) Forecast, by Application 2019 & 2032
- Table 79: Global Flame Retardant Chemicals Industry Revenue Billion Forecast, by Product Type 2019 & 2032
- Table 80: Global Flame Retardant Chemicals Industry Volume K Tons Forecast, by Product Type 2019 & 2032
- Table 81: Global Flame Retardant Chemicals Industry Revenue Billion Forecast, by End-user Industry 2019 & 2032
- Table 82: Global Flame Retardant Chemicals Industry Volume K Tons Forecast, by End-user Industry 2019 & 2032
- Table 83: Global Flame Retardant Chemicals Industry Revenue Billion Forecast, by Country 2019 & 2032
- Table 84: Global Flame Retardant Chemicals Industry Volume K Tons Forecast, by Country 2019 & 2032
- Table 85: United States Flame Retardant Chemicals Industry Revenue (Billion) Forecast, by Application 2019 & 2032
- Table 86: United States Flame Retardant Chemicals Industry Volume (K Tons) Forecast, by Application 2019 & 2032
- Table 87: Canada Flame Retardant Chemicals Industry Revenue (Billion) Forecast, by Application 2019 & 2032
- Table 88: Canada Flame Retardant Chemicals Industry Volume (K Tons) Forecast, by Application 2019 & 2032
- Table 89: Mexico Flame Retardant Chemicals Industry Revenue (Billion) Forecast, by Application 2019 & 2032
- Table 90: Mexico Flame Retardant Chemicals Industry Volume (K Tons) Forecast, by Application 2019 & 2032
- Table 91: Rest of North America Flame Retardant Chemicals Industry Revenue (Billion) Forecast, by Application 2019 & 2032
- Table 92: Rest of North America Flame Retardant Chemicals Industry Volume (K Tons) Forecast, by Application 2019 & 2032
- Table 93: Global Flame Retardant Chemicals Industry Revenue Billion Forecast, by Product Type 2019 & 2032
- Table 94: Global Flame Retardant Chemicals Industry Volume K Tons Forecast, by Product Type 2019 & 2032
- Table 95: Global Flame Retardant Chemicals Industry Revenue Billion Forecast, by End-user Industry 2019 & 2032
- Table 96: Global Flame Retardant Chemicals Industry Volume K Tons Forecast, by End-user Industry 2019 & 2032
- Table 97: Global Flame Retardant Chemicals Industry Revenue Billion Forecast, by Country 2019 & 2032
- Table 98: Global Flame Retardant Chemicals Industry Volume K Tons Forecast, by Country 2019 & 2032
- Table 99: Germany Flame Retardant Chemicals Industry Revenue (Billion) Forecast, by Application 2019 & 2032
- Table 100: Germany Flame Retardant Chemicals Industry Volume (K Tons) Forecast, by Application 2019 & 2032
- Table 101: United Kingdom Flame Retardant Chemicals Industry Revenue (Billion) Forecast, by Application 2019 & 2032
- Table 102: United Kingdom Flame Retardant Chemicals Industry Volume (K Tons) Forecast, by Application 2019 & 2032
- Table 103: Italy Flame Retardant Chemicals Industry Revenue (Billion) Forecast, by Application 2019 & 2032
- Table 104: Italy Flame Retardant Chemicals Industry Volume (K Tons) Forecast, by Application 2019 & 2032
- Table 105: France Flame Retardant Chemicals Industry Revenue (Billion) Forecast, by Application 2019 & 2032
- Table 106: France Flame Retardant Chemicals Industry Volume (K Tons) Forecast, by Application 2019 & 2032
- Table 107: Spain Flame Retardant Chemicals Industry Revenue (Billion) Forecast, by Application 2019 & 2032
- Table 108: Spain Flame Retardant Chemicals Industry Volume (K Tons) Forecast, by Application 2019 & 2032
- Table 109: Rest of Europe Flame Retardant Chemicals Industry Revenue (Billion) Forecast, by Application 2019 & 2032
- Table 110: Rest of Europe Flame Retardant Chemicals Industry Volume (K Tons) Forecast, by Application 2019 & 2032
- Table 111: Global Flame Retardant Chemicals Industry Revenue Billion Forecast, by Product Type 2019 & 2032
- Table 112: Global Flame Retardant Chemicals Industry Volume K Tons Forecast, by Product Type 2019 & 2032
- Table 113: Global Flame Retardant Chemicals Industry Revenue Billion Forecast, by End-user Industry 2019 & 2032
- Table 114: Global Flame Retardant Chemicals Industry Volume K Tons Forecast, by End-user Industry 2019 & 2032
- Table 115: Global Flame Retardant Chemicals Industry Revenue Billion Forecast, by Country 2019 & 2032
- Table 116: Global Flame Retardant Chemicals Industry Volume K Tons Forecast, by Country 2019 & 2032
- Table 117: Brazil Flame Retardant Chemicals Industry Revenue (Billion) Forecast, by Application 2019 & 2032
- Table 118: Brazil Flame Retardant Chemicals Industry Volume (K Tons) Forecast, by Application 2019 & 2032
- Table 119: Argentina Flame Retardant Chemicals Industry Revenue (Billion) Forecast, by Application 2019 & 2032
- Table 120: Argentina Flame Retardant Chemicals Industry Volume (K Tons) Forecast, by Application 2019 & 2032
- Table 121: Rest of South America Flame Retardant Chemicals Industry Revenue (Billion) Forecast, by Application 2019 & 2032
- Table 122: Rest of South America Flame Retardant Chemicals Industry Volume (K Tons) Forecast, by Application 2019 & 2032
- Table 123: Global Flame Retardant Chemicals Industry Revenue Billion Forecast, by Product Type 2019 & 2032
- Table 124: Global Flame Retardant Chemicals Industry Volume K Tons Forecast, by Product Type 2019 & 2032
- Table 125: Global Flame Retardant Chemicals Industry Revenue Billion Forecast, by End-user Industry 2019 & 2032
- Table 126: Global Flame Retardant Chemicals Industry Volume K Tons Forecast, by End-user Industry 2019 & 2032
- Table 127: Global Flame Retardant Chemicals Industry Revenue Billion Forecast, by Country 2019 & 2032
- Table 128: Global Flame Retardant Chemicals Industry Volume K Tons Forecast, by Country 2019 & 2032
- Table 129: Global Flame Retardant Chemicals Industry Revenue Billion Forecast, by Product Type 2019 & 2032
- Table 130: Global Flame Retardant Chemicals Industry Volume K Tons Forecast, by Product Type 2019 & 2032
- Table 131: Global Flame Retardant Chemicals Industry Revenue Billion Forecast, by End-user Industry 2019 & 2032
- Table 132: Global Flame Retardant Chemicals Industry Volume K Tons Forecast, by End-user Industry 2019 & 2032
- Table 133: Global Flame Retardant Chemicals Industry Revenue Billion Forecast, by Country 2019 & 2032
- Table 134: Global Flame Retardant Chemicals Industry Volume K Tons Forecast, by Country 2019 & 2032
- Table 135: South Africa Flame Retardant Chemicals Industry Revenue (Billion) Forecast, by Application 2019 & 2032
- Table 136: South Africa Flame Retardant Chemicals Industry Volume (K Tons) Forecast, by Application 2019 & 2032
- Table 137: Qatar Flame Retardant Chemicals Industry Revenue (Billion) Forecast, by Application 2019 & 2032
- Table 138: Qatar Flame Retardant Chemicals Industry Volume (K Tons) Forecast, by Application 2019 & 2032
- Table 139: Rest of Middle East Flame Retardant Chemicals Industry Revenue (Billion) Forecast, by Application 2019 & 2032
- Table 140: Rest of Middle East Flame Retardant Chemicals Industry Volume (K Tons) Forecast, by Application 2019 & 2032
Frequently Asked Questions
1. What is the projected Compound Annual Growth Rate (CAGR) of the Flame Retardant Chemicals Industry?
The projected CAGR is approximately 5.2%.
2. Which companies are prominent players in the Flame Retardant Chemicals Industry?
Key companies in the market include Tor Minerals International Inc, Clariant, Jiangsu Jacques Technology Co Ltd, MPI Chemie BV, UFP Industries Inc, Italmatch Chemicals SpA, LANXESS, Kemipex, BASF SE, Tosoh Corporation, RTP Company, Dow, DAIHACHI CHEMICAL INDUSTRY CO LTD, Sanwa Chemical Co Ltd, Nabaltec AG, Thor, ICL Group, DIC CORPORATION, Shandong Brother Sci & Tech Co Ltd, J M Huber Corporation, Albemarle Corporation, Nyacol Nano Technologies Inc, Eti Maden, Apexical Inc, RIN KAGAKU KOGYO Co Ltd.
3. What are the main segments of the Flame Retardant Chemicals Industry?
The market segments include Product Type, End-user Industry.
4. Can you provide details about the market size?
The market size is estimated to be USD 7.2 Billion as of 2022.
5. What are some drivers contributing to market growth?
Increasing Infrastructure Activities in Asia-Pacific; Rise in Safety Standards in Building Construction; Rising Consumer Electrical and Electronic Goods Manufacturing.
6. What are the notable trends driving market growth?
Building and Construction Segment to Dominate the Market.
7. Are there any restraints impacting market growth?
Environmental and Health Concerns Regarding Brominated and Halogenated Flame Retardants.
8. Can you provide examples of recent developments in the market?
In September 2022, LANXESS launched new phosphorous-based flame retardants which have unique properties such as thermal and mechanical stability and are compatible with engineering plastics.
9. What pricing options are available for accessing the report?
Pricing options include single-user, multi-user, and enterprise licenses priced at USD 3,950, USD 4,950, and USD 6,950 respectively.
10. Is the market size provided in terms of value or volume?
The market size is provided in terms of value, measured in Billion and volume, measured in K Tons.
11. Are there any specific market keywords associated with the report?
Yes, the market keyword associated with the report is "Flame Retardant Chemicals Industry," which aids in identifying and referencing the specific market segment covered.
12. How do I determine which pricing option suits my needs best?
The pricing options vary based on user requirements and access needs. Individual users may opt for single-user licenses, while businesses requiring broader access may choose multi-user or enterprise licenses for cost-effective access to the report.
13. Are there any additional resources or data provided in the Flame Retardant Chemicals Industry report?
While the report offers comprehensive insights, it's advisable to review the specific contents or supplementary materials provided to ascertain if additional resources or data are available.
14. How can I stay updated on further developments or reports in the Flame Retardant Chemicals Industry?
To stay informed about further developments, trends, and reports in the Flame Retardant Chemicals Industry, consider subscribing to industry newsletters, following relevant companies and organizations, or regularly checking reputable industry news sources and publications.
Methodology
Step 1 - Identification of Relevant Samples Size from Population Database


Step 2 - Approaches for Defining Global Market Size (Value, Volume* & Price*)

Note*: In applicable scenarios
Step 3 - Data Sources
Primary Research
- Web Analytics
- Survey Reports
- Research Institute
- Latest Research Reports
- Opinion Leaders
Secondary Research
- Annual Reports
- White Paper
- Latest Press Release
- Industry Association
- Paid Database
- Investor Presentations

Step 4 - Data Triangulation
Involves using different sources of information in order to increase the validity of a study
These sources are likely to be stakeholders in a program - participants, other researchers, program staff, other community members, and so on.
Then we put all data in single framework & apply various statistical tools to find out the dynamic on the market.
During the analysis stage, feedback from the stakeholder groups would be compared to determine areas of agreement as well as areas of divergence


