

Key Insights
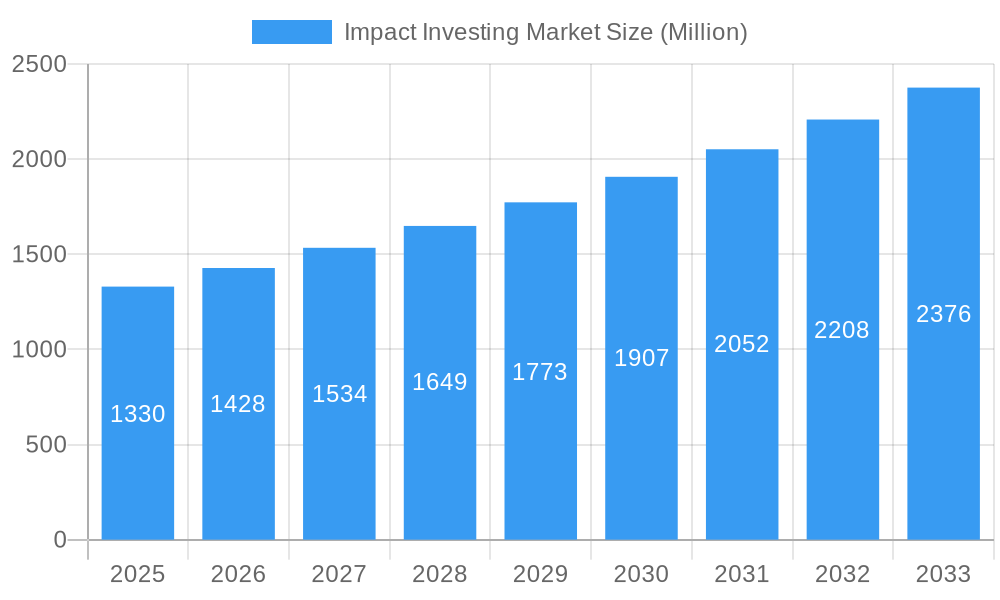
The impact investing market, valued at $1.33 billion in 2025, is projected to experience robust growth, exhibiting a Compound Annual Growth Rate (CAGR) of 7.17% from 2025 to 2033. This expansion is driven by several key factors. Increasing awareness of Environmental, Social, and Governance (ESG) factors among investors is a major catalyst, pushing capital towards ventures with demonstrable positive social and environmental impact. Furthermore, the growing demand for sustainable and ethical investment options from both individual and institutional investors fuels market expansion. Governments worldwide are also actively promoting impact investing through policy incentives and regulations, further bolstering market growth. The market is segmented by various investment strategies, including venture philanthropy, community development finance institutions (CDFIs), and social impact bonds, each attracting a distinct investor base and catering to specific impact goals. Key players such as Vital Capital, BlueOrchard Finance, BlackRock, and Goldman Sachs are driving innovation and expanding the reach of impact investing through their diverse portfolios and expertise. The market is geographically diverse, with North America and Europe currently holding significant shares, but emerging markets are exhibiting rapid growth potential.
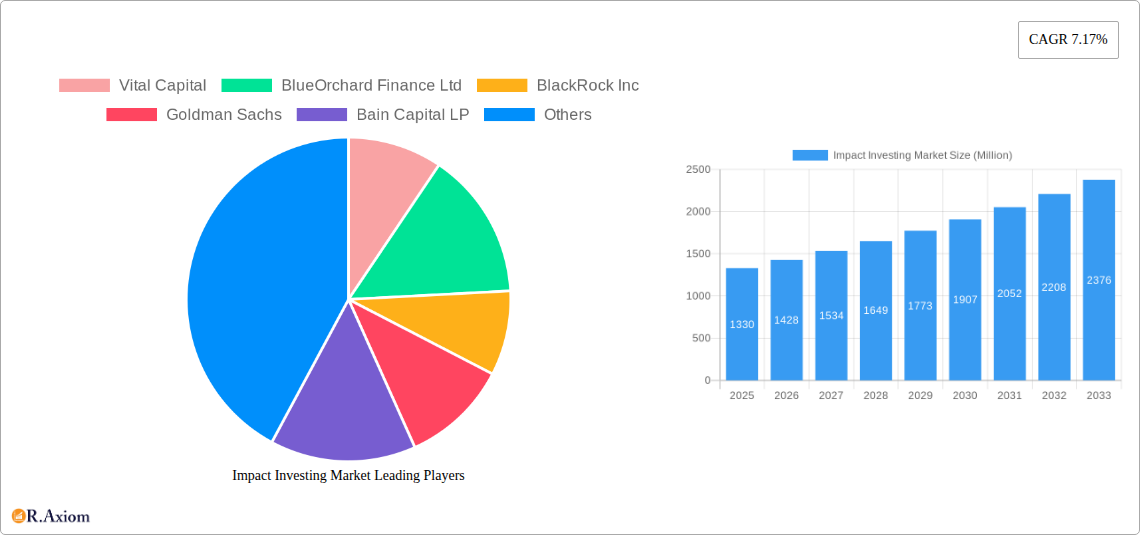
Impact Investing Market Market Size (In Billion)
The market's growth trajectory, however, is not without challenges. Regulatory complexities and the difficulty in measuring and verifying social and environmental impact remain significant hurdles. Furthermore, a lack of standardized reporting frameworks can hinder transparency and attract investment. Despite these restraints, the long-term outlook for the impact investing market remains positive. The increasing sophistication of impact measurement tools and the growing availability of data will enhance investor confidence. The continuing rise of sustainable consumption patterns and technological advancements will further open avenues for impactful investments across sectors like renewable energy, sustainable agriculture, and affordable housing. The market's continued expansion will likely be shaped by the collaboration between investors, businesses, and governments to create a more sustainable and equitable future.
Impact Investing Market Company Market Share
Impact Investing Market: A Comprehensive Report (2019-2033)
This detailed report provides a comprehensive analysis of the Impact Investing Market, covering market size, segmentation, key players, growth drivers, challenges, and future opportunities. The study period spans from 2019 to 2033, with 2025 serving as the base and estimated year. The forecast period is 2025-2033, and the historical period encompasses 2019-2024. The report incorporates data on key market players like Vital Capital, BlueOrchard Finance Ltd, BlackRock Inc, Goldman Sachs, Bain Capital LP, Morgan Stanley, Prudential Financial Inc, Manulife Investment Management Holdings (Canada) Inc, Leapfrog Investments, and Community Investment Management LLC (list not exhaustive). This in-depth analysis is crucial for investors, industry stakeholders, and strategic decision-makers seeking to understand and capitalize on the growth potential within this dynamic sector.
Impact Investing Market Market Concentration & Innovation
The Impact Investing market exhibits a moderately concentrated landscape, with a few major players holding significant market share. However, the market is also characterized by a high degree of innovation, driven by the increasing demand for sustainable and responsible investments. BlackRock Inc., Goldman Sachs, and Bain Capital LP are among the leading players, impacting market concentration through strategic acquisitions and expansion into various segments. Mergers and acquisitions (M&A) activity is a prominent feature, with deal values reaching into the billions of USD. For example, BlackRock's acquisition of GIP in January 2024, valued at USD 3 billion, significantly altered market dynamics.
- Market Share: BlackRock Inc. and Goldman Sachs command a substantial share, estimated at xx% and xx% respectively in 2025. The remaining market share is distributed among numerous smaller players and emerging firms.
- M&A Activity: Significant M&A activity is observed, with deal values exceeding USD xx billion in the past five years. These transactions reflect consolidation and the expansion of key players into new areas.
- Innovation Drivers: Growing awareness of Environmental, Social, and Governance (ESG) factors, coupled with technological advancements in impact measurement and reporting, are key innovation drivers. Regulatory frameworks, although still evolving, are creating a more conducive environment for impact investing.
- Regulatory Frameworks: Varying regulatory landscapes across different jurisdictions influence market growth and investment strategies. Harmonization of regulatory frameworks is anticipated to boost market expansion.
- Product Substitutes: Traditional investment vehicles pose the main form of competition; however, the appeal of impact investing as a sustainable, responsible approach is attracting increasing investor interest.
- End-User Trends: Institutional investors, high-net-worth individuals, and retail investors are increasingly incorporating impact investing strategies into their portfolios. This signifies growing end-user acceptance and demand.
Impact Investing Market Industry Trends & Insights
The Impact Investing market is experiencing robust growth, driven by several key factors. The increasing awareness of ESG factors, the growing demand for sustainable and responsible investments, and technological advancements in impact measurement are key catalysts. The market is expected to witness a Compound Annual Growth Rate (CAGR) of xx% during the forecast period (2025-2033), indicating significant expansion potential. Market penetration is gradually increasing across diverse industries, including renewable energy, affordable housing, and sustainable agriculture. Consumer preferences are shifting towards investments that align with their values and contribute to positive social and environmental outcomes. Competitive dynamics are characterized by both cooperation and competition, as firms seek to establish leadership positions in specific impact niches. Technological disruptions such as blockchain technology, AI-powered impact measurement tools, and fintech platforms are enhancing transparency, efficiency, and accessibility within the impact investing ecosystem.
Dominant Markets & Segments in Impact Investing Market
The North American region holds the leading position in the Impact Investing market, fueled by robust regulatory frameworks, a strong investor base, and a significant focus on ESG investing. Within North America, the United States exhibits the highest market share, due to factors including the robust venture capital ecosystem and high philanthropic activities. However, European markets are witnessing significant growth, driven by supportive policies and increasing awareness of sustainable finance.
- Key Drivers for North American Dominance:
- Strong regulatory frameworks promoting ESG investing.
- Large and sophisticated investor base.
- Significant philanthropic activities.
- Development of a robust venture capital ecosystem.
- Key Drivers for European Growth:
- Supportive government policies and initiatives.
- Increasing investor interest in sustainable finance.
- Development of specialized impact investment funds.
Impact Investing Market Product Developments
Recent product innovations focus on enhancing impact measurement and reporting, improving transparency, and creating more accessible investment vehicles. Technological advancements are facilitating the integration of data analytics and AI to improve the efficiency of impact investing strategies. The market is witnessing the development of innovative financial instruments and blended finance models that cater to specific impact objectives. These innovations are improving the market fit and competitive advantages for companies operating in the space.
Report Scope & Segmentation Analysis
This report segments the Impact Investing market based on investment strategy (e.g., venture philanthropy, private equity, debt financing), investment sector (e.g., renewable energy, affordable housing, healthcare), and geography. Each segment presents unique growth projections, market sizes, and competitive dynamics. The growth rates vary across segments, with renewable energy and sustainable agriculture demonstrating faster expansion compared to others. Competitive intensity differs depending on the segment's maturity and attractiveness.
Key Drivers of Impact Investing Market Growth
Several factors drive the growth of the Impact Investing market. Increased awareness of ESG issues among investors and consumers is a key driver. Government policies and regulations promoting sustainable finance are further boosting market growth. Technological advancements enabling efficient impact measurement are streamlining processes and attracting more investors. The expanding global middle class, with increased disposable income and a greater focus on social and environmental responsibility, also contributes to market growth.
Challenges in the Impact Investing Market Sector
The Impact Investing market faces certain challenges. Lack of standardized impact measurement and reporting creates inconsistencies in assessing the true impact of investments. The complexity of impact investing products can pose barriers to entry for new investors. The limited availability of reliable data on social and environmental impacts hinders effective decision-making and strategic planning. These obstacles affect the market's growth potential.
Emerging Opportunities in Impact Investing Market
The Impact Investing market offers several promising opportunities. The rise of fintech and blockchain technology is facilitating the development of innovative investment platforms. The growing demand for impact-focused data analytics and advisory services presents lucrative opportunities. Expanding into emerging markets with significant unmet social and environmental needs offers considerable growth potential. Moreover, increased focus on climate change mitigation and adaptation is expected to drive further investments.
Leading Players in the Impact Investing Market Market
Key Developments in Impact Investing Market Industry
- August 2023: BlackRock Inc. acquired Kreos Capital, expanding its presence in the growth and venture debt financing market for technology and healthcare companies.
- January 2024: Staley Point Capital and Bain Capital Real Estate completed the sale of a 91,000 sq ft industrial property in California for USD 38.4 Million, highlighting strong demand in the sector.
- January 2024: BlackRock Inc. acquired Global Infrastructure Partners (GIP) for USD 3 billion in cash and 12 million shares, showcasing significant consolidation in the market.
Strategic Outlook for Impact Investing Market Market
The Impact Investing market is poised for substantial growth, driven by increasing awareness of ESG factors, supportive regulatory frameworks, and technological advancements. The expanding base of impact investors, coupled with the increasing availability of innovative financial products, suggests a positive outlook for market expansion in the coming years. The market’s future potential lies in leveraging technology, broadening access to impact investments, and developing innovative solutions for measuring and reporting social and environmental impact effectively.
Impact Investing Market Segmentation
-
1. Type
- 1.1. Institutional Investors
- 1.2. Individual Investors
-
2. End User
- 2.1. Education
- 2.2. Agriculture
- 2.3. Healthcare
- 2.4. Climate Tech
Impact Investing Market Segmentation By Geography
-
1. North America
- 1.1. United States
- 1.2. Canada
- 1.3. Mexico
-
2. South America
- 2.1. Brazil
- 2.2. Argentina
- 2.3. Rest of South America
-
3. Europe
- 3.1. United Kingdom
- 3.2. Germany
- 3.3. France
- 3.4. Italy
- 3.5. Spain
- 3.6. Russia
- 3.7. Benelux
- 3.8. Nordics
- 3.9. Rest of Europe
-
4. Middle East & Africa
- 4.1. Turkey
- 4.2. Israel
- 4.3. GCC
- 4.4. North Africa
- 4.5. South Africa
- 4.6. Rest of Middle East & Africa
-
5. Asia Pacific
- 5.1. China
- 5.2. India
- 5.3. Japan
- 5.4. South Korea
- 5.5. ASEAN
- 5.6. Oceania
- 5.7. Rest of Asia Pacific
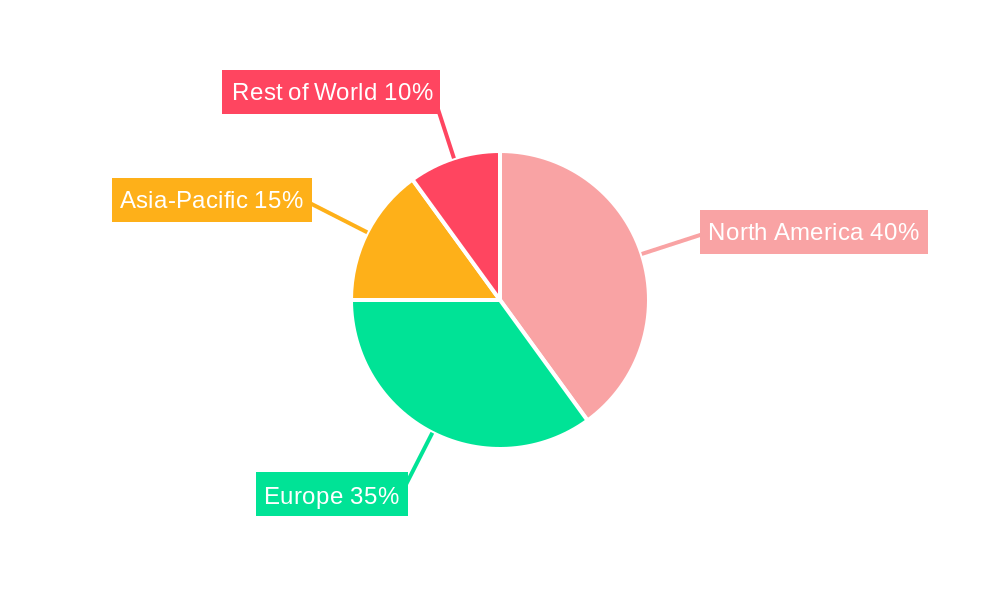
Impact Investing Market Regional Market Share
Geographic Coverage of Impact Investing Market
Impact Investing Market REPORT HIGHLIGHTS
| Aspects | Details |
|---|---|
| Study Period | 2020-2034 |
| Base Year | 2025 |
| Estimated Year | 2026 |
| Forecast Period | 2026-2034 |
| Historical Period | 2020-2025 |
| Growth Rate | CAGR of 7.17% from 2020-2034 |
| Segmentation |
|
Table of Contents
- 1. Introduction
- 1.1. Research Scope
- 1.2. Market Segmentation
- 1.3. Research Objective
- 1.4. Definitions and Assumptions
- 2. Executive Summary
- 2.1. Market Snapshot
- 3. Market Dynamics
- 3.1. Market Drivers
- 3.2. Market Restrains
- 3.3. Market Trends
- 3.4. Market Opportunities
- 4. Market Factor Analysis
- 4.1. Porters Five Forces
- 4.1.1. Bargaining Power of Suppliers
- 4.1.2. Bargaining Power of Buyers
- 4.1.3. Threat of New Entrants
- 4.1.4. Threat of Substitutes
- 4.1.5. Competitive Rivalry
- 4.2. PESTEL analysis
- 4.3. BCG Analysis
- 4.3.1. Stars (High Growth, High Market Share)
- 4.3.2. Cash Cows (Low Growth, High Market Share)
- 4.3.3. Question Mark (High Growth, Low Market Share)
- 4.3.4. Dogs (Low Growth, Low Market Share)
- 4.4. Ansoff Matrix Analysis
- 4.5. Supply Chain Analysis
- 4.6. Regulatory Landscape
- 4.7. Current Market Potential and Opportunity Assessment (TAM–SAM–SOM Framework)
- 4.8. RAX Analyst Note
- 4.1. Porters Five Forces
- 5. Market Analysis, Insights and Forecast 2021-2033
- 5.1. Market Analysis, Insights and Forecast - by Type
- 5.1.1. Institutional Investors
- 5.1.2. Individual Investors
- 5.2. Market Analysis, Insights and Forecast - by End User
- 5.2.1. Education
- 5.2.2. Agriculture
- 5.2.3. Healthcare
- 5.2.4. Climate Tech
- 5.3. Market Analysis, Insights and Forecast - by Region
- 5.3.1. North America
- 5.3.2. South America
- 5.3.3. Europe
- 5.3.4. Middle East & Africa
- 5.3.5. Asia Pacific
- 5.1. Market Analysis, Insights and Forecast - by Type
- 6. Global Impact Investing Market Analysis, Insights and Forecast, 2021-2033
- 6.1. Market Analysis, Insights and Forecast - by Type
- 6.1.1. Institutional Investors
- 6.1.2. Individual Investors
- 6.2. Market Analysis, Insights and Forecast - by End User
- 6.2.1. Education
- 6.2.2. Agriculture
- 6.2.3. Healthcare
- 6.2.4. Climate Tech
- 6.1. Market Analysis, Insights and Forecast - by Type
- 7. North America Impact Investing Market Analysis, Insights and Forecast, 2020-2032
- 7.1. Market Analysis, Insights and Forecast - by Type
- 7.1.1. Institutional Investors
- 7.1.2. Individual Investors
- 7.2. Market Analysis, Insights and Forecast - by End User
- 7.2.1. Education
- 7.2.2. Agriculture
- 7.2.3. Healthcare
- 7.2.4. Climate Tech
- 7.1. Market Analysis, Insights and Forecast - by Type
- 8. South America Impact Investing Market Analysis, Insights and Forecast, 2020-2032
- 8.1. Market Analysis, Insights and Forecast - by Type
- 8.1.1. Institutional Investors
- 8.1.2. Individual Investors
- 8.2. Market Analysis, Insights and Forecast - by End User
- 8.2.1. Education
- 8.2.2. Agriculture
- 8.2.3. Healthcare
- 8.2.4. Climate Tech
- 8.1. Market Analysis, Insights and Forecast - by Type
- 9. Europe Impact Investing Market Analysis, Insights and Forecast, 2020-2032
- 9.1. Market Analysis, Insights and Forecast - by Type
- 9.1.1. Institutional Investors
- 9.1.2. Individual Investors
- 9.2. Market Analysis, Insights and Forecast - by End User
- 9.2.1. Education
- 9.2.2. Agriculture
- 9.2.3. Healthcare
- 9.2.4. Climate Tech
- 9.1. Market Analysis, Insights and Forecast - by Type
- 10. Middle East & Africa Impact Investing Market Analysis, Insights and Forecast, 2020-2032
- 10.1. Market Analysis, Insights and Forecast - by Type
- 10.1.1. Institutional Investors
- 10.1.2. Individual Investors
- 10.2. Market Analysis, Insights and Forecast - by End User
- 10.2.1. Education
- 10.2.2. Agriculture
- 10.2.3. Healthcare
- 10.2.4. Climate Tech
- 10.1. Market Analysis, Insights and Forecast - by Type
- 11. Asia Pacific Impact Investing Market Analysis, Insights and Forecast, 2020-2032
- 11.1. Market Analysis, Insights and Forecast - by Type
- 11.1.1. Institutional Investors
- 11.1.2. Individual Investors
- 11.2. Market Analysis, Insights and Forecast - by End User
- 11.2.1. Education
- 11.2.2. Agriculture
- 11.2.3. Healthcare
- 11.2.4. Climate Tech
- 11.1. Market Analysis, Insights and Forecast - by Type
- 12. Competitive Analysis
- 12.1. Company Profiles
- 12.1.1 Vital Capital
- 12.1.1.1. Company Overview
- 12.1.1.2. Products
- 12.1.1.3. Company Financials
- 12.1.1.4. SWOT Analysis
- 12.1.2 BlueOrchard Finance Ltd
- 12.1.2.1. Company Overview
- 12.1.2.2. Products
- 12.1.2.3. Company Financials
- 12.1.2.4. SWOT Analysis
- 12.1.3 BlackRock Inc
- 12.1.3.1. Company Overview
- 12.1.3.2. Products
- 12.1.3.3. Company Financials
- 12.1.3.4. SWOT Analysis
- 12.1.4 Goldman Sachs
- 12.1.4.1. Company Overview
- 12.1.4.2. Products
- 12.1.4.3. Company Financials
- 12.1.4.4. SWOT Analysis
- 12.1.5 Bain Capital LP
- 12.1.5.1. Company Overview
- 12.1.5.2. Products
- 12.1.5.3. Company Financials
- 12.1.5.4. SWOT Analysis
- 12.1.6 Morgan Stanley
- 12.1.6.1. Company Overview
- 12.1.6.2. Products
- 12.1.6.3. Company Financials
- 12.1.6.4. SWOT Analysis
- 12.1.7 Prudential Financial Inc
- 12.1.7.1. Company Overview
- 12.1.7.2. Products
- 12.1.7.3. Company Financials
- 12.1.7.4. SWOT Analysis
- 12.1.8 Manulife Investment Management Holdings (Canada) Inc
- 12.1.8.1. Company Overview
- 12.1.8.2. Products
- 12.1.8.3. Company Financials
- 12.1.8.4. SWOT Analysis
- 12.1.9 Leapfrog Investments
- 12.1.9.1. Company Overview
- 12.1.9.2. Products
- 12.1.9.3. Company Financials
- 12.1.9.4. SWOT Analysis
- 12.1.10 Community Investment Management LLC**List Not Exhaustive
- 12.1.10.1. Company Overview
- 12.1.10.2. Products
- 12.1.10.3. Company Financials
- 12.1.10.4. SWOT Analysis
- 12.1.1 Vital Capital
- 12.2. Market Entropy
- 12.2.1 Company's Key Areas Served
- 12.2.2 Recent Developments
- 12.3. Company Market Share Analysis 2025
- 12.3.1 Top 5 Companies Market Share Analysis
- 12.3.2 Top 3 Companies Market Share Analysis
- 12.4. List of Potential Customers
- 13. Research Methodology
List of Figures
- Figure 1: Global Impact Investing Market Revenue Breakdown (Million, %) by Region 2025 & 2033
- Figure 2: Global Impact Investing Market Volume Breakdown (Trillion, %) by Region 2025 & 2033
- Figure 3: North America Impact Investing Market Revenue (Million), by Type 2025 & 2033
- Figure 4: North America Impact Investing Market Volume (Trillion), by Type 2025 & 2033
- Figure 5: North America Impact Investing Market Revenue Share (%), by Type 2025 & 2033
- Figure 6: North America Impact Investing Market Volume Share (%), by Type 2025 & 2033
- Figure 7: North America Impact Investing Market Revenue (Million), by End User 2025 & 2033
- Figure 8: North America Impact Investing Market Volume (Trillion), by End User 2025 & 2033
- Figure 9: North America Impact Investing Market Revenue Share (%), by End User 2025 & 2033
- Figure 10: North America Impact Investing Market Volume Share (%), by End User 2025 & 2033
- Figure 11: North America Impact Investing Market Revenue (Million), by Country 2025 & 2033
- Figure 12: North America Impact Investing Market Volume (Trillion), by Country 2025 & 2033
- Figure 13: North America Impact Investing Market Revenue Share (%), by Country 2025 & 2033
- Figure 14: North America Impact Investing Market Volume Share (%), by Country 2025 & 2033
- Figure 15: South America Impact Investing Market Revenue (Million), by Type 2025 & 2033
- Figure 16: South America Impact Investing Market Volume (Trillion), by Type 2025 & 2033
- Figure 17: South America Impact Investing Market Revenue Share (%), by Type 2025 & 2033
- Figure 18: South America Impact Investing Market Volume Share (%), by Type 2025 & 2033
- Figure 19: South America Impact Investing Market Revenue (Million), by End User 2025 & 2033
- Figure 20: South America Impact Investing Market Volume (Trillion), by End User 2025 & 2033
- Figure 21: South America Impact Investing Market Revenue Share (%), by End User 2025 & 2033
- Figure 22: South America Impact Investing Market Volume Share (%), by End User 2025 & 2033
- Figure 23: South America Impact Investing Market Revenue (Million), by Country 2025 & 2033
- Figure 24: South America Impact Investing Market Volume (Trillion), by Country 2025 & 2033
- Figure 25: South America Impact Investing Market Revenue Share (%), by Country 2025 & 2033
- Figure 26: South America Impact Investing Market Volume Share (%), by Country 2025 & 2033
- Figure 27: Europe Impact Investing Market Revenue (Million), by Type 2025 & 2033
- Figure 28: Europe Impact Investing Market Volume (Trillion), by Type 2025 & 2033
- Figure 29: Europe Impact Investing Market Revenue Share (%), by Type 2025 & 2033
- Figure 30: Europe Impact Investing Market Volume Share (%), by Type 2025 & 2033
- Figure 31: Europe Impact Investing Market Revenue (Million), by End User 2025 & 2033
- Figure 32: Europe Impact Investing Market Volume (Trillion), by End User 2025 & 2033
- Figure 33: Europe Impact Investing Market Revenue Share (%), by End User 2025 & 2033
- Figure 34: Europe Impact Investing Market Volume Share (%), by End User 2025 & 2033
- Figure 35: Europe Impact Investing Market Revenue (Million), by Country 2025 & 2033
- Figure 36: Europe Impact Investing Market Volume (Trillion), by Country 2025 & 2033
- Figure 37: Europe Impact Investing Market Revenue Share (%), by Country 2025 & 2033
- Figure 38: Europe Impact Investing Market Volume Share (%), by Country 2025 & 2033
- Figure 39: Middle East & Africa Impact Investing Market Revenue (Million), by Type 2025 & 2033
- Figure 40: Middle East & Africa Impact Investing Market Volume (Trillion), by Type 2025 & 2033
- Figure 41: Middle East & Africa Impact Investing Market Revenue Share (%), by Type 2025 & 2033
- Figure 42: Middle East & Africa Impact Investing Market Volume Share (%), by Type 2025 & 2033
- Figure 43: Middle East & Africa Impact Investing Market Revenue (Million), by End User 2025 & 2033
- Figure 44: Middle East & Africa Impact Investing Market Volume (Trillion), by End User 2025 & 2033
- Figure 45: Middle East & Africa Impact Investing Market Revenue Share (%), by End User 2025 & 2033
- Figure 46: Middle East & Africa Impact Investing Market Volume Share (%), by End User 2025 & 2033
- Figure 47: Middle East & Africa Impact Investing Market Revenue (Million), by Country 2025 & 2033
- Figure 48: Middle East & Africa Impact Investing Market Volume (Trillion), by Country 2025 & 2033
- Figure 49: Middle East & Africa Impact Investing Market Revenue Share (%), by Country 2025 & 2033
- Figure 50: Middle East & Africa Impact Investing Market Volume Share (%), by Country 2025 & 2033
- Figure 51: Asia Pacific Impact Investing Market Revenue (Million), by Type 2025 & 2033
- Figure 52: Asia Pacific Impact Investing Market Volume (Trillion), by Type 2025 & 2033
- Figure 53: Asia Pacific Impact Investing Market Revenue Share (%), by Type 2025 & 2033
- Figure 54: Asia Pacific Impact Investing Market Volume Share (%), by Type 2025 & 2033
- Figure 55: Asia Pacific Impact Investing Market Revenue (Million), by End User 2025 & 2033
- Figure 56: Asia Pacific Impact Investing Market Volume (Trillion), by End User 2025 & 2033
- Figure 57: Asia Pacific Impact Investing Market Revenue Share (%), by End User 2025 & 2033
- Figure 58: Asia Pacific Impact Investing Market Volume Share (%), by End User 2025 & 2033
- Figure 59: Asia Pacific Impact Investing Market Revenue (Million), by Country 2025 & 2033
- Figure 60: Asia Pacific Impact Investing Market Volume (Trillion), by Country 2025 & 2033
- Figure 61: Asia Pacific Impact Investing Market Revenue Share (%), by Country 2025 & 2033
- Figure 62: Asia Pacific Impact Investing Market Volume Share (%), by Country 2025 & 2033
List of Tables
- Table 1: Global Impact Investing Market Revenue Million Forecast, by Type 2020 & 2033
- Table 2: Global Impact Investing Market Volume Trillion Forecast, by Type 2020 & 2033
- Table 3: Global Impact Investing Market Revenue Million Forecast, by End User 2020 & 2033
- Table 4: Global Impact Investing Market Volume Trillion Forecast, by End User 2020 & 2033
- Table 5: Global Impact Investing Market Revenue Million Forecast, by Region 2020 & 2033
- Table 6: Global Impact Investing Market Volume Trillion Forecast, by Region 2020 & 2033
- Table 7: Global Impact Investing Market Revenue Million Forecast, by Type 2020 & 2033
- Table 8: Global Impact Investing Market Volume Trillion Forecast, by Type 2020 & 2033
- Table 9: Global Impact Investing Market Revenue Million Forecast, by End User 2020 & 2033
- Table 10: Global Impact Investing Market Volume Trillion Forecast, by End User 2020 & 2033
- Table 11: Global Impact Investing Market Revenue Million Forecast, by Country 2020 & 2033
- Table 12: Global Impact Investing Market Volume Trillion Forecast, by Country 2020 & 2033
- Table 13: United States Impact Investing Market Revenue (Million) Forecast, by Application 2020 & 2033
- Table 14: United States Impact Investing Market Volume (Trillion) Forecast, by Application 2020 & 2033
- Table 15: Canada Impact Investing Market Revenue (Million) Forecast, by Application 2020 & 2033
- Table 16: Canada Impact Investing Market Volume (Trillion) Forecast, by Application 2020 & 2033
- Table 17: Mexico Impact Investing Market Revenue (Million) Forecast, by Application 2020 & 2033
- Table 18: Mexico Impact Investing Market Volume (Trillion) Forecast, by Application 2020 & 2033
- Table 19: Global Impact Investing Market Revenue Million Forecast, by Type 2020 & 2033
- Table 20: Global Impact Investing Market Volume Trillion Forecast, by Type 2020 & 2033
- Table 21: Global Impact Investing Market Revenue Million Forecast, by End User 2020 & 2033
- Table 22: Global Impact Investing Market Volume Trillion Forecast, by End User 2020 & 2033
- Table 23: Global Impact Investing Market Revenue Million Forecast, by Country 2020 & 2033
- Table 24: Global Impact Investing Market Volume Trillion Forecast, by Country 2020 & 2033
- Table 25: Brazil Impact Investing Market Revenue (Million) Forecast, by Application 2020 & 2033
- Table 26: Brazil Impact Investing Market Volume (Trillion) Forecast, by Application 2020 & 2033
- Table 27: Argentina Impact Investing Market Revenue (Million) Forecast, by Application 2020 & 2033
- Table 28: Argentina Impact Investing Market Volume (Trillion) Forecast, by Application 2020 & 2033
- Table 29: Rest of South America Impact Investing Market Revenue (Million) Forecast, by Application 2020 & 2033
- Table 30: Rest of South America Impact Investing Market Volume (Trillion) Forecast, by Application 2020 & 2033
- Table 31: Global Impact Investing Market Revenue Million Forecast, by Type 2020 & 2033
- Table 32: Global Impact Investing Market Volume Trillion Forecast, by Type 2020 & 2033
- Table 33: Global Impact Investing Market Revenue Million Forecast, by End User 2020 & 2033
- Table 34: Global Impact Investing Market Volume Trillion Forecast, by End User 2020 & 2033
- Table 35: Global Impact Investing Market Revenue Million Forecast, by Country 2020 & 2033
- Table 36: Global Impact Investing Market Volume Trillion Forecast, by Country 2020 & 2033
- Table 37: United Kingdom Impact Investing Market Revenue (Million) Forecast, by Application 2020 & 2033
- Table 38: United Kingdom Impact Investing Market Volume (Trillion) Forecast, by Application 2020 & 2033
- Table 39: Germany Impact Investing Market Revenue (Million) Forecast, by Application 2020 & 2033
- Table 40: Germany Impact Investing Market Volume (Trillion) Forecast, by Application 2020 & 2033
- Table 41: France Impact Investing Market Revenue (Million) Forecast, by Application 2020 & 2033
- Table 42: France Impact Investing Market Volume (Trillion) Forecast, by Application 2020 & 2033
- Table 43: Italy Impact Investing Market Revenue (Million) Forecast, by Application 2020 & 2033
- Table 44: Italy Impact Investing Market Volume (Trillion) Forecast, by Application 2020 & 2033
- Table 45: Spain Impact Investing Market Revenue (Million) Forecast, by Application 2020 & 2033
- Table 46: Spain Impact Investing Market Volume (Trillion) Forecast, by Application 2020 & 2033
- Table 47: Russia Impact Investing Market Revenue (Million) Forecast, by Application 2020 & 2033
- Table 48: Russia Impact Investing Market Volume (Trillion) Forecast, by Application 2020 & 2033
- Table 49: Benelux Impact Investing Market Revenue (Million) Forecast, by Application 2020 & 2033
- Table 50: Benelux Impact Investing Market Volume (Trillion) Forecast, by Application 2020 & 2033
- Table 51: Nordics Impact Investing Market Revenue (Million) Forecast, by Application 2020 & 2033
- Table 52: Nordics Impact Investing Market Volume (Trillion) Forecast, by Application 2020 & 2033
- Table 53: Rest of Europe Impact Investing Market Revenue (Million) Forecast, by Application 2020 & 2033
- Table 54: Rest of Europe Impact Investing Market Volume (Trillion) Forecast, by Application 2020 & 2033
- Table 55: Global Impact Investing Market Revenue Million Forecast, by Type 2020 & 2033
- Table 56: Global Impact Investing Market Volume Trillion Forecast, by Type 2020 & 2033
- Table 57: Global Impact Investing Market Revenue Million Forecast, by End User 2020 & 2033
- Table 58: Global Impact Investing Market Volume Trillion Forecast, by End User 2020 & 2033
- Table 59: Global Impact Investing Market Revenue Million Forecast, by Country 2020 & 2033
- Table 60: Global Impact Investing Market Volume Trillion Forecast, by Country 2020 & 2033
- Table 61: Turkey Impact Investing Market Revenue (Million) Forecast, by Application 2020 & 2033
- Table 62: Turkey Impact Investing Market Volume (Trillion) Forecast, by Application 2020 & 2033
- Table 63: Israel Impact Investing Market Revenue (Million) Forecast, by Application 2020 & 2033
- Table 64: Israel Impact Investing Market Volume (Trillion) Forecast, by Application 2020 & 2033
- Table 65: GCC Impact Investing Market Revenue (Million) Forecast, by Application 2020 & 2033
- Table 66: GCC Impact Investing Market Volume (Trillion) Forecast, by Application 2020 & 2033
- Table 67: North Africa Impact Investing Market Revenue (Million) Forecast, by Application 2020 & 2033
- Table 68: North Africa Impact Investing Market Volume (Trillion) Forecast, by Application 2020 & 2033
- Table 69: South Africa Impact Investing Market Revenue (Million) Forecast, by Application 2020 & 2033
- Table 70: South Africa Impact Investing Market Volume (Trillion) Forecast, by Application 2020 & 2033
- Table 71: Rest of Middle East & Africa Impact Investing Market Revenue (Million) Forecast, by Application 2020 & 2033
- Table 72: Rest of Middle East & Africa Impact Investing Market Volume (Trillion) Forecast, by Application 2020 & 2033
- Table 73: Global Impact Investing Market Revenue Million Forecast, by Type 2020 & 2033
- Table 74: Global Impact Investing Market Volume Trillion Forecast, by Type 2020 & 2033
- Table 75: Global Impact Investing Market Revenue Million Forecast, by End User 2020 & 2033
- Table 76: Global Impact Investing Market Volume Trillion Forecast, by End User 2020 & 2033
- Table 77: Global Impact Investing Market Revenue Million Forecast, by Country 2020 & 2033
- Table 78: Global Impact Investing Market Volume Trillion Forecast, by Country 2020 & 2033
- Table 79: China Impact Investing Market Revenue (Million) Forecast, by Application 2020 & 2033
- Table 80: China Impact Investing Market Volume (Trillion) Forecast, by Application 2020 & 2033
- Table 81: India Impact Investing Market Revenue (Million) Forecast, by Application 2020 & 2033
- Table 82: India Impact Investing Market Volume (Trillion) Forecast, by Application 2020 & 2033
- Table 83: Japan Impact Investing Market Revenue (Million) Forecast, by Application 2020 & 2033
- Table 84: Japan Impact Investing Market Volume (Trillion) Forecast, by Application 2020 & 2033
- Table 85: South Korea Impact Investing Market Revenue (Million) Forecast, by Application 2020 & 2033
- Table 86: South Korea Impact Investing Market Volume (Trillion) Forecast, by Application 2020 & 2033
- Table 87: ASEAN Impact Investing Market Revenue (Million) Forecast, by Application 2020 & 2033
- Table 88: ASEAN Impact Investing Market Volume (Trillion) Forecast, by Application 2020 & 2033
- Table 89: Oceania Impact Investing Market Revenue (Million) Forecast, by Application 2020 & 2033
- Table 90: Oceania Impact Investing Market Volume (Trillion) Forecast, by Application 2020 & 2033
- Table 91: Rest of Asia Pacific Impact Investing Market Revenue (Million) Forecast, by Application 2020 & 2033
- Table 92: Rest of Asia Pacific Impact Investing Market Volume (Trillion) Forecast, by Application 2020 & 2033
Frequently Asked Questions
1. What is the projected Compound Annual Growth Rate (CAGR) of the Impact Investing Market?
The projected CAGR is approximately 7.17%.
2. Which companies are prominent players in the Impact Investing Market?
Key companies in the market include Vital Capital, BlueOrchard Finance Ltd, BlackRock Inc, Goldman Sachs, Bain Capital LP, Morgan Stanley, Prudential Financial Inc, Manulife Investment Management Holdings (Canada) Inc, Leapfrog Investments, Community Investment Management LLC**List Not Exhaustive.
3. What are the main segments of the Impact Investing Market?
The market segments include Type, End User.
4. Can you provide details about the market size?
The market size is estimated to be USD 1.33 Million as of 2022.
5. What are some drivers contributing to market growth?
Growing Awareness of Environmental and Social Issues is Fueling the Desire for Impact Investment; Rising Interest from Traditional Not-for-Profit Fund Managers.
6. What are the notable trends driving market growth?
Rising Investments from Institutional Investors.
7. Are there any restraints impacting market growth?
Growing Awareness of Environmental and Social Issues is Fueling the Desire for Impact Investment; Rising Interest from Traditional Not-for-Profit Fund Managers.
8. Can you provide examples of recent developments in the market?
January 2024: BlackRock Inc. and Global Infrastructure Partners (GIP), a prominent independent manager of infrastructure funds, jointly announced an agreement. As per this agreement, BlackRock would acquire GIP for a total value of USD 3 billion in cash and roughly 12 million shares of BlackRock's common stock.
9. What pricing options are available for accessing the report?
Pricing options include single-user, multi-user, and enterprise licenses priced at USD 3800, USD 4500, and USD 5800 respectively.
10. Is the market size provided in terms of value or volume?
The market size is provided in terms of value, measured in Million and volume, measured in Trillion.
11. Are there any specific market keywords associated with the report?
Yes, the market keyword associated with the report is "Impact Investing Market," which aids in identifying and referencing the specific market segment covered.
12. How do I determine which pricing option suits my needs best?
The pricing options vary based on user requirements and access needs. Individual users may opt for single-user licenses, while businesses requiring broader access may choose multi-user or enterprise licenses for cost-effective access to the report.
13. Are there any additional resources or data provided in the Impact Investing Market report?
While the report offers comprehensive insights, it's advisable to review the specific contents or supplementary materials provided to ascertain if additional resources or data are available.
14. How can I stay updated on further developments or reports in the Impact Investing Market?
To stay informed about further developments, trends, and reports in the Impact Investing Market, consider subscribing to industry newsletters, following relevant companies and organizations, or regularly checking reputable industry news sources and publications.
Methodology
Step 1 - Identification of Relevant Samples Size from Population Database


Step 2 - Approaches for Defining Global Market Size (Value, Volume* & Price*)

Note*: In applicable scenarios
Step 3 - Data Sources
Primary Research
- Web Analytics
- Survey Reports
- Research Institute
- Latest Research Reports
- Opinion Leaders
Secondary Research
- Annual Reports
- White Paper
- Latest Press Release
- Industry Association
- Paid Database
- Investor Presentations

Step 4 - Data Triangulation
Involves using different sources of information in order to increase the validity of a study
These sources are likely to be stakeholders in a program - participants, other researchers, program staff, other community members, and so on.
Then we put all data in single framework & apply various statistical tools to find out the dynamic on the market.
During the analysis stage, feedback from the stakeholder groups would be compared to determine areas of agreement as well as areas of divergence