
Key Insights
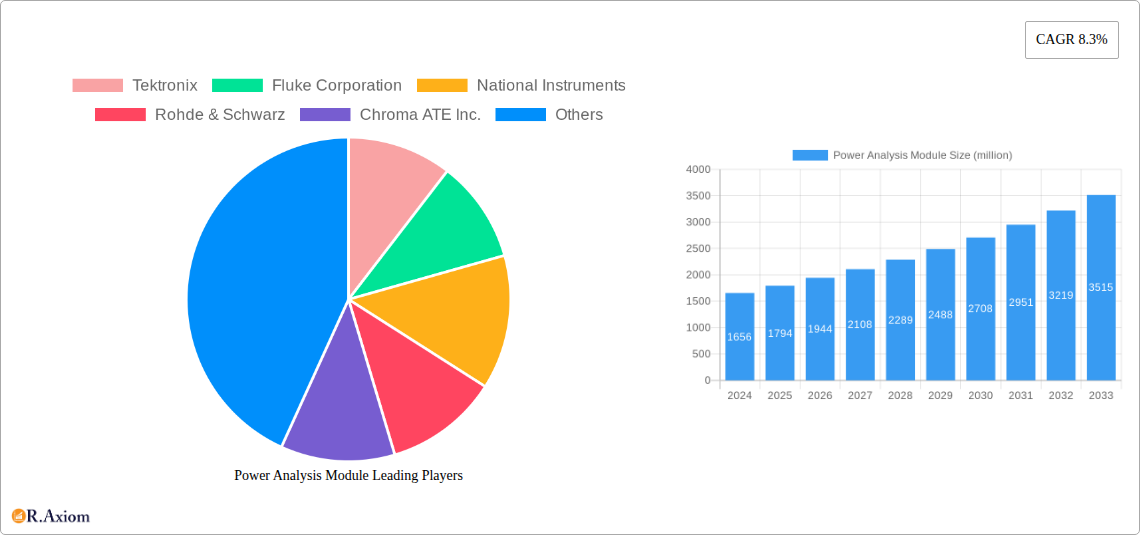
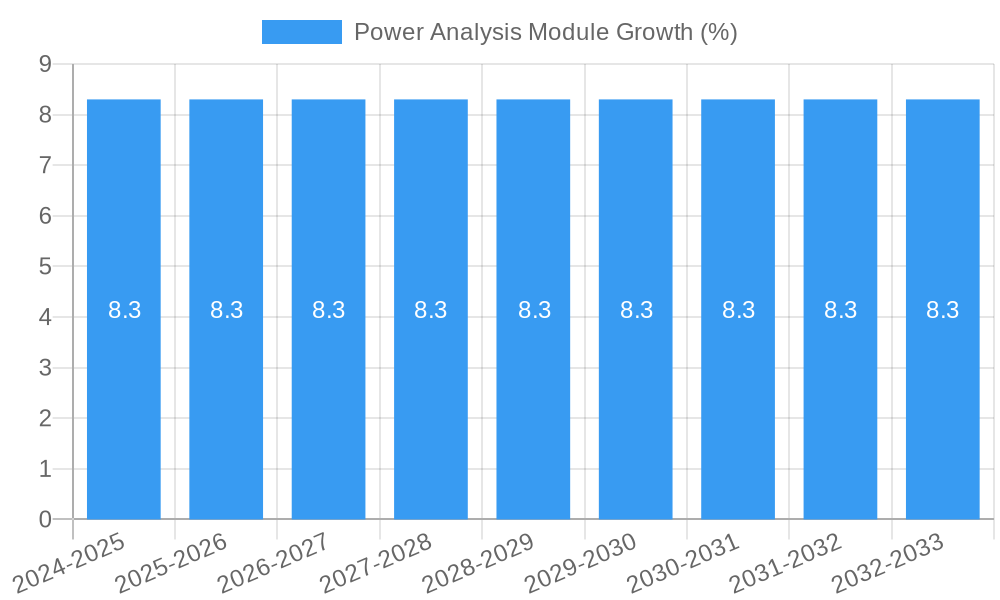
The global Power Analysis Module market is poised for significant expansion, projected to reach approximately USD 1794 million by 2025, with a robust Compound Annual Growth Rate (CAGR) of 8.3% anticipated through 2033. This upward trajectory is propelled by the increasing demand for precise and efficient electrical power monitoring across a multitude of industries. Key drivers fueling this growth include the escalating complexity of electrical systems, the imperative for energy efficiency and regulatory compliance, and the continuous innovation in power quality analysis tools. Sectors such as Mechanical Engineering, the Automotive Industry, Aerospace, and the Oil & Gas sector are increasingly adopting advanced power analysis modules to optimize operations, reduce downtime, and ensure the reliability of critical infrastructure. Furthermore, the burgeoning integration of renewable energy sources and the electrification of transportation are creating new avenues for market development.
The market's dynamism is further shaped by several evolving trends. A prominent trend is the increasing integration of IoT capabilities and cloud connectivity into power analysis modules, enabling real-time data access, remote monitoring, and predictive maintenance. This shift towards smarter, connected devices enhances user experience and operational efficiency. The demand for portable and highly accurate power analyzers is also on the rise, catering to field service engineers and on-site diagnostics. While the market presents substantial opportunities, certain restraints, such as the initial high cost of advanced equipment and the need for specialized technical expertise for operation and data interpretation, may present challenges. However, the ongoing technological advancements and the growing awareness of the benefits of comprehensive power analysis are expected to mitigate these factors, paving the way for sustained and accelerated market growth.
Power Analysis Module Market: Comprehensive Market Analysis and Future Outlook (2019-2033)
This in-depth report provides a comprehensive analysis of the global Power Analysis Module market, examining current trends, future projections, and key growth drivers. Covering the period from 2019 to 2033, with a base year of 2025, this report is an indispensable resource for industry stakeholders seeking to understand market dynamics, competitive landscape, and emerging opportunities. We delve into intricate details of market concentration, innovation, dominant segments, product developments, and strategic outlooks, supported by robust data and expert insights.
Power Analysis Module Market Concentration & Innovation
The global Power Analysis Module market exhibits a moderate level of concentration, with several key players vying for market share, estimated to be valued in the hundreds of millions of dollars. Major contributors include Tektronix, Fluke Corporation, National Instruments, Rohde & Schwarz, and Keysight, each holding significant influence. Innovation is a primary driver, fueled by advancements in sensor technology, data processing capabilities, and integration with IoT platforms, leading to the development of more accurate and sophisticated power analysis solutions. Regulatory frameworks, particularly those concerning energy efficiency and grid stability, are increasingly influencing product development and market adoption, contributing to market growth estimated to be in the tens of millions of dollars in new R&D investments. Product substitutes, while present in simpler forms of power monitoring, often lack the precision and comprehensive analysis offered by dedicated power analysis modules, thus limiting their impact. End-user trends are leaning towards real-time monitoring, predictive maintenance, and remote accessibility, pushing manufacturers to innovate. Mergers and acquisitions (M&A) activity, though not widespread, signifies strategic consolidation and a drive for technological synergy. Deal values in this segment are estimated to be in the hundreds of millions of dollars, reflecting the strategic importance of acquiring cutting-edge technologies and expanding market reach. The market is projected to grow at a Compound Annual Growth Rate (CAGR) of approximately 6% over the forecast period, reaching an estimated billions of dollars in market value by 2033.
Power Analysis Module Industry Trends & Insights
The Power Analysis Module industry is experiencing robust growth, driven by an escalating demand for precise electrical power measurement and management across a multitude of sectors. Technological disruptions are at the forefront, with the integration of artificial intelligence (AI) and machine learning (ML) enabling advanced diagnostics, anomaly detection, and predictive maintenance capabilities within power analysis systems. These advancements translate into enhanced operational efficiency and reduced downtime for end-users. Consumer preferences are shifting towards more user-friendly interfaces, cloud connectivity for remote monitoring and data analytics, and miniaturized, portable power analysis solutions. The increasing adoption of renewable energy sources, such as solar and wind power, necessitates sophisticated power analysis modules to ensure grid stability, optimize energy distribution, and monitor the performance of inverters and energy storage systems. Furthermore, the growing electrification of transportation, particularly the automotive industry's transition to electric vehicles (EVs), is creating substantial demand for power analysis modules to test and validate battery systems, charging infrastructure, and electric powertrains. The stringent quality and safety standards prevalent in sectors like aerospace and medical technology also contribute significantly to the demand for high-accuracy power analysis. The market penetration of advanced power analysis modules is steadily increasing, as businesses recognize the long-term cost savings and performance improvements they offer. This trend is expected to continue as energy efficiency regulations become more stringent globally, compelling industries to invest in sophisticated power monitoring and management tools. The competitive dynamics are characterized by intense innovation, with companies constantly striving to differentiate themselves through superior accuracy, advanced features, and comprehensive software solutions. Strategic partnerships and collaborations are also becoming more common as companies aim to leverage each other's expertise and expand their market reach. The overall market value is anticipated to reach billions of dollars by the end of the forecast period, with a projected CAGR of around 6%. This sustained growth underscores the critical role of power analysis modules in modern industrial operations and technological advancement.
Dominant Markets & Segments in Power Analysis Module
The Power Analysis Module market exhibits strong dominance in the Automotive Industry, driven by the rapid global adoption of electric vehicles (EVs) and stringent testing requirements for battery management systems, charging infrastructure, and electric powertrains. The sheer volume of EV production and the complexity of their electrical systems necessitate advanced power analysis to ensure safety, performance, and efficiency, representing a market segment valued in the hundreds of millions of dollars. Within the automotive sector, Three Phase power analysis modules are particularly dominant due to their application in charging stations, power distribution networks, and vehicle powertrains, contributing an estimated hundreds of millions of dollars to the overall market.
Key drivers for this dominance include:
- Economic Policies: Government incentives for EV adoption, such as subsidies and tax credits, are directly stimulating demand for automotive-related power analysis.
- Infrastructure Development: Significant investments in charging infrastructure worldwide require extensive power analysis for installation, testing, and ongoing monitoring.
- Technological Advancement: The continuous evolution of EV battery technology and motor efficiency demands sophisticated power analysis tools for research, development, and quality control.
- Regulatory Compliance: Increasing safety and performance regulations for EVs mandate rigorous power analysis throughout the product lifecycle.
The Electrical Industry also represents a significant and dominant segment, encompassing power generation, transmission, and distribution. Here, power analysis modules are crucial for grid stability, load balancing, fault detection, and the integration of renewable energy sources. The ongoing upgrades and modernization of electrical grids, coupled with the growing demand for reliable power supply, underpin the sustained growth in this segment, estimated to be in the hundreds of millions of dollars.
- Economic Policies: Government initiatives focused on grid modernization and renewable energy integration are major growth catalysts.
- Infrastructure Investment: Continuous investment in upgrading and expanding electrical grids globally fuels the demand for advanced power analysis solutions.
- Technological Advancements: The integration of smart grid technologies and the increasing complexity of power systems necessitate sophisticated analysis capabilities.
- Energy Efficiency Mandates: Stricter energy efficiency regulations compel utilities and industrial facilities to invest in precise power monitoring.
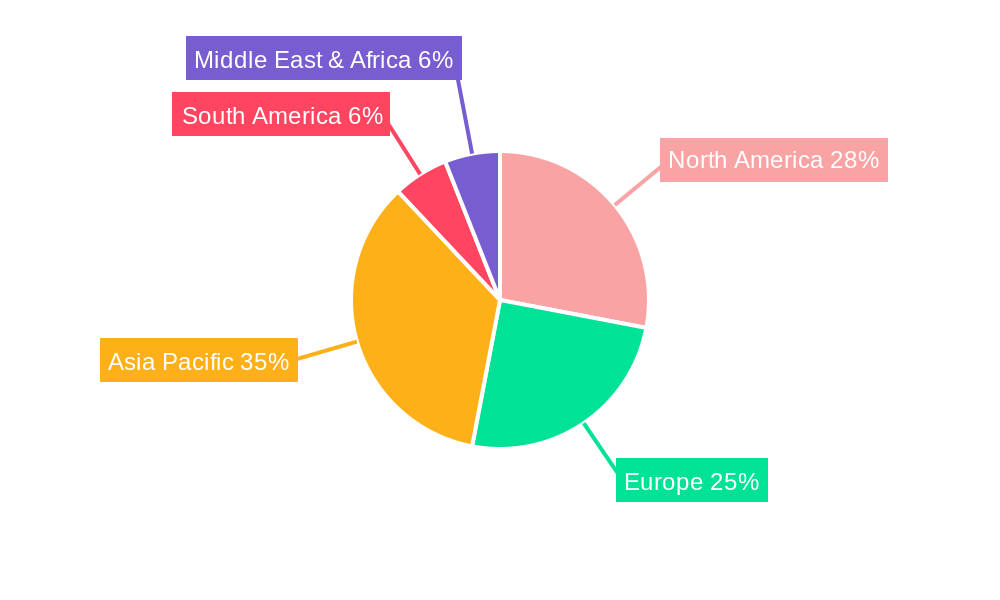
In terms of geographical dominance, North America and Europe lead the market, driven by established automotive manufacturing bases, strong industrial sectors, and robust regulatory frameworks promoting energy efficiency and technological innovation. Asia-Pacific, particularly China, is emerging as a rapidly growing market due to its massive automotive production and significant investments in renewable energy. The overall market size for power analysis modules is projected to reach billions of dollars by 2033.
Power Analysis Module Product Developments
Recent product developments in the Power Analysis Module market are characterized by enhanced accuracy, portability, and intelligent data analysis. Innovations include the integration of AI for predictive maintenance and fault detection, cloud connectivity for remote monitoring and data logging, and compact designs for increased field usability. Companies are focusing on modules capable of analyzing complex power waveforms across multiple phases with greater precision, supporting the growing demands of the automotive, aerospace, and electrical industries. These advancements provide a significant competitive advantage by offering users real-time insights and actionable data for optimizing power systems and ensuring operational reliability.
Report Scope & Segmentation Analysis
This report provides a granular analysis of the Power Analysis Module market segmented by Application and Type. Key applications include: Mechanical Engineering, Automotive Industry, Aerospace, Oil And Gas, Chemical Industry, Medical Technology, and Electrical Industry. Each segment's projected market size and growth trajectory have been meticulously analyzed. For example, the Automotive Industry segment is expected to witness a CAGR of approximately 7% due to the EV revolution, reaching an estimated market value of hundreds of millions of dollars by 2033. The Electrical Industry segment, a substantial contributor, is projected to grow at around 5% annually.
The market is also segmented by Type: Three Phase, Four Phase, Six Phase, and Eight Phase. The Three Phase segment currently holds the largest market share and is expected to continue its dominance due to its widespread application in industrial and commercial power systems, with a projected market value of hundreds of millions of dollars. The demand for Four, Six, and Eight Phase modules is anticipated to grow steadily, driven by specialized applications in advanced industrial machinery and high-power systems.
Key Drivers of Power Analysis Module Growth
Several key factors are propelling the growth of the Power Analysis Module market. Technologically, the increasing complexity of electrical systems, the burgeoning adoption of electric vehicles, and the integration of renewable energy sources are creating an insatiable demand for accurate power measurement and analysis. Economically, a global focus on energy efficiency and cost reduction across industries compels businesses to invest in tools that optimize power consumption and identify inefficiencies. Regulatory frameworks mandating stricter power quality standards and safety protocols further drive adoption. For instance, government initiatives promoting smart grids and sustainable energy solutions directly translate into increased demand for advanced power analysis modules, contributing significantly to market expansion estimated in the tens of millions of dollars annually.
Challenges in the Power Analysis Module Sector
Despite its robust growth, the Power Analysis Module sector faces several challenges. Stringent regulatory hurdles related to data security and interoperability can slow down product adoption in certain regions. Supply chain disruptions, particularly for specialized electronic components, can impact production timelines and cost-effectiveness, leading to estimated cost increases of low single-digit percentages. Intense competition among established players and emerging low-cost manufacturers puts pressure on profit margins. Furthermore, the need for specialized technical expertise to operate and interpret data from advanced power analysis modules can be a barrier for smaller enterprises. The high initial investment cost for sophisticated systems can also deter some potential buyers, necessitating clear demonstration of ROI.
Emerging Opportunities in Power Analysis Module
Emerging opportunities in the Power Analysis Module market are primarily driven by advancements in AI and IoT, the growing demand for predictive maintenance solutions, and the expansion of microgrid technologies. The integration of AI and machine learning algorithms allows for more sophisticated anomaly detection and proactive issue resolution, creating opportunities for value-added services. The widespread adoption of IoT devices in industrial settings opens doors for cloud-connected power analysis modules, enabling remote monitoring and data-driven decision-making. The development of microgrids and distributed energy resources also presents a significant opportunity, as these systems require precise power management and analysis for optimal performance and stability. Furthermore, the increasing focus on cybersecurity for power systems creates a niche for modules with enhanced security features, representing a market segment with projected growth in the millions of dollars.
Leading Players in the Power Analysis Module Market
- Tektronix
- Fluke Corporation
- National Instruments
- Rohde & Schwarz
- Chroma ATE Inc.
- AMETEK
- Cypress Semiconductor Corporation
- E-Motec
- Gasworld
- GCH
- HALA Contec GmbH & Co. KG
- Hitachi HIGH-TECHNOLOGIES Co.,Ltd.
- Janitza electronics GmbH
- Keysight
- LTTsmart
- Mitsubishi Electric
- Quarch Technology
- RIGOL Technologies,Ltd.
- Schneider Electric Co.,Ltd.
- Siemens
- STMicroelectronics
- Yokogawa Test & Measurement Corporation
Key Developments in Power Analysis Module Industry
- 2024: Launch of AI-powered predictive maintenance features in power analyzers, enhancing troubleshooting capabilities.
- 2023: Increased integration of cloud connectivity and IoT platforms for remote monitoring and data analytics.
- 2023: Introduction of ultra-portable and battery-operated power analysis modules for field service applications.
- 2022: Advancements in high-frequency power analysis for electric vehicle component testing.
- 2021: Strategic partnerships focusing on developing integrated power quality monitoring and management solutions.
- 2020: Enhanced cybersecurity features integrated into power analysis modules to protect critical infrastructure.
Strategic Outlook for Power Analysis Module Market
The strategic outlook for the Power Analysis Module market is highly positive, fueled by the ongoing digital transformation across industries and the increasing global emphasis on energy efficiency and sustainability. The continuous evolution of technology, particularly in AI, IoT, and advanced sensor capabilities, will drive innovation and create new market opportunities. The escalating demand from rapidly expanding sectors like electric mobility and renewable energy will serve as significant growth catalysts. Companies that can offer integrated solutions, encompassing sophisticated hardware, intelligent software, and robust data analytics, will be best positioned for success. Strategic investments in research and development, coupled with proactive engagement with evolving regulatory landscapes, will be crucial for sustained market leadership and expansion, with the overall market expected to reach billions of dollars by 2033.
Power Analysis Module Segmentation
-
1. Application
- 1.1. Mechanical Engineering
- 1.2. Automotive Industry
- 1.3. Aerospace
- 1.4. Oil And Gas
- 1.5. Chemical Industry
- 1.6. Medical Technology
- 1.7. Electrical Industry
-
2. Types
- 2.1. Three Phase
- 2.2. Four Phase
- 2.3. Six Phase
- 2.4. Eight Phase
Power Analysis Module Segmentation By Geography
-
1. North America
- 1.1. United States
- 1.2. Canada
- 1.3. Mexico
-
2. South America
- 2.1. Brazil
- 2.2. Argentina
- 2.3. Rest of South America
-
3. Europe
- 3.1. United Kingdom
- 3.2. Germany
- 3.3. France
- 3.4. Italy
- 3.5. Spain
- 3.6. Russia
- 3.7. Benelux
- 3.8. Nordics
- 3.9. Rest of Europe
-
4. Middle East & Africa
- 4.1. Turkey
- 4.2. Israel
- 4.3. GCC
- 4.4. North Africa
- 4.5. South Africa
- 4.6. Rest of Middle East & Africa
-
5. Asia Pacific
- 5.1. China
- 5.2. India
- 5.3. Japan
- 5.4. South Korea
- 5.5. ASEAN
- 5.6. Oceania
- 5.7. Rest of Asia Pacific
Power Analysis Module REPORT HIGHLIGHTS
| Aspects | Details |
|---|---|
| Study Period | 2019-2033 |
| Base Year | 2024 |
| Estimated Year | 2025 |
| Forecast Period | 2025-2033 |
| Historical Period | 2019-2024 |
| Growth Rate | CAGR of 8.3% from 2019-2033 |
| Segmentation |
|
Table of Contents
- 1. Introduction
- 1.1. Research Scope
- 1.2. Market Segmentation
- 1.3. Research Methodology
- 1.4. Definitions and Assumptions
- 2. Executive Summary
- 2.1. Introduction
- 3. Market Dynamics
- 3.1. Introduction
- 3.2. Market Drivers
- 3.3. Market Restrains
- 3.4. Market Trends
- 4. Market Factor Analysis
- 4.1. Porters Five Forces
- 4.2. Supply/Value Chain
- 4.3. PESTEL analysis
- 4.4. Market Entropy
- 4.5. Patent/Trademark Analysis
- 5. Global Power Analysis Module Analysis, Insights and Forecast, 2019-2031
- 5.1. Market Analysis, Insights and Forecast - by Application
- 5.1.1. Mechanical Engineering
- 5.1.2. Automotive Industry
- 5.1.3. Aerospace
- 5.1.4. Oil And Gas
- 5.1.5. Chemical Industry
- 5.1.6. Medical Technology
- 5.1.7. Electrical Industry
- 5.2. Market Analysis, Insights and Forecast - by Types
- 5.2.1. Three Phase
- 5.2.2. Four Phase
- 5.2.3. Six Phase
- 5.2.4. Eight Phase
- 5.3. Market Analysis, Insights and Forecast - by Region
- 5.3.1. North America
- 5.3.2. South America
- 5.3.3. Europe
- 5.3.4. Middle East & Africa
- 5.3.5. Asia Pacific
- 5.1. Market Analysis, Insights and Forecast - by Application
- 6. North America Power Analysis Module Analysis, Insights and Forecast, 2019-2031
- 6.1. Market Analysis, Insights and Forecast - by Application
- 6.1.1. Mechanical Engineering
- 6.1.2. Automotive Industry
- 6.1.3. Aerospace
- 6.1.4. Oil And Gas
- 6.1.5. Chemical Industry
- 6.1.6. Medical Technology
- 6.1.7. Electrical Industry
- 6.2. Market Analysis, Insights and Forecast - by Types
- 6.2.1. Three Phase
- 6.2.2. Four Phase
- 6.2.3. Six Phase
- 6.2.4. Eight Phase
- 6.1. Market Analysis, Insights and Forecast - by Application
- 7. South America Power Analysis Module Analysis, Insights and Forecast, 2019-2031
- 7.1. Market Analysis, Insights and Forecast - by Application
- 7.1.1. Mechanical Engineering
- 7.1.2. Automotive Industry
- 7.1.3. Aerospace
- 7.1.4. Oil And Gas
- 7.1.5. Chemical Industry
- 7.1.6. Medical Technology
- 7.1.7. Electrical Industry
- 7.2. Market Analysis, Insights and Forecast - by Types
- 7.2.1. Three Phase
- 7.2.2. Four Phase
- 7.2.3. Six Phase
- 7.2.4. Eight Phase
- 7.1. Market Analysis, Insights and Forecast - by Application
- 8. Europe Power Analysis Module Analysis, Insights and Forecast, 2019-2031
- 8.1. Market Analysis, Insights and Forecast - by Application
- 8.1.1. Mechanical Engineering
- 8.1.2. Automotive Industry
- 8.1.3. Aerospace
- 8.1.4. Oil And Gas
- 8.1.5. Chemical Industry
- 8.1.6. Medical Technology
- 8.1.7. Electrical Industry
- 8.2. Market Analysis, Insights and Forecast - by Types
- 8.2.1. Three Phase
- 8.2.2. Four Phase
- 8.2.3. Six Phase
- 8.2.4. Eight Phase
- 8.1. Market Analysis, Insights and Forecast - by Application
- 9. Middle East & Africa Power Analysis Module Analysis, Insights and Forecast, 2019-2031
- 9.1. Market Analysis, Insights and Forecast - by Application
- 9.1.1. Mechanical Engineering
- 9.1.2. Automotive Industry
- 9.1.3. Aerospace
- 9.1.4. Oil And Gas
- 9.1.5. Chemical Industry
- 9.1.6. Medical Technology
- 9.1.7. Electrical Industry
- 9.2. Market Analysis, Insights and Forecast - by Types
- 9.2.1. Three Phase
- 9.2.2. Four Phase
- 9.2.3. Six Phase
- 9.2.4. Eight Phase
- 9.1. Market Analysis, Insights and Forecast - by Application
- 10. Asia Pacific Power Analysis Module Analysis, Insights and Forecast, 2019-2031
- 10.1. Market Analysis, Insights and Forecast - by Application
- 10.1.1. Mechanical Engineering
- 10.1.2. Automotive Industry
- 10.1.3. Aerospace
- 10.1.4. Oil And Gas
- 10.1.5. Chemical Industry
- 10.1.6. Medical Technology
- 10.1.7. Electrical Industry
- 10.2. Market Analysis, Insights and Forecast - by Types
- 10.2.1. Three Phase
- 10.2.2. Four Phase
- 10.2.3. Six Phase
- 10.2.4. Eight Phase
- 10.1. Market Analysis, Insights and Forecast - by Application
- 11. Competitive Analysis
- 11.1. Global Market Share Analysis 2024
- 11.2. Company Profiles
- 11.2.1 Tektronix
- 11.2.1.1. Overview
- 11.2.1.2. Products
- 11.2.1.3. SWOT Analysis
- 11.2.1.4. Recent Developments
- 11.2.1.5. Financials (Based on Availability)
- 11.2.2 Fluke Corporation
- 11.2.2.1. Overview
- 11.2.2.2. Products
- 11.2.2.3. SWOT Analysis
- 11.2.2.4. Recent Developments
- 11.2.2.5. Financials (Based on Availability)
- 11.2.3 National Instruments
- 11.2.3.1. Overview
- 11.2.3.2. Products
- 11.2.3.3. SWOT Analysis
- 11.2.3.4. Recent Developments
- 11.2.3.5. Financials (Based on Availability)
- 11.2.4 Rohde & Schwarz
- 11.2.4.1. Overview
- 11.2.4.2. Products
- 11.2.4.3. SWOT Analysis
- 11.2.4.4. Recent Developments
- 11.2.4.5. Financials (Based on Availability)
- 11.2.5 Chroma ATE Inc.
- 11.2.5.1. Overview
- 11.2.5.2. Products
- 11.2.5.3. SWOT Analysis
- 11.2.5.4. Recent Developments
- 11.2.5.5. Financials (Based on Availability)
- 11.2.6 AMETEK
- 11.2.6.1. Overview
- 11.2.6.2. Products
- 11.2.6.3. SWOT Analysis
- 11.2.6.4. Recent Developments
- 11.2.6.5. Financials (Based on Availability)
- 11.2.7 Cypress Semiconductor Corporation
- 11.2.7.1. Overview
- 11.2.7.2. Products
- 11.2.7.3. SWOT Analysis
- 11.2.7.4. Recent Developments
- 11.2.7.5. Financials (Based on Availability)
- 11.2.8 E-Motec
- 11.2.8.1. Overview
- 11.2.8.2. Products
- 11.2.8.3. SWOT Analysis
- 11.2.8.4. Recent Developments
- 11.2.8.5. Financials (Based on Availability)
- 11.2.9 Gasworld
- 11.2.9.1. Overview
- 11.2.9.2. Products
- 11.2.9.3. SWOT Analysis
- 11.2.9.4. Recent Developments
- 11.2.9.5. Financials (Based on Availability)
- 11.2.10 GCH
- 11.2.10.1. Overview
- 11.2.10.2. Products
- 11.2.10.3. SWOT Analysis
- 11.2.10.4. Recent Developments
- 11.2.10.5. Financials (Based on Availability)
- 11.2.11 HALA Contec GmbH & Co. KG
- 11.2.11.1. Overview
- 11.2.11.2. Products
- 11.2.11.3. SWOT Analysis
- 11.2.11.4. Recent Developments
- 11.2.11.5. Financials (Based on Availability)
- 11.2.12 Hitachi HIGH-TECHNOLOGIES Co.
- 11.2.12.1. Overview
- 11.2.12.2. Products
- 11.2.12.3. SWOT Analysis
- 11.2.12.4. Recent Developments
- 11.2.12.5. Financials (Based on Availability)
- 11.2.13 Ltd.
- 11.2.13.1. Overview
- 11.2.13.2. Products
- 11.2.13.3. SWOT Analysis
- 11.2.13.4. Recent Developments
- 11.2.13.5. Financials (Based on Availability)
- 11.2.14 Janitza electronics GmbH
- 11.2.14.1. Overview
- 11.2.14.2. Products
- 11.2.14.3. SWOT Analysis
- 11.2.14.4. Recent Developments
- 11.2.14.5. Financials (Based on Availability)
- 11.2.15 Keysight
- 11.2.15.1. Overview
- 11.2.15.2. Products
- 11.2.15.3. SWOT Analysis
- 11.2.15.4. Recent Developments
- 11.2.15.5. Financials (Based on Availability)
- 11.2.16 LTTsmart
- 11.2.16.1. Overview
- 11.2.16.2. Products
- 11.2.16.3. SWOT Analysis
- 11.2.16.4. Recent Developments
- 11.2.16.5. Financials (Based on Availability)
- 11.2.17 Mitsubishi Electric
- 11.2.17.1. Overview
- 11.2.17.2. Products
- 11.2.17.3. SWOT Analysis
- 11.2.17.4. Recent Developments
- 11.2.17.5. Financials (Based on Availability)
- 11.2.18 Quarch Technology
- 11.2.18.1. Overview
- 11.2.18.2. Products
- 11.2.18.3. SWOT Analysis
- 11.2.18.4. Recent Developments
- 11.2.18.5. Financials (Based on Availability)
- 11.2.19 RIGOL Technologies
- 11.2.19.1. Overview
- 11.2.19.2. Products
- 11.2.19.3. SWOT Analysis
- 11.2.19.4. Recent Developments
- 11.2.19.5. Financials (Based on Availability)
- 11.2.20 Ltd.
- 11.2.20.1. Overview
- 11.2.20.2. Products
- 11.2.20.3. SWOT Analysis
- 11.2.20.4. Recent Developments
- 11.2.20.5. Financials (Based on Availability)
- 11.2.21 Schneider Electric Co.
- 11.2.21.1. Overview
- 11.2.21.2. Products
- 11.2.21.3. SWOT Analysis
- 11.2.21.4. Recent Developments
- 11.2.21.5. Financials (Based on Availability)
- 11.2.22 Ltd.
- 11.2.22.1. Overview
- 11.2.22.2. Products
- 11.2.22.3. SWOT Analysis
- 11.2.22.4. Recent Developments
- 11.2.22.5. Financials (Based on Availability)
- 11.2.23 Siemens
- 11.2.23.1. Overview
- 11.2.23.2. Products
- 11.2.23.3. SWOT Analysis
- 11.2.23.4. Recent Developments
- 11.2.23.5. Financials (Based on Availability)
- 11.2.24 STMicroelectronics
- 11.2.24.1. Overview
- 11.2.24.2. Products
- 11.2.24.3. SWOT Analysis
- 11.2.24.4. Recent Developments
- 11.2.24.5. Financials (Based on Availability)
- 11.2.25 Yokogawa Test & Measurement Corporation
- 11.2.25.1. Overview
- 11.2.25.2. Products
- 11.2.25.3. SWOT Analysis
- 11.2.25.4. Recent Developments
- 11.2.25.5. Financials (Based on Availability)
- 11.2.1 Tektronix
List of Figures
- Figure 1: Global Power Analysis Module Revenue Breakdown (million, %) by Region 2024 & 2032
- Figure 2: Global Power Analysis Module Volume Breakdown (K, %) by Region 2024 & 2032
- Figure 3: North America Power Analysis Module Revenue (million), by Application 2024 & 2032
- Figure 4: North America Power Analysis Module Volume (K), by Application 2024 & 2032
- Figure 5: North America Power Analysis Module Revenue Share (%), by Application 2024 & 2032
- Figure 6: North America Power Analysis Module Volume Share (%), by Application 2024 & 2032
- Figure 7: North America Power Analysis Module Revenue (million), by Types 2024 & 2032
- Figure 8: North America Power Analysis Module Volume (K), by Types 2024 & 2032
- Figure 9: North America Power Analysis Module Revenue Share (%), by Types 2024 & 2032
- Figure 10: North America Power Analysis Module Volume Share (%), by Types 2024 & 2032
- Figure 11: North America Power Analysis Module Revenue (million), by Country 2024 & 2032
- Figure 12: North America Power Analysis Module Volume (K), by Country 2024 & 2032
- Figure 13: North America Power Analysis Module Revenue Share (%), by Country 2024 & 2032
- Figure 14: North America Power Analysis Module Volume Share (%), by Country 2024 & 2032
- Figure 15: South America Power Analysis Module Revenue (million), by Application 2024 & 2032
- Figure 16: South America Power Analysis Module Volume (K), by Application 2024 & 2032
- Figure 17: South America Power Analysis Module Revenue Share (%), by Application 2024 & 2032
- Figure 18: South America Power Analysis Module Volume Share (%), by Application 2024 & 2032
- Figure 19: South America Power Analysis Module Revenue (million), by Types 2024 & 2032
- Figure 20: South America Power Analysis Module Volume (K), by Types 2024 & 2032
- Figure 21: South America Power Analysis Module Revenue Share (%), by Types 2024 & 2032
- Figure 22: South America Power Analysis Module Volume Share (%), by Types 2024 & 2032
- Figure 23: South America Power Analysis Module Revenue (million), by Country 2024 & 2032
- Figure 24: South America Power Analysis Module Volume (K), by Country 2024 & 2032
- Figure 25: South America Power Analysis Module Revenue Share (%), by Country 2024 & 2032
- Figure 26: South America Power Analysis Module Volume Share (%), by Country 2024 & 2032
- Figure 27: Europe Power Analysis Module Revenue (million), by Application 2024 & 2032
- Figure 28: Europe Power Analysis Module Volume (K), by Application 2024 & 2032
- Figure 29: Europe Power Analysis Module Revenue Share (%), by Application 2024 & 2032
- Figure 30: Europe Power Analysis Module Volume Share (%), by Application 2024 & 2032
- Figure 31: Europe Power Analysis Module Revenue (million), by Types 2024 & 2032
- Figure 32: Europe Power Analysis Module Volume (K), by Types 2024 & 2032
- Figure 33: Europe Power Analysis Module Revenue Share (%), by Types 2024 & 2032
- Figure 34: Europe Power Analysis Module Volume Share (%), by Types 2024 & 2032
- Figure 35: Europe Power Analysis Module Revenue (million), by Country 2024 & 2032
- Figure 36: Europe Power Analysis Module Volume (K), by Country 2024 & 2032
- Figure 37: Europe Power Analysis Module Revenue Share (%), by Country 2024 & 2032
- Figure 38: Europe Power Analysis Module Volume Share (%), by Country 2024 & 2032
- Figure 39: Middle East & Africa Power Analysis Module Revenue (million), by Application 2024 & 2032
- Figure 40: Middle East & Africa Power Analysis Module Volume (K), by Application 2024 & 2032
- Figure 41: Middle East & Africa Power Analysis Module Revenue Share (%), by Application 2024 & 2032
- Figure 42: Middle East & Africa Power Analysis Module Volume Share (%), by Application 2024 & 2032
- Figure 43: Middle East & Africa Power Analysis Module Revenue (million), by Types 2024 & 2032
- Figure 44: Middle East & Africa Power Analysis Module Volume (K), by Types 2024 & 2032
- Figure 45: Middle East & Africa Power Analysis Module Revenue Share (%), by Types 2024 & 2032
- Figure 46: Middle East & Africa Power Analysis Module Volume Share (%), by Types 2024 & 2032
- Figure 47: Middle East & Africa Power Analysis Module Revenue (million), by Country 2024 & 2032
- Figure 48: Middle East & Africa Power Analysis Module Volume (K), by Country 2024 & 2032
- Figure 49: Middle East & Africa Power Analysis Module Revenue Share (%), by Country 2024 & 2032
- Figure 50: Middle East & Africa Power Analysis Module Volume Share (%), by Country 2024 & 2032
- Figure 51: Asia Pacific Power Analysis Module Revenue (million), by Application 2024 & 2032
- Figure 52: Asia Pacific Power Analysis Module Volume (K), by Application 2024 & 2032
- Figure 53: Asia Pacific Power Analysis Module Revenue Share (%), by Application 2024 & 2032
- Figure 54: Asia Pacific Power Analysis Module Volume Share (%), by Application 2024 & 2032
- Figure 55: Asia Pacific Power Analysis Module Revenue (million), by Types 2024 & 2032
- Figure 56: Asia Pacific Power Analysis Module Volume (K), by Types 2024 & 2032
- Figure 57: Asia Pacific Power Analysis Module Revenue Share (%), by Types 2024 & 2032
- Figure 58: Asia Pacific Power Analysis Module Volume Share (%), by Types 2024 & 2032
- Figure 59: Asia Pacific Power Analysis Module Revenue (million), by Country 2024 & 2032
- Figure 60: Asia Pacific Power Analysis Module Volume (K), by Country 2024 & 2032
- Figure 61: Asia Pacific Power Analysis Module Revenue Share (%), by Country 2024 & 2032
- Figure 62: Asia Pacific Power Analysis Module Volume Share (%), by Country 2024 & 2032
List of Tables
- Table 1: Global Power Analysis Module Revenue million Forecast, by Region 2019 & 2032
- Table 2: Global Power Analysis Module Volume K Forecast, by Region 2019 & 2032
- Table 3: Global Power Analysis Module Revenue million Forecast, by Application 2019 & 2032
- Table 4: Global Power Analysis Module Volume K Forecast, by Application 2019 & 2032
- Table 5: Global Power Analysis Module Revenue million Forecast, by Types 2019 & 2032
- Table 6: Global Power Analysis Module Volume K Forecast, by Types 2019 & 2032
- Table 7: Global Power Analysis Module Revenue million Forecast, by Region 2019 & 2032
- Table 8: Global Power Analysis Module Volume K Forecast, by Region 2019 & 2032
- Table 9: Global Power Analysis Module Revenue million Forecast, by Application 2019 & 2032
- Table 10: Global Power Analysis Module Volume K Forecast, by Application 2019 & 2032
- Table 11: Global Power Analysis Module Revenue million Forecast, by Types 2019 & 2032
- Table 12: Global Power Analysis Module Volume K Forecast, by Types 2019 & 2032
- Table 13: Global Power Analysis Module Revenue million Forecast, by Country 2019 & 2032
- Table 14: Global Power Analysis Module Volume K Forecast, by Country 2019 & 2032
- Table 15: United States Power Analysis Module Revenue (million) Forecast, by Application 2019 & 2032
- Table 16: United States Power Analysis Module Volume (K) Forecast, by Application 2019 & 2032
- Table 17: Canada Power Analysis Module Revenue (million) Forecast, by Application 2019 & 2032
- Table 18: Canada Power Analysis Module Volume (K) Forecast, by Application 2019 & 2032
- Table 19: Mexico Power Analysis Module Revenue (million) Forecast, by Application 2019 & 2032
- Table 20: Mexico Power Analysis Module Volume (K) Forecast, by Application 2019 & 2032
- Table 21: Global Power Analysis Module Revenue million Forecast, by Application 2019 & 2032
- Table 22: Global Power Analysis Module Volume K Forecast, by Application 2019 & 2032
- Table 23: Global Power Analysis Module Revenue million Forecast, by Types 2019 & 2032
- Table 24: Global Power Analysis Module Volume K Forecast, by Types 2019 & 2032
- Table 25: Global Power Analysis Module Revenue million Forecast, by Country 2019 & 2032
- Table 26: Global Power Analysis Module Volume K Forecast, by Country 2019 & 2032
- Table 27: Brazil Power Analysis Module Revenue (million) Forecast, by Application 2019 & 2032
- Table 28: Brazil Power Analysis Module Volume (K) Forecast, by Application 2019 & 2032
- Table 29: Argentina Power Analysis Module Revenue (million) Forecast, by Application 2019 & 2032
- Table 30: Argentina Power Analysis Module Volume (K) Forecast, by Application 2019 & 2032
- Table 31: Rest of South America Power Analysis Module Revenue (million) Forecast, by Application 2019 & 2032
- Table 32: Rest of South America Power Analysis Module Volume (K) Forecast, by Application 2019 & 2032
- Table 33: Global Power Analysis Module Revenue million Forecast, by Application 2019 & 2032
- Table 34: Global Power Analysis Module Volume K Forecast, by Application 2019 & 2032
- Table 35: Global Power Analysis Module Revenue million Forecast, by Types 2019 & 2032
- Table 36: Global Power Analysis Module Volume K Forecast, by Types 2019 & 2032
- Table 37: Global Power Analysis Module Revenue million Forecast, by Country 2019 & 2032
- Table 38: Global Power Analysis Module Volume K Forecast, by Country 2019 & 2032
- Table 39: United Kingdom Power Analysis Module Revenue (million) Forecast, by Application 2019 & 2032
- Table 40: United Kingdom Power Analysis Module Volume (K) Forecast, by Application 2019 & 2032
- Table 41: Germany Power Analysis Module Revenue (million) Forecast, by Application 2019 & 2032
- Table 42: Germany Power Analysis Module Volume (K) Forecast, by Application 2019 & 2032
- Table 43: France Power Analysis Module Revenue (million) Forecast, by Application 2019 & 2032
- Table 44: France Power Analysis Module Volume (K) Forecast, by Application 2019 & 2032
- Table 45: Italy Power Analysis Module Revenue (million) Forecast, by Application 2019 & 2032
- Table 46: Italy Power Analysis Module Volume (K) Forecast, by Application 2019 & 2032
- Table 47: Spain Power Analysis Module Revenue (million) Forecast, by Application 2019 & 2032
- Table 48: Spain Power Analysis Module Volume (K) Forecast, by Application 2019 & 2032
- Table 49: Russia Power Analysis Module Revenue (million) Forecast, by Application 2019 & 2032
- Table 50: Russia Power Analysis Module Volume (K) Forecast, by Application 2019 & 2032
- Table 51: Benelux Power Analysis Module Revenue (million) Forecast, by Application 2019 & 2032
- Table 52: Benelux Power Analysis Module Volume (K) Forecast, by Application 2019 & 2032
- Table 53: Nordics Power Analysis Module Revenue (million) Forecast, by Application 2019 & 2032
- Table 54: Nordics Power Analysis Module Volume (K) Forecast, by Application 2019 & 2032
- Table 55: Rest of Europe Power Analysis Module Revenue (million) Forecast, by Application 2019 & 2032
- Table 56: Rest of Europe Power Analysis Module Volume (K) Forecast, by Application 2019 & 2032
- Table 57: Global Power Analysis Module Revenue million Forecast, by Application 2019 & 2032
- Table 58: Global Power Analysis Module Volume K Forecast, by Application 2019 & 2032
- Table 59: Global Power Analysis Module Revenue million Forecast, by Types 2019 & 2032
- Table 60: Global Power Analysis Module Volume K Forecast, by Types 2019 & 2032
- Table 61: Global Power Analysis Module Revenue million Forecast, by Country 2019 & 2032
- Table 62: Global Power Analysis Module Volume K Forecast, by Country 2019 & 2032
- Table 63: Turkey Power Analysis Module Revenue (million) Forecast, by Application 2019 & 2032
- Table 64: Turkey Power Analysis Module Volume (K) Forecast, by Application 2019 & 2032
- Table 65: Israel Power Analysis Module Revenue (million) Forecast, by Application 2019 & 2032
- Table 66: Israel Power Analysis Module Volume (K) Forecast, by Application 2019 & 2032
- Table 67: GCC Power Analysis Module Revenue (million) Forecast, by Application 2019 & 2032
- Table 68: GCC Power Analysis Module Volume (K) Forecast, by Application 2019 & 2032
- Table 69: North Africa Power Analysis Module Revenue (million) Forecast, by Application 2019 & 2032
- Table 70: North Africa Power Analysis Module Volume (K) Forecast, by Application 2019 & 2032
- Table 71: South Africa Power Analysis Module Revenue (million) Forecast, by Application 2019 & 2032
- Table 72: South Africa Power Analysis Module Volume (K) Forecast, by Application 2019 & 2032
- Table 73: Rest of Middle East & Africa Power Analysis Module Revenue (million) Forecast, by Application 2019 & 2032
- Table 74: Rest of Middle East & Africa Power Analysis Module Volume (K) Forecast, by Application 2019 & 2032
- Table 75: Global Power Analysis Module Revenue million Forecast, by Application 2019 & 2032
- Table 76: Global Power Analysis Module Volume K Forecast, by Application 2019 & 2032
- Table 77: Global Power Analysis Module Revenue million Forecast, by Types 2019 & 2032
- Table 78: Global Power Analysis Module Volume K Forecast, by Types 2019 & 2032
- Table 79: Global Power Analysis Module Revenue million Forecast, by Country 2019 & 2032
- Table 80: Global Power Analysis Module Volume K Forecast, by Country 2019 & 2032
- Table 81: China Power Analysis Module Revenue (million) Forecast, by Application 2019 & 2032
- Table 82: China Power Analysis Module Volume (K) Forecast, by Application 2019 & 2032
- Table 83: India Power Analysis Module Revenue (million) Forecast, by Application 2019 & 2032
- Table 84: India Power Analysis Module Volume (K) Forecast, by Application 2019 & 2032
- Table 85: Japan Power Analysis Module Revenue (million) Forecast, by Application 2019 & 2032
- Table 86: Japan Power Analysis Module Volume (K) Forecast, by Application 2019 & 2032
- Table 87: South Korea Power Analysis Module Revenue (million) Forecast, by Application 2019 & 2032
- Table 88: South Korea Power Analysis Module Volume (K) Forecast, by Application 2019 & 2032
- Table 89: ASEAN Power Analysis Module Revenue (million) Forecast, by Application 2019 & 2032
- Table 90: ASEAN Power Analysis Module Volume (K) Forecast, by Application 2019 & 2032
- Table 91: Oceania Power Analysis Module Revenue (million) Forecast, by Application 2019 & 2032
- Table 92: Oceania Power Analysis Module Volume (K) Forecast, by Application 2019 & 2032
- Table 93: Rest of Asia Pacific Power Analysis Module Revenue (million) Forecast, by Application 2019 & 2032
- Table 94: Rest of Asia Pacific Power Analysis Module Volume (K) Forecast, by Application 2019 & 2032
Frequently Asked Questions
1. What is the projected Compound Annual Growth Rate (CAGR) of the Power Analysis Module?
The projected CAGR is approximately 8.3%.
2. Which companies are prominent players in the Power Analysis Module?
Key companies in the market include Tektronix, Fluke Corporation, National Instruments, Rohde & Schwarz, Chroma ATE Inc., AMETEK, Cypress Semiconductor Corporation, E-Motec, Gasworld, GCH, HALA Contec GmbH & Co. KG, Hitachi HIGH-TECHNOLOGIES Co., Ltd., Janitza electronics GmbH, Keysight, LTTsmart, Mitsubishi Electric, Quarch Technology, RIGOL Technologies, Ltd., Schneider Electric Co., Ltd., Siemens, STMicroelectronics, Yokogawa Test & Measurement Corporation.
3. What are the main segments of the Power Analysis Module?
The market segments include Application, Types.
4. Can you provide details about the market size?
The market size is estimated to be USD 1794 million as of 2022.
5. What are some drivers contributing to market growth?
N/A
6. What are the notable trends driving market growth?
N/A
7. Are there any restraints impacting market growth?
N/A
8. Can you provide examples of recent developments in the market?
N/A
9. What pricing options are available for accessing the report?
Pricing options include single-user, multi-user, and enterprise licenses priced at USD 3350.00, USD 5025.00, and USD 6700.00 respectively.
10. Is the market size provided in terms of value or volume?
The market size is provided in terms of value, measured in million and volume, measured in K.
11. Are there any specific market keywords associated with the report?
Yes, the market keyword associated with the report is "Power Analysis Module," which aids in identifying and referencing the specific market segment covered.
12. How do I determine which pricing option suits my needs best?
The pricing options vary based on user requirements and access needs. Individual users may opt for single-user licenses, while businesses requiring broader access may choose multi-user or enterprise licenses for cost-effective access to the report.
13. Are there any additional resources or data provided in the Power Analysis Module report?
While the report offers comprehensive insights, it's advisable to review the specific contents or supplementary materials provided to ascertain if additional resources or data are available.
14. How can I stay updated on further developments or reports in the Power Analysis Module?
To stay informed about further developments, trends, and reports in the Power Analysis Module, consider subscribing to industry newsletters, following relevant companies and organizations, or regularly checking reputable industry news sources and publications.
Methodology
Step 1 - Identification of Relevant Samples Size from Population Database


Step 2 - Approaches for Defining Global Market Size (Value, Volume* & Price*)

Note*: In applicable scenarios
Step 3 - Data Sources
Primary Research
- Web Analytics
- Survey Reports
- Research Institute
- Latest Research Reports
- Opinion Leaders
Secondary Research
- Annual Reports
- White Paper
- Latest Press Release
- Industry Association
- Paid Database
- Investor Presentations

Step 4 - Data Triangulation
Involves using different sources of information in order to increase the validity of a study
These sources are likely to be stakeholders in a program - participants, other researchers, program staff, other community members, and so on.
Then we put all data in single framework & apply various statistical tools to find out the dynamic on the market.
During the analysis stage, feedback from the stakeholder groups would be compared to determine areas of agreement as well as areas of divergence


