
Key Insights
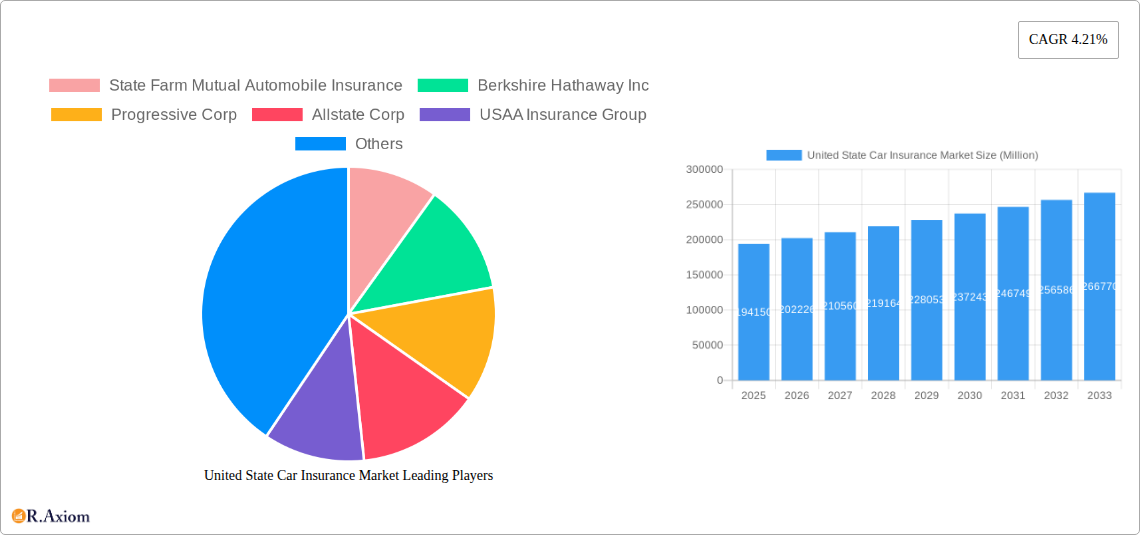
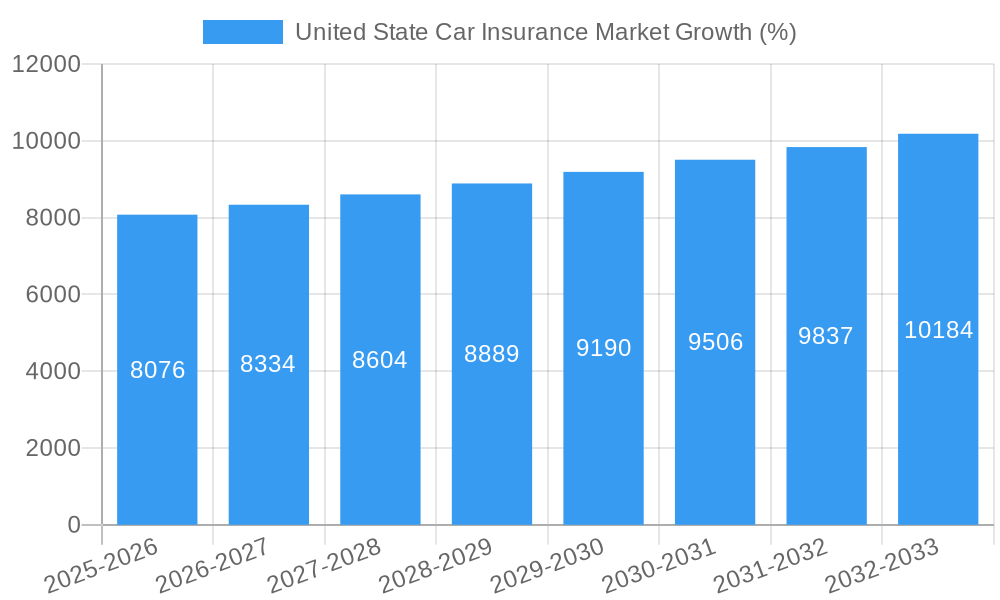
The United States car insurance market, valued at $194.15 billion in 2025, is projected to experience robust growth, driven by a rising number of vehicles on the road, increasing urbanization leading to higher accident rates, and a growing awareness of the importance of comprehensive coverage. The market's Compound Annual Growth Rate (CAGR) of 4.21% from 2019 to 2025 suggests a consistent upward trajectory. Key growth drivers include the expansion of telematics-based insurance, offering personalized premiums based on driving behavior, and the increasing adoption of digital platforms for policy management and claims processing. Furthermore, the rising prevalence of autonomous vehicles, while presenting challenges, also offers opportunities for insurers to develop innovative insurance products tailored to this evolving technology. Competitive pressures from established players like State Farm, Berkshire Hathaway, and Progressive, alongside newer entrants leveraging technology, are shaping the market landscape. Regulatory changes and fluctuations in fuel prices can act as restraints, impacting consumer spending on insurance and influencing pricing strategies. The market is segmented based on coverage type (e.g., liability, collision, comprehensive), distribution channels (e.g., online, agents), and vehicle type. The forecast period (2025-2033) anticipates continued growth, although the pace may be influenced by macroeconomic factors and technological advancements.
The market's considerable size and steady growth make it attractive for both existing and new players. However, success will depend on adapting to changing consumer preferences, embracing technological advancements, and effectively managing regulatory hurdles. Companies are increasingly focusing on customer experience, offering personalized services and leveraging data analytics to improve risk assessment and pricing accuracy. This trend will likely accelerate in the coming years, pushing further innovation and competition in the US car insurance market. The projected growth also presents lucrative opportunities for investments in Insurtech solutions and data analytics infrastructure to better serve the expanding customer base and anticipate emerging trends.
United States Car Insurance Market: 2019-2033 Forecast
This comprehensive report provides a detailed analysis of the United States car insurance market, offering actionable insights for industry stakeholders, investors, and strategic decision-makers. Covering the period from 2019 to 2033, with 2025 as the base and estimated year, this report offers a historical overview (2019-2024) and a robust forecast (2025-2033). The market size is projected to reach xx Million by 2033, exhibiting a CAGR of xx% during the forecast period.
United States Car Insurance Market Concentration & Innovation
The US car insurance market is characterized by a high degree of concentration, with a few major players dominating the landscape. State Farm Mutual Automobile Insurance, Berkshire Hathaway Inc. (through Geico), Progressive Corp, Allstate Corp, USAA Insurance Group, Liberty Mutual, Farmers Insurance Group of Companies, Nationwide Mutual Group, American Family Insurance Group, and Travelers Companies Inc. are some of the key players, although the market is not exhaustive to this list. These companies collectively hold a significant market share, estimated at approximately xx% in 2025. Market share fluctuations are influenced by factors such as aggressive marketing campaigns, technological innovations, and strategic mergers and acquisitions (M&A). Recent M&A activity, while not publicly disclosing specific deal values in all cases, reflects consolidation efforts within the sector. The regulatory framework, including state-level regulations on pricing and coverage, significantly impacts market dynamics. Innovation is driven by the need to enhance customer experience, improve operational efficiency, and leverage technological advancements such as AI and telematics for risk assessment and fraud detection. Product substitution is limited, with the core product remaining fairly consistent, although features and pricing strategies vary considerably. End-user trends indicate a growing demand for personalized and digitally driven insurance solutions, influencing the types of products offered.
United States Car Insurance Market Industry Trends & Insights
The US car insurance market is experiencing significant transformation fueled by several key factors. Technological disruptions, particularly the adoption of AI and telematics, are altering risk assessment, claims processing, and customer service. Consumer preferences are shifting towards digital platforms, personalized coverage options, and value-added services. The market's competitive dynamics are intense, with companies continuously innovating to attract and retain customers. The increasing adoption of Usage-Based Insurance (UBI) programs leverages telematics to personalize premiums based on driving behavior, creating a more equitable and potentially cost-effective system. The market is witnessing a rising demand for add-on coverage options beyond standard liability and collision, catering to the needs of diverse customer segments. Regulatory changes at both federal and state levels have implications for market growth and profitability. The average annual growth rate (CAGR) of the market during the forecast period is estimated at xx%, driven by these evolving factors. Market penetration continues to expand, particularly in underserved segments and with the increasing adoption of vehicle ownership among diverse populations.
Dominant Markets & Segments in United States Car Insurance Market
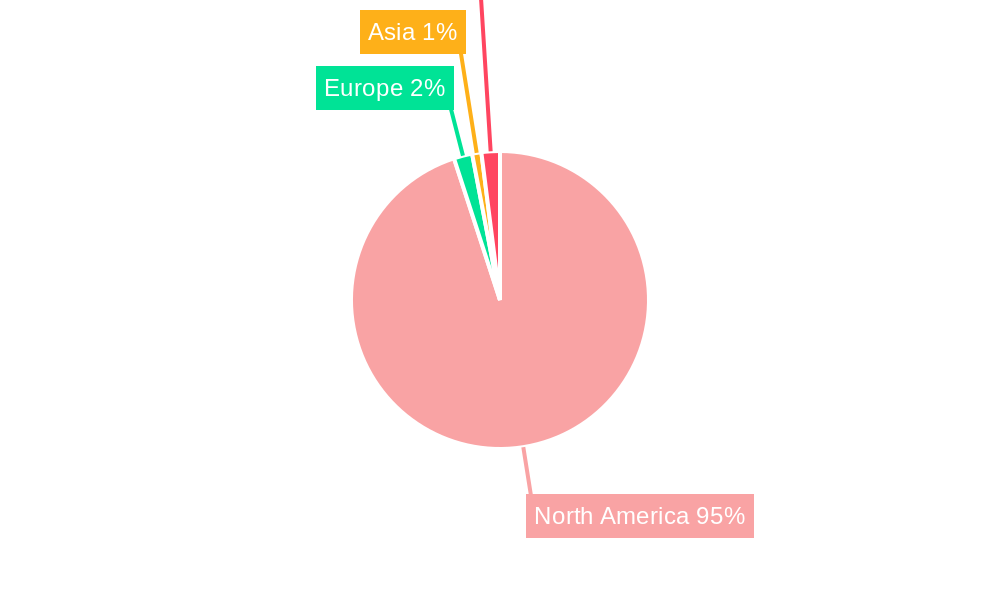
The dominant segments within the US car insurance market include personal auto insurance and commercial auto insurance, with personal auto insurance currently holding a larger market share. Regional dominance varies based on population density, economic conditions, and insurance penetration rates. California, Texas, Florida, and New York are some of the leading states in terms of market size.
- Key Drivers for Leading Regions:
- High population density
- Large vehicle ownership rates
- Favorable economic conditions
- Robust infrastructure
The dominance of specific segments is largely influenced by factors such as demographic shifts, economic growth, and evolving consumer needs. The personal auto insurance segment thrives on high vehicle ownership and a large population base, while the commercial auto insurance segment shows strong growth due to the expansion of various sectors requiring commercial vehicle coverage.
United States Car Insurance Market Product Developments
Recent product developments in the US car insurance market emphasize technological advancements and enhanced customer experience. Insurers are integrating telematics data for more accurate risk assessment and personalized pricing. Mobile apps offer streamlined policy management, claims filing, and customer support. Insurtech companies are introducing innovative products and services, challenging traditional players and fostering competition. These developments aim to attract tech-savvy consumers and improve operational efficiency. The market fit for these innovations is strong, reflecting consumer demand for convenience and personalized insurance solutions.
Report Scope & Segmentation Analysis
This report segments the US car insurance market by coverage type (liability, collision, comprehensive, etc.), vehicle type (personal, commercial), distribution channel (direct, independent agents, brokers), and customer demographics (age, location, driving history). Each segment exhibits unique growth projections and competitive dynamics. For example, the personal auto insurance segment is expected to witness significant growth driven by population increases and rising vehicle ownership. The commercial auto insurance segment also shows significant potential, driven by the expansion of the logistics and transportation sectors. The market size for each segment is projected to grow at varying rates during the forecast period. Competitive intensity varies across segments, with some exhibiting more intense competition than others.
Key Drivers of United States Car Insurance Market Growth
Several factors drive the growth of the US car insurance market. Technological advancements like AI and telematics are improving efficiency and personalization. Economic growth leads to increased vehicle ownership and a larger insured population. Favorable regulatory frameworks support market expansion. Government regulations related to mandatory car insurance in certain states contribute to market growth. The rising demand for add-on services and coverage options, along with the growing awareness of car insurance among younger and newly licensed drivers, contributes to increased demand for coverage.
Challenges in the United State Car Insurance Market Sector
The US car insurance market faces several challenges. Stringent regulatory requirements, including rate approvals and compliance standards, can create hurdles for insurers. Supply chain disruptions in the automotive industry can affect the repair process. Intense competition among insurers puts pressure on pricing and profitability, especially considering the significant market penetration already attained. Fraudulent claims and rising insurance costs add to the operational complexities and financial implications faced by the market players. These factors can negatively affect the growth trajectory and the overall stability of the market.
Emerging Opportunities in United State Car Insurance Market
The US car insurance market presents significant opportunities. The growth of connected cars and the proliferation of telematics data create opportunities for new product innovations and personalized services. Expansion into underserved markets and customer segments presents potential for growth. Developing innovative insurance solutions tailored to specific consumer needs opens new avenues for revenue generation. The increasing adoption of Insurtech and the integration of AI and machine learning are creating avenues for enhancing service levels, improving operational efficiency, and controlling costs for the insurers.
Leading Players in the United States Car Insurance Market Market
- State Farm Mutual Automobile Insurance
- Berkshire Hathaway Inc.
- Progressive Corp
- Allstate Corp
- USAA Insurance Group
- Liberty Mutual
- Farmers Insurance Group of Companies
- Nationwide Mutual Group
- American Family Insurance Group
- Travelers Companies Inc
List Not Exhaustive
Key Developments in United States Car Insurance Market Industry
August 2023: AXA S.A. launched STeP, a digital claims solution designed to simplify the car insurance claims process, enhancing customer experience and operational efficiency. This initiative reflects the industry's ongoing push towards digital transformation and improved customer service.
May 2022: GEICO partnered with Tractable, an AI technology company, to leverage AI in assessing car damage during the claims process. This collaboration showcases the increasing adoption of AI and machine learning to improve speed and accuracy in claims processing. This advancement has the potential to significantly reduce claims processing times and associated costs.
Strategic Outlook for United States Car Insurance Market Market
The US car insurance market is poised for continued growth, driven by technological innovation, evolving consumer preferences, and favorable economic conditions. The increasing adoption of telematics, AI, and data analytics will transform risk assessment, pricing, and claims processing. Insurers who invest in digital technologies and personalized customer experiences will be well-positioned to capitalize on future opportunities. The market's strategic outlook is positive, with significant potential for growth and innovation in the coming years.
United State Car Insurance Market Segmentation
-
1. Coverage
- 1.1. Third-Party Liability Coverage
- 1.2. Collision/Comprehensive/Other Optional Coverage
-
2. Application
- 2.1. Personal Vehicles
- 2.2. Commercial Vehicles
-
3. Distribution Channel
- 3.1. Agents
- 3.2. Banks
- 3.3. Brokers
- 3.4. Other Distribution Channel
United State Car Insurance Market Segmentation By Geography
-
1. North America
- 1.1. United States
- 1.2. Canada
- 1.3. Mexico
-
2. South America
- 2.1. Brazil
- 2.2. Argentina
- 2.3. Rest of South America
-
3. Europe
- 3.1. United Kingdom
- 3.2. Germany
- 3.3. France
- 3.4. Italy
- 3.5. Spain
- 3.6. Russia
- 3.7. Benelux
- 3.8. Nordics
- 3.9. Rest of Europe
-
4. Middle East & Africa
- 4.1. Turkey
- 4.2. Israel
- 4.3. GCC
- 4.4. North Africa
- 4.5. South Africa
- 4.6. Rest of Middle East & Africa
-
5. Asia Pacific
- 5.1. China
- 5.2. India
- 5.3. Japan
- 5.4. South Korea
- 5.5. ASEAN
- 5.6. Oceania
- 5.7. Rest of Asia Pacific
United State Car Insurance Market REPORT HIGHLIGHTS
| Aspects | Details |
|---|---|
| Study Period | 2019-2033 |
| Base Year | 2024 |
| Estimated Year | 2025 |
| Forecast Period | 2025-2033 |
| Historical Period | 2019-2024 |
| Growth Rate | CAGR of 4.21% from 2019-2033 |
| Segmentation |
|
Table of Contents
- 1. Introduction
- 1.1. Research Scope
- 1.2. Market Segmentation
- 1.3. Research Methodology
- 1.4. Definitions and Assumptions
- 2. Executive Summary
- 2.1. Introduction
- 3. Market Dynamics
- 3.1. Introduction
- 3.2. Market Drivers
- 3.2.1. Rising Number of Accidents Drives The Market; An increase in Road Traffic Accidents Drives The Market
- 3.3. Market Restrains
- 3.3.1. Rising Number of Accidents Drives The Market; An increase in Road Traffic Accidents Drives The Market
- 3.4. Market Trends
- 3.4.1. Rise In Number Of Traffic Accidents
- 4. Market Factor Analysis
- 4.1. Porters Five Forces
- 4.2. Supply/Value Chain
- 4.3. PESTEL analysis
- 4.4. Market Entropy
- 4.5. Patent/Trademark Analysis
- 5. Global United State Car Insurance Market Analysis, Insights and Forecast, 2019-2031
- 5.1. Market Analysis, Insights and Forecast - by Coverage
- 5.1.1. Third-Party Liability Coverage
- 5.1.2. Collision/Comprehensive/Other Optional Coverage
- 5.2. Market Analysis, Insights and Forecast - by Application
- 5.2.1. Personal Vehicles
- 5.2.2. Commercial Vehicles
- 5.3. Market Analysis, Insights and Forecast - by Distribution Channel
- 5.3.1. Agents
- 5.3.2. Banks
- 5.3.3. Brokers
- 5.3.4. Other Distribution Channel
- 5.4. Market Analysis, Insights and Forecast - by Region
- 5.4.1. North America
- 5.4.2. South America
- 5.4.3. Europe
- 5.4.4. Middle East & Africa
- 5.4.5. Asia Pacific
- 5.1. Market Analysis, Insights and Forecast - by Coverage
- 6. North America United State Car Insurance Market Analysis, Insights and Forecast, 2019-2031
- 6.1. Market Analysis, Insights and Forecast - by Coverage
- 6.1.1. Third-Party Liability Coverage
- 6.1.2. Collision/Comprehensive/Other Optional Coverage
- 6.2. Market Analysis, Insights and Forecast - by Application
- 6.2.1. Personal Vehicles
- 6.2.2. Commercial Vehicles
- 6.3. Market Analysis, Insights and Forecast - by Distribution Channel
- 6.3.1. Agents
- 6.3.2. Banks
- 6.3.3. Brokers
- 6.3.4. Other Distribution Channel
- 6.1. Market Analysis, Insights and Forecast - by Coverage
- 7. South America United State Car Insurance Market Analysis, Insights and Forecast, 2019-2031
- 7.1. Market Analysis, Insights and Forecast - by Coverage
- 7.1.1. Third-Party Liability Coverage
- 7.1.2. Collision/Comprehensive/Other Optional Coverage
- 7.2. Market Analysis, Insights and Forecast - by Application
- 7.2.1. Personal Vehicles
- 7.2.2. Commercial Vehicles
- 7.3. Market Analysis, Insights and Forecast - by Distribution Channel
- 7.3.1. Agents
- 7.3.2. Banks
- 7.3.3. Brokers
- 7.3.4. Other Distribution Channel
- 7.1. Market Analysis, Insights and Forecast - by Coverage
- 8. Europe United State Car Insurance Market Analysis, Insights and Forecast, 2019-2031
- 8.1. Market Analysis, Insights and Forecast - by Coverage
- 8.1.1. Third-Party Liability Coverage
- 8.1.2. Collision/Comprehensive/Other Optional Coverage
- 8.2. Market Analysis, Insights and Forecast - by Application
- 8.2.1. Personal Vehicles
- 8.2.2. Commercial Vehicles
- 8.3. Market Analysis, Insights and Forecast - by Distribution Channel
- 8.3.1. Agents
- 8.3.2. Banks
- 8.3.3. Brokers
- 8.3.4. Other Distribution Channel
- 8.1. Market Analysis, Insights and Forecast - by Coverage
- 9. Middle East & Africa United State Car Insurance Market Analysis, Insights and Forecast, 2019-2031
- 9.1. Market Analysis, Insights and Forecast - by Coverage
- 9.1.1. Third-Party Liability Coverage
- 9.1.2. Collision/Comprehensive/Other Optional Coverage
- 9.2. Market Analysis, Insights and Forecast - by Application
- 9.2.1. Personal Vehicles
- 9.2.2. Commercial Vehicles
- 9.3. Market Analysis, Insights and Forecast - by Distribution Channel
- 9.3.1. Agents
- 9.3.2. Banks
- 9.3.3. Brokers
- 9.3.4. Other Distribution Channel
- 9.1. Market Analysis, Insights and Forecast - by Coverage
- 10. Asia Pacific United State Car Insurance Market Analysis, Insights and Forecast, 2019-2031
- 10.1. Market Analysis, Insights and Forecast - by Coverage
- 10.1.1. Third-Party Liability Coverage
- 10.1.2. Collision/Comprehensive/Other Optional Coverage
- 10.2. Market Analysis, Insights and Forecast - by Application
- 10.2.1. Personal Vehicles
- 10.2.2. Commercial Vehicles
- 10.3. Market Analysis, Insights and Forecast - by Distribution Channel
- 10.3.1. Agents
- 10.3.2. Banks
- 10.3.3. Brokers
- 10.3.4. Other Distribution Channel
- 10.1. Market Analysis, Insights and Forecast - by Coverage
- 11. Competitive Analysis
- 11.1. Global Market Share Analysis 2024
- 11.2. Company Profiles
- 11.2.1 State Farm Mutual Automobile Insurance
- 11.2.1.1. Overview
- 11.2.1.2. Products
- 11.2.1.3. SWOT Analysis
- 11.2.1.4. Recent Developments
- 11.2.1.5. Financials (Based on Availability)
- 11.2.2 Berkshire Hathaway Inc
- 11.2.2.1. Overview
- 11.2.2.2. Products
- 11.2.2.3. SWOT Analysis
- 11.2.2.4. Recent Developments
- 11.2.2.5. Financials (Based on Availability)
- 11.2.3 Progressive Corp
- 11.2.3.1. Overview
- 11.2.3.2. Products
- 11.2.3.3. SWOT Analysis
- 11.2.3.4. Recent Developments
- 11.2.3.5. Financials (Based on Availability)
- 11.2.4 Allstate Corp
- 11.2.4.1. Overview
- 11.2.4.2. Products
- 11.2.4.3. SWOT Analysis
- 11.2.4.4. Recent Developments
- 11.2.4.5. Financials (Based on Availability)
- 11.2.5 USAA Insurance Group
- 11.2.5.1. Overview
- 11.2.5.2. Products
- 11.2.5.3. SWOT Analysis
- 11.2.5.4. Recent Developments
- 11.2.5.5. Financials (Based on Availability)
- 11.2.6 Liberty Mutual
- 11.2.6.1. Overview
- 11.2.6.2. Products
- 11.2.6.3. SWOT Analysis
- 11.2.6.4. Recent Developments
- 11.2.6.5. Financials (Based on Availability)
- 11.2.7 Farmers Insurance Group of Companies
- 11.2.7.1. Overview
- 11.2.7.2. Products
- 11.2.7.3. SWOT Analysis
- 11.2.7.4. Recent Developments
- 11.2.7.5. Financials (Based on Availability)
- 11.2.8 Nationwide Mutual Group
- 11.2.8.1. Overview
- 11.2.8.2. Products
- 11.2.8.3. SWOT Analysis
- 11.2.8.4. Recent Developments
- 11.2.8.5. Financials (Based on Availability)
- 11.2.9 American Family Insurance Group
- 11.2.9.1. Overview
- 11.2.9.2. Products
- 11.2.9.3. SWOT Analysis
- 11.2.9.4. Recent Developments
- 11.2.9.5. Financials (Based on Availability)
- 11.2.10 Travelers Companies Inc **List Not Exhaustive
- 11.2.10.1. Overview
- 11.2.10.2. Products
- 11.2.10.3. SWOT Analysis
- 11.2.10.4. Recent Developments
- 11.2.10.5. Financials (Based on Availability)
- 11.2.1 State Farm Mutual Automobile Insurance
List of Figures
- Figure 1: Global United State Car Insurance Market Revenue Breakdown (Million, %) by Region 2024 & 2032
- Figure 2: Global United State Car Insurance Market Volume Breakdown (Billion, %) by Region 2024 & 2032
- Figure 3: North America United State Car Insurance Market Revenue (Million), by Coverage 2024 & 2032
- Figure 4: North America United State Car Insurance Market Volume (Billion), by Coverage 2024 & 2032
- Figure 5: North America United State Car Insurance Market Revenue Share (%), by Coverage 2024 & 2032
- Figure 6: North America United State Car Insurance Market Volume Share (%), by Coverage 2024 & 2032
- Figure 7: North America United State Car Insurance Market Revenue (Million), by Application 2024 & 2032
- Figure 8: North America United State Car Insurance Market Volume (Billion), by Application 2024 & 2032
- Figure 9: North America United State Car Insurance Market Revenue Share (%), by Application 2024 & 2032
- Figure 10: North America United State Car Insurance Market Volume Share (%), by Application 2024 & 2032
- Figure 11: North America United State Car Insurance Market Revenue (Million), by Distribution Channel 2024 & 2032
- Figure 12: North America United State Car Insurance Market Volume (Billion), by Distribution Channel 2024 & 2032
- Figure 13: North America United State Car Insurance Market Revenue Share (%), by Distribution Channel 2024 & 2032
- Figure 14: North America United State Car Insurance Market Volume Share (%), by Distribution Channel 2024 & 2032
- Figure 15: North America United State Car Insurance Market Revenue (Million), by Country 2024 & 2032
- Figure 16: North America United State Car Insurance Market Volume (Billion), by Country 2024 & 2032
- Figure 17: North America United State Car Insurance Market Revenue Share (%), by Country 2024 & 2032
- Figure 18: North America United State Car Insurance Market Volume Share (%), by Country 2024 & 2032
- Figure 19: South America United State Car Insurance Market Revenue (Million), by Coverage 2024 & 2032
- Figure 20: South America United State Car Insurance Market Volume (Billion), by Coverage 2024 & 2032
- Figure 21: South America United State Car Insurance Market Revenue Share (%), by Coverage 2024 & 2032
- Figure 22: South America United State Car Insurance Market Volume Share (%), by Coverage 2024 & 2032
- Figure 23: South America United State Car Insurance Market Revenue (Million), by Application 2024 & 2032
- Figure 24: South America United State Car Insurance Market Volume (Billion), by Application 2024 & 2032
- Figure 25: South America United State Car Insurance Market Revenue Share (%), by Application 2024 & 2032
- Figure 26: South America United State Car Insurance Market Volume Share (%), by Application 2024 & 2032
- Figure 27: South America United State Car Insurance Market Revenue (Million), by Distribution Channel 2024 & 2032
- Figure 28: South America United State Car Insurance Market Volume (Billion), by Distribution Channel 2024 & 2032
- Figure 29: South America United State Car Insurance Market Revenue Share (%), by Distribution Channel 2024 & 2032
- Figure 30: South America United State Car Insurance Market Volume Share (%), by Distribution Channel 2024 & 2032
- Figure 31: South America United State Car Insurance Market Revenue (Million), by Country 2024 & 2032
- Figure 32: South America United State Car Insurance Market Volume (Billion), by Country 2024 & 2032
- Figure 33: South America United State Car Insurance Market Revenue Share (%), by Country 2024 & 2032
- Figure 34: South America United State Car Insurance Market Volume Share (%), by Country 2024 & 2032
- Figure 35: Europe United State Car Insurance Market Revenue (Million), by Coverage 2024 & 2032
- Figure 36: Europe United State Car Insurance Market Volume (Billion), by Coverage 2024 & 2032
- Figure 37: Europe United State Car Insurance Market Revenue Share (%), by Coverage 2024 & 2032
- Figure 38: Europe United State Car Insurance Market Volume Share (%), by Coverage 2024 & 2032
- Figure 39: Europe United State Car Insurance Market Revenue (Million), by Application 2024 & 2032
- Figure 40: Europe United State Car Insurance Market Volume (Billion), by Application 2024 & 2032
- Figure 41: Europe United State Car Insurance Market Revenue Share (%), by Application 2024 & 2032
- Figure 42: Europe United State Car Insurance Market Volume Share (%), by Application 2024 & 2032
- Figure 43: Europe United State Car Insurance Market Revenue (Million), by Distribution Channel 2024 & 2032
- Figure 44: Europe United State Car Insurance Market Volume (Billion), by Distribution Channel 2024 & 2032
- Figure 45: Europe United State Car Insurance Market Revenue Share (%), by Distribution Channel 2024 & 2032
- Figure 46: Europe United State Car Insurance Market Volume Share (%), by Distribution Channel 2024 & 2032
- Figure 47: Europe United State Car Insurance Market Revenue (Million), by Country 2024 & 2032
- Figure 48: Europe United State Car Insurance Market Volume (Billion), by Country 2024 & 2032
- Figure 49: Europe United State Car Insurance Market Revenue Share (%), by Country 2024 & 2032
- Figure 50: Europe United State Car Insurance Market Volume Share (%), by Country 2024 & 2032
- Figure 51: Middle East & Africa United State Car Insurance Market Revenue (Million), by Coverage 2024 & 2032
- Figure 52: Middle East & Africa United State Car Insurance Market Volume (Billion), by Coverage 2024 & 2032
- Figure 53: Middle East & Africa United State Car Insurance Market Revenue Share (%), by Coverage 2024 & 2032
- Figure 54: Middle East & Africa United State Car Insurance Market Volume Share (%), by Coverage 2024 & 2032
- Figure 55: Middle East & Africa United State Car Insurance Market Revenue (Million), by Application 2024 & 2032
- Figure 56: Middle East & Africa United State Car Insurance Market Volume (Billion), by Application 2024 & 2032
- Figure 57: Middle East & Africa United State Car Insurance Market Revenue Share (%), by Application 2024 & 2032
- Figure 58: Middle East & Africa United State Car Insurance Market Volume Share (%), by Application 2024 & 2032
- Figure 59: Middle East & Africa United State Car Insurance Market Revenue (Million), by Distribution Channel 2024 & 2032
- Figure 60: Middle East & Africa United State Car Insurance Market Volume (Billion), by Distribution Channel 2024 & 2032
- Figure 61: Middle East & Africa United State Car Insurance Market Revenue Share (%), by Distribution Channel 2024 & 2032
- Figure 62: Middle East & Africa United State Car Insurance Market Volume Share (%), by Distribution Channel 2024 & 2032
- Figure 63: Middle East & Africa United State Car Insurance Market Revenue (Million), by Country 2024 & 2032
- Figure 64: Middle East & Africa United State Car Insurance Market Volume (Billion), by Country 2024 & 2032
- Figure 65: Middle East & Africa United State Car Insurance Market Revenue Share (%), by Country 2024 & 2032
- Figure 66: Middle East & Africa United State Car Insurance Market Volume Share (%), by Country 2024 & 2032
- Figure 67: Asia Pacific United State Car Insurance Market Revenue (Million), by Coverage 2024 & 2032
- Figure 68: Asia Pacific United State Car Insurance Market Volume (Billion), by Coverage 2024 & 2032
- Figure 69: Asia Pacific United State Car Insurance Market Revenue Share (%), by Coverage 2024 & 2032
- Figure 70: Asia Pacific United State Car Insurance Market Volume Share (%), by Coverage 2024 & 2032
- Figure 71: Asia Pacific United State Car Insurance Market Revenue (Million), by Application 2024 & 2032
- Figure 72: Asia Pacific United State Car Insurance Market Volume (Billion), by Application 2024 & 2032
- Figure 73: Asia Pacific United State Car Insurance Market Revenue Share (%), by Application 2024 & 2032
- Figure 74: Asia Pacific United State Car Insurance Market Volume Share (%), by Application 2024 & 2032
- Figure 75: Asia Pacific United State Car Insurance Market Revenue (Million), by Distribution Channel 2024 & 2032
- Figure 76: Asia Pacific United State Car Insurance Market Volume (Billion), by Distribution Channel 2024 & 2032
- Figure 77: Asia Pacific United State Car Insurance Market Revenue Share (%), by Distribution Channel 2024 & 2032
- Figure 78: Asia Pacific United State Car Insurance Market Volume Share (%), by Distribution Channel 2024 & 2032
- Figure 79: Asia Pacific United State Car Insurance Market Revenue (Million), by Country 2024 & 2032
- Figure 80: Asia Pacific United State Car Insurance Market Volume (Billion), by Country 2024 & 2032
- Figure 81: Asia Pacific United State Car Insurance Market Revenue Share (%), by Country 2024 & 2032
- Figure 82: Asia Pacific United State Car Insurance Market Volume Share (%), by Country 2024 & 2032
List of Tables
- Table 1: Global United State Car Insurance Market Revenue Million Forecast, by Region 2019 & 2032
- Table 2: Global United State Car Insurance Market Volume Billion Forecast, by Region 2019 & 2032
- Table 3: Global United State Car Insurance Market Revenue Million Forecast, by Coverage 2019 & 2032
- Table 4: Global United State Car Insurance Market Volume Billion Forecast, by Coverage 2019 & 2032
- Table 5: Global United State Car Insurance Market Revenue Million Forecast, by Application 2019 & 2032
- Table 6: Global United State Car Insurance Market Volume Billion Forecast, by Application 2019 & 2032
- Table 7: Global United State Car Insurance Market Revenue Million Forecast, by Distribution Channel 2019 & 2032
- Table 8: Global United State Car Insurance Market Volume Billion Forecast, by Distribution Channel 2019 & 2032
- Table 9: Global United State Car Insurance Market Revenue Million Forecast, by Region 2019 & 2032
- Table 10: Global United State Car Insurance Market Volume Billion Forecast, by Region 2019 & 2032
- Table 11: Global United State Car Insurance Market Revenue Million Forecast, by Coverage 2019 & 2032
- Table 12: Global United State Car Insurance Market Volume Billion Forecast, by Coverage 2019 & 2032
- Table 13: Global United State Car Insurance Market Revenue Million Forecast, by Application 2019 & 2032
- Table 14: Global United State Car Insurance Market Volume Billion Forecast, by Application 2019 & 2032
- Table 15: Global United State Car Insurance Market Revenue Million Forecast, by Distribution Channel 2019 & 2032
- Table 16: Global United State Car Insurance Market Volume Billion Forecast, by Distribution Channel 2019 & 2032
- Table 17: Global United State Car Insurance Market Revenue Million Forecast, by Country 2019 & 2032
- Table 18: Global United State Car Insurance Market Volume Billion Forecast, by Country 2019 & 2032
- Table 19: United States United State Car Insurance Market Revenue (Million) Forecast, by Application 2019 & 2032
- Table 20: United States United State Car Insurance Market Volume (Billion) Forecast, by Application 2019 & 2032
- Table 21: Canada United State Car Insurance Market Revenue (Million) Forecast, by Application 2019 & 2032
- Table 22: Canada United State Car Insurance Market Volume (Billion) Forecast, by Application 2019 & 2032
- Table 23: Mexico United State Car Insurance Market Revenue (Million) Forecast, by Application 2019 & 2032
- Table 24: Mexico United State Car Insurance Market Volume (Billion) Forecast, by Application 2019 & 2032
- Table 25: Global United State Car Insurance Market Revenue Million Forecast, by Coverage 2019 & 2032
- Table 26: Global United State Car Insurance Market Volume Billion Forecast, by Coverage 2019 & 2032
- Table 27: Global United State Car Insurance Market Revenue Million Forecast, by Application 2019 & 2032
- Table 28: Global United State Car Insurance Market Volume Billion Forecast, by Application 2019 & 2032
- Table 29: Global United State Car Insurance Market Revenue Million Forecast, by Distribution Channel 2019 & 2032
- Table 30: Global United State Car Insurance Market Volume Billion Forecast, by Distribution Channel 2019 & 2032
- Table 31: Global United State Car Insurance Market Revenue Million Forecast, by Country 2019 & 2032
- Table 32: Global United State Car Insurance Market Volume Billion Forecast, by Country 2019 & 2032
- Table 33: Brazil United State Car Insurance Market Revenue (Million) Forecast, by Application 2019 & 2032
- Table 34: Brazil United State Car Insurance Market Volume (Billion) Forecast, by Application 2019 & 2032
- Table 35: Argentina United State Car Insurance Market Revenue (Million) Forecast, by Application 2019 & 2032
- Table 36: Argentina United State Car Insurance Market Volume (Billion) Forecast, by Application 2019 & 2032
- Table 37: Rest of South America United State Car Insurance Market Revenue (Million) Forecast, by Application 2019 & 2032
- Table 38: Rest of South America United State Car Insurance Market Volume (Billion) Forecast, by Application 2019 & 2032
- Table 39: Global United State Car Insurance Market Revenue Million Forecast, by Coverage 2019 & 2032
- Table 40: Global United State Car Insurance Market Volume Billion Forecast, by Coverage 2019 & 2032
- Table 41: Global United State Car Insurance Market Revenue Million Forecast, by Application 2019 & 2032
- Table 42: Global United State Car Insurance Market Volume Billion Forecast, by Application 2019 & 2032
- Table 43: Global United State Car Insurance Market Revenue Million Forecast, by Distribution Channel 2019 & 2032
- Table 44: Global United State Car Insurance Market Volume Billion Forecast, by Distribution Channel 2019 & 2032
- Table 45: Global United State Car Insurance Market Revenue Million Forecast, by Country 2019 & 2032
- Table 46: Global United State Car Insurance Market Volume Billion Forecast, by Country 2019 & 2032
- Table 47: United Kingdom United State Car Insurance Market Revenue (Million) Forecast, by Application 2019 & 2032
- Table 48: United Kingdom United State Car Insurance Market Volume (Billion) Forecast, by Application 2019 & 2032
- Table 49: Germany United State Car Insurance Market Revenue (Million) Forecast, by Application 2019 & 2032
- Table 50: Germany United State Car Insurance Market Volume (Billion) Forecast, by Application 2019 & 2032
- Table 51: France United State Car Insurance Market Revenue (Million) Forecast, by Application 2019 & 2032
- Table 52: France United State Car Insurance Market Volume (Billion) Forecast, by Application 2019 & 2032
- Table 53: Italy United State Car Insurance Market Revenue (Million) Forecast, by Application 2019 & 2032
- Table 54: Italy United State Car Insurance Market Volume (Billion) Forecast, by Application 2019 & 2032
- Table 55: Spain United State Car Insurance Market Revenue (Million) Forecast, by Application 2019 & 2032
- Table 56: Spain United State Car Insurance Market Volume (Billion) Forecast, by Application 2019 & 2032
- Table 57: Russia United State Car Insurance Market Revenue (Million) Forecast, by Application 2019 & 2032
- Table 58: Russia United State Car Insurance Market Volume (Billion) Forecast, by Application 2019 & 2032
- Table 59: Benelux United State Car Insurance Market Revenue (Million) Forecast, by Application 2019 & 2032
- Table 60: Benelux United State Car Insurance Market Volume (Billion) Forecast, by Application 2019 & 2032
- Table 61: Nordics United State Car Insurance Market Revenue (Million) Forecast, by Application 2019 & 2032
- Table 62: Nordics United State Car Insurance Market Volume (Billion) Forecast, by Application 2019 & 2032
- Table 63: Rest of Europe United State Car Insurance Market Revenue (Million) Forecast, by Application 2019 & 2032
- Table 64: Rest of Europe United State Car Insurance Market Volume (Billion) Forecast, by Application 2019 & 2032
- Table 65: Global United State Car Insurance Market Revenue Million Forecast, by Coverage 2019 & 2032
- Table 66: Global United State Car Insurance Market Volume Billion Forecast, by Coverage 2019 & 2032
- Table 67: Global United State Car Insurance Market Revenue Million Forecast, by Application 2019 & 2032
- Table 68: Global United State Car Insurance Market Volume Billion Forecast, by Application 2019 & 2032
- Table 69: Global United State Car Insurance Market Revenue Million Forecast, by Distribution Channel 2019 & 2032
- Table 70: Global United State Car Insurance Market Volume Billion Forecast, by Distribution Channel 2019 & 2032
- Table 71: Global United State Car Insurance Market Revenue Million Forecast, by Country 2019 & 2032
- Table 72: Global United State Car Insurance Market Volume Billion Forecast, by Country 2019 & 2032
- Table 73: Turkey United State Car Insurance Market Revenue (Million) Forecast, by Application 2019 & 2032
- Table 74: Turkey United State Car Insurance Market Volume (Billion) Forecast, by Application 2019 & 2032
- Table 75: Israel United State Car Insurance Market Revenue (Million) Forecast, by Application 2019 & 2032
- Table 76: Israel United State Car Insurance Market Volume (Billion) Forecast, by Application 2019 & 2032
- Table 77: GCC United State Car Insurance Market Revenue (Million) Forecast, by Application 2019 & 2032
- Table 78: GCC United State Car Insurance Market Volume (Billion) Forecast, by Application 2019 & 2032
- Table 79: North Africa United State Car Insurance Market Revenue (Million) Forecast, by Application 2019 & 2032
- Table 80: North Africa United State Car Insurance Market Volume (Billion) Forecast, by Application 2019 & 2032
- Table 81: South Africa United State Car Insurance Market Revenue (Million) Forecast, by Application 2019 & 2032
- Table 82: South Africa United State Car Insurance Market Volume (Billion) Forecast, by Application 2019 & 2032
- Table 83: Rest of Middle East & Africa United State Car Insurance Market Revenue (Million) Forecast, by Application 2019 & 2032
- Table 84: Rest of Middle East & Africa United State Car Insurance Market Volume (Billion) Forecast, by Application 2019 & 2032
- Table 85: Global United State Car Insurance Market Revenue Million Forecast, by Coverage 2019 & 2032
- Table 86: Global United State Car Insurance Market Volume Billion Forecast, by Coverage 2019 & 2032
- Table 87: Global United State Car Insurance Market Revenue Million Forecast, by Application 2019 & 2032
- Table 88: Global United State Car Insurance Market Volume Billion Forecast, by Application 2019 & 2032
- Table 89: Global United State Car Insurance Market Revenue Million Forecast, by Distribution Channel 2019 & 2032
- Table 90: Global United State Car Insurance Market Volume Billion Forecast, by Distribution Channel 2019 & 2032
- Table 91: Global United State Car Insurance Market Revenue Million Forecast, by Country 2019 & 2032
- Table 92: Global United State Car Insurance Market Volume Billion Forecast, by Country 2019 & 2032
- Table 93: China United State Car Insurance Market Revenue (Million) Forecast, by Application 2019 & 2032
- Table 94: China United State Car Insurance Market Volume (Billion) Forecast, by Application 2019 & 2032
- Table 95: India United State Car Insurance Market Revenue (Million) Forecast, by Application 2019 & 2032
- Table 96: India United State Car Insurance Market Volume (Billion) Forecast, by Application 2019 & 2032
- Table 97: Japan United State Car Insurance Market Revenue (Million) Forecast, by Application 2019 & 2032
- Table 98: Japan United State Car Insurance Market Volume (Billion) Forecast, by Application 2019 & 2032
- Table 99: South Korea United State Car Insurance Market Revenue (Million) Forecast, by Application 2019 & 2032
- Table 100: South Korea United State Car Insurance Market Volume (Billion) Forecast, by Application 2019 & 2032
- Table 101: ASEAN United State Car Insurance Market Revenue (Million) Forecast, by Application 2019 & 2032
- Table 102: ASEAN United State Car Insurance Market Volume (Billion) Forecast, by Application 2019 & 2032
- Table 103: Oceania United State Car Insurance Market Revenue (Million) Forecast, by Application 2019 & 2032
- Table 104: Oceania United State Car Insurance Market Volume (Billion) Forecast, by Application 2019 & 2032
- Table 105: Rest of Asia Pacific United State Car Insurance Market Revenue (Million) Forecast, by Application 2019 & 2032
- Table 106: Rest of Asia Pacific United State Car Insurance Market Volume (Billion) Forecast, by Application 2019 & 2032
Frequently Asked Questions
1. What is the projected Compound Annual Growth Rate (CAGR) of the United State Car Insurance Market?
The projected CAGR is approximately 4.21%.
2. Which companies are prominent players in the United State Car Insurance Market?
Key companies in the market include State Farm Mutual Automobile Insurance, Berkshire Hathaway Inc, Progressive Corp, Allstate Corp, USAA Insurance Group, Liberty Mutual, Farmers Insurance Group of Companies, Nationwide Mutual Group, American Family Insurance Group, Travelers Companies Inc **List Not Exhaustive.
3. What are the main segments of the United State Car Insurance Market?
The market segments include Coverage, Application, Distribution Channel.
4. Can you provide details about the market size?
The market size is estimated to be USD 194.15 Million as of 2022.
5. What are some drivers contributing to market growth?
Rising Number of Accidents Drives The Market; An increase in Road Traffic Accidents Drives The Market.
6. What are the notable trends driving market growth?
Rise In Number Of Traffic Accidents.
7. Are there any restraints impacting market growth?
Rising Number of Accidents Drives The Market; An increase in Road Traffic Accidents Drives The Market.
8. Can you provide examples of recent developments in the market?
August 2023: AXA S.A. introduced its latest digital claims solution, STeP, which simplifies the car insurance process.
9. What pricing options are available for accessing the report?
Pricing options include single-user, multi-user, and enterprise licenses priced at USD 3800, USD 4500, and USD 5800 respectively.
10. Is the market size provided in terms of value or volume?
The market size is provided in terms of value, measured in Million and volume, measured in Billion.
11. Are there any specific market keywords associated with the report?
Yes, the market keyword associated with the report is "United State Car Insurance Market," which aids in identifying and referencing the specific market segment covered.
12. How do I determine which pricing option suits my needs best?
The pricing options vary based on user requirements and access needs. Individual users may opt for single-user licenses, while businesses requiring broader access may choose multi-user or enterprise licenses for cost-effective access to the report.
13. Are there any additional resources or data provided in the United State Car Insurance Market report?
While the report offers comprehensive insights, it's advisable to review the specific contents or supplementary materials provided to ascertain if additional resources or data are available.
14. How can I stay updated on further developments or reports in the United State Car Insurance Market?
To stay informed about further developments, trends, and reports in the United State Car Insurance Market, consider subscribing to industry newsletters, following relevant companies and organizations, or regularly checking reputable industry news sources and publications.
Methodology
Step 1 - Identification of Relevant Samples Size from Population Database


Step 2 - Approaches for Defining Global Market Size (Value, Volume* & Price*)

Note*: In applicable scenarios
Step 3 - Data Sources
Primary Research
- Web Analytics
- Survey Reports
- Research Institute
- Latest Research Reports
- Opinion Leaders
Secondary Research
- Annual Reports
- White Paper
- Latest Press Release
- Industry Association
- Paid Database
- Investor Presentations

Step 4 - Data Triangulation
Involves using different sources of information in order to increase the validity of a study
These sources are likely to be stakeholders in a program - participants, other researchers, program staff, other community members, and so on.
Then we put all data in single framework & apply various statistical tools to find out the dynamic on the market.
During the analysis stage, feedback from the stakeholder groups would be compared to determine areas of agreement as well as areas of divergence


