
Key Insights
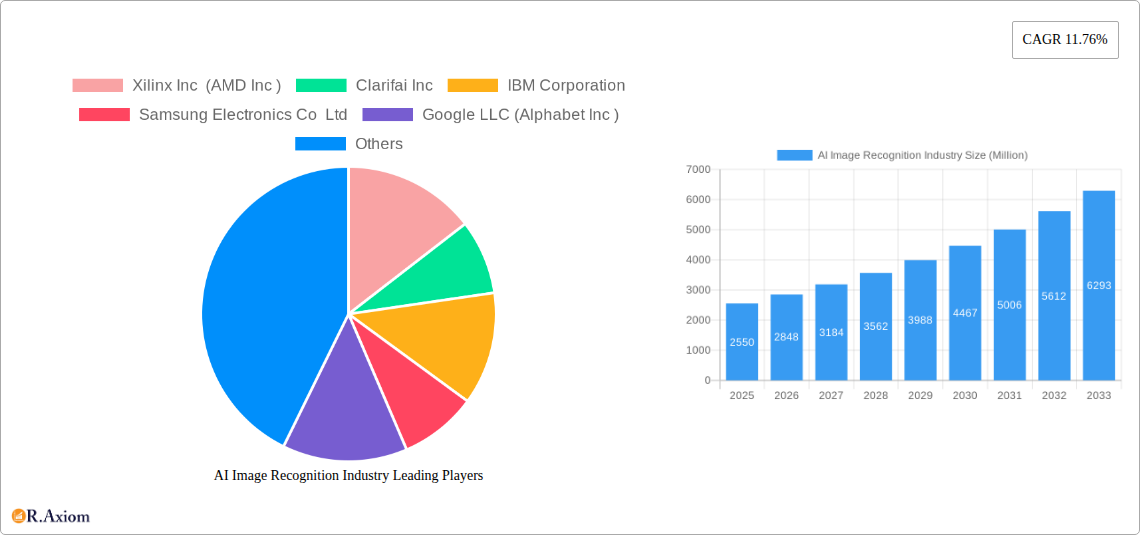
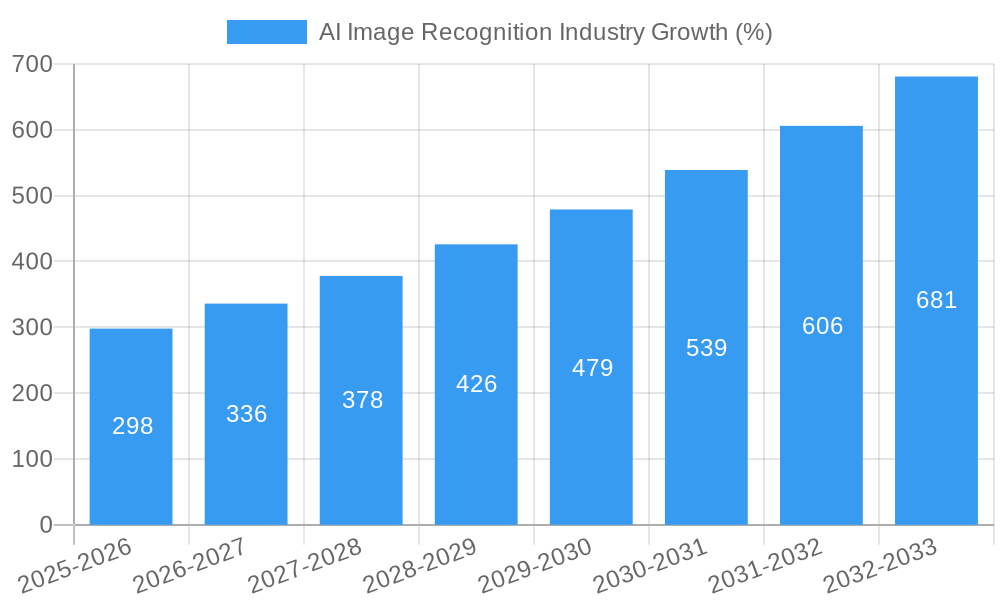
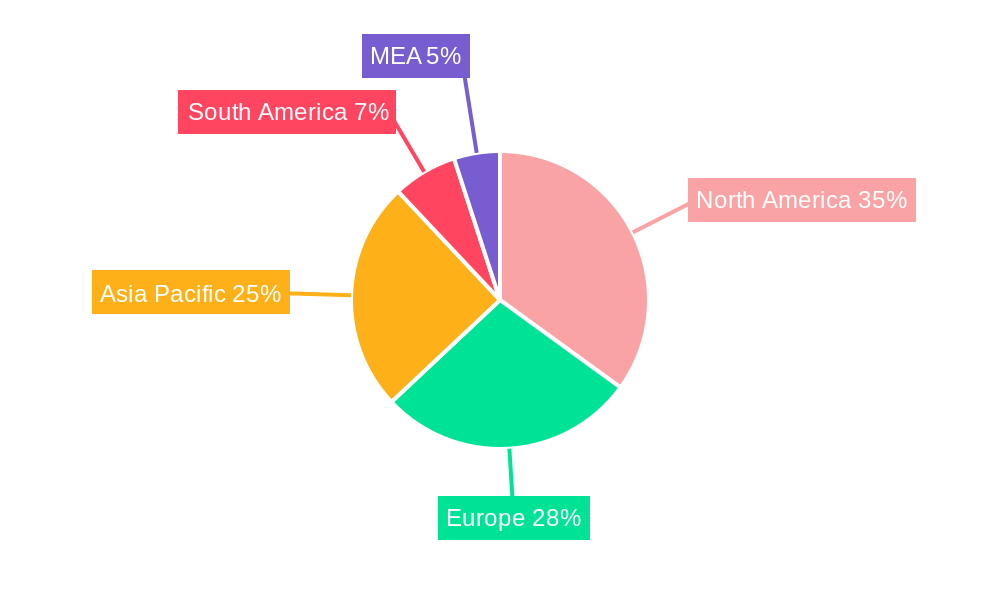
The AI image recognition market is experiencing robust growth, projected to reach \$2.55 billion in 2025 and expanding at a compound annual growth rate (CAGR) of 11.76% from 2025 to 2033. This expansion is fueled by several key drivers. The increasing adoption of AI across diverse sectors like automotive (autonomous driving), BFSI (fraud detection), healthcare (medical image analysis), and retail (visual search) is significantly boosting demand. Advancements in deep learning algorithms, coupled with readily available high-resolution image data and powerful computing capabilities, are enhancing the accuracy and efficiency of image recognition systems. Furthermore, the rising need for enhanced security solutions, encompassing facial recognition and object detection, further contributes to market growth. However, challenges remain, including concerns about data privacy and bias in algorithms, requiring robust regulatory frameworks and ethical considerations to ensure responsible AI development and deployment. The market is segmented by type (hardware, software, services) and end-user vertical, with North America and Asia Pacific anticipated as leading regions due to their advanced technological infrastructure and significant investments in AI research and development.
The competitive landscape is characterized by a mix of established technology giants and emerging innovative companies. Key players like Google, Microsoft, Amazon, and Intel are leveraging their existing strengths in cloud computing, data processing, and chip manufacturing to expand their market share. Specialized AI companies like Clarifai and Xilinx are focusing on providing niche solutions and advanced hardware for high-performance image recognition tasks. The forecast period (2025-2033) suggests continued market expansion, driven by technological innovations and increasing adoption across various industry verticals. Strategic partnerships and mergers & acquisitions are expected to reshape the competitive landscape, further accelerating market growth. The market’s future success hinges on addressing ethical concerns and ensuring responsible development of AI-powered image recognition solutions.
AI Image Recognition Industry Market Report: 2019-2033
This comprehensive report provides an in-depth analysis of the AI Image Recognition industry, projecting a market value of xx Million by 2033. The study period covers 2019-2033, with 2025 as the base and estimated year. The forecast period spans 2025-2033, and the historical period encompasses 2019-2024. Key players analyzed include Xilinx Inc (AMD Inc), Clarifai Inc, IBM Corporation, Samsung Electronics Co Ltd, Google LLC (Alphabet Inc), Microsoft Corporation, Qualcomm Incorporated, Amazon Web Services Inc (Amazon Com Inc), Micron Technologies Inc, Nvidia Corporation, and Intel Corporation. The report segments the market by type (Hardware, Software, Services) and end-user verticals (Automotive, BFSI, Healthcare, Retail, Security, Other End-user Verticals).
AI Image Recognition Industry Market Concentration & Innovation
The AI image recognition market exhibits a moderately concentrated landscape, with a few dominant players holding significant market share. Google, Microsoft, and Amazon AWS collectively control a substantial portion (xx%) of the market, primarily driven by their cloud-based AI services and extensive research capabilities. However, smaller specialized players like Clarifai excel in niche applications. The industry's innovation is fueled by advancements in deep learning, computer vision algorithms, and specialized hardware like GPUs and FPGAs. Regulatory frameworks, particularly concerning data privacy (e.g., GDPR) and algorithmic bias, significantly influence market development. Product substitutes, such as traditional image analysis techniques, are gradually being replaced due to AI's superior accuracy and efficiency. Mergers and acquisitions (M&A) activities have been significant, with deal values exceeding xx Million in recent years, indicating consolidation and strategic expansion within the sector. End-user trends indicate a growing preference for AI-powered solutions across diverse sectors, driving market growth.
- Market Share: Google & Microsoft combined hold xx% market share.
- M&A Activity: Over xx Million in M&A deals completed since 2019.
- Key Innovation Drivers: Deep Learning, Computer Vision, Specialized Hardware.
AI Image Recognition Industry Industry Trends & Insights
The AI image recognition market is experiencing robust growth, projected to achieve a CAGR of xx% during the forecast period. This growth is fueled by several factors: increasing adoption of AI across industries, the availability of large datasets for training AI models, and continuous advancements in AI algorithms. Technological disruptions, such as the emergence of edge AI and advancements in quantum computing, are reshaping the competitive landscape. Consumer preferences are shifting towards personalized and intuitive AI-powered solutions. Competitive dynamics are intense, with both large technology companies and specialized startups vying for market share. Market penetration is rapidly increasing, particularly in sectors like healthcare and security. Specific metrics such as the CAGR (xx%) and market penetration rates in key verticals (e.g., xx% in healthcare by 2033) showcase the industry's rapid expansion and potential.
Dominant Markets & Segments in AI Image Recognition Industry
The North American region currently holds the largest market share, driven by strong technological advancements, substantial investments in AI research, and a high concentration of key players. However, the Asia-Pacific region is expected to witness the fastest growth, fueled by rapid economic development and increasing adoption of AI across various sectors.
By Type:
- Software: Holds the largest market share due to its flexibility and scalability.
- Hardware: Shows significant growth driven by specialized hardware advancements (GPUs, FPGAs).
- Services: Cloud-based AI services are experiencing rapid adoption due to their accessibility and cost-effectiveness.
By End-user Vertical:
- Healthcare: AI-powered diagnostic tools and image analysis are driving strong growth. Key drivers include increasing demand for improved healthcare efficiency and accuracy in diagnosis.
- Automotive: Autonomous driving systems and advanced driver-assistance systems (ADAS) are major applications. Economic policies supporting autonomous vehicle development further accelerate growth.
- Security: Facial recognition and surveillance systems are contributing to market growth. Increased security concerns and government investments in security infrastructure are key drivers.
AI Image Recognition Industry Product Developments
Recent innovations include advancements in object detection, image segmentation, and real-time processing capabilities. The integration of AI with edge devices is enabling faster and more efficient image recognition in resource-constrained environments. New applications are emerging in areas such as medical diagnostics, industrial automation, and smart city development. The competitive advantage lies in offering high accuracy, low latency, and robust solutions tailored to specific industry needs.
Report Scope & Segmentation Analysis
This report comprehensively segments the AI Image Recognition market by type (Hardware, Software, Services) and end-user verticals (Automotive, BFSI, Healthcare, Retail, Security, Other). Each segment’s growth projection, market size, and competitive dynamics are analyzed in detail. For example, the healthcare segment is projected to witness significant growth due to increased adoption of AI-powered diagnostic tools, while the automotive segment is experiencing rapid expansion due to the rising demand for autonomous driving technologies.
Key Drivers of AI Image Recognition Industry Growth
Several key factors are driving the growth of the AI image recognition market: the increasing availability of large, high-quality datasets for training AI models, advancements in deep learning algorithms and hardware, and rising demand for automation and efficiency across various industries. Government initiatives promoting AI development and supportive economic policies in key regions are also fueling market expansion.
Challenges in the AI Image Recognition Industry Sector
Key challenges include the high cost of developing and deploying AI systems, concerns regarding data privacy and security, and the potential for algorithmic bias. Supply chain disruptions related to specialized hardware components can also impact market growth. Intense competition from established technology giants and emerging startups presents a constant challenge to smaller players.
Emerging Opportunities in AI Image Recognition Industry
Emerging opportunities include the integration of AI image recognition with other technologies such as IoT and blockchain, the development of more robust and explainable AI models, and the expansion into new and emerging markets. The increasing use of AI in edge devices and applications in areas like augmented reality and virtual reality offer significant growth potential.
Leading Players in the AI Image Recognition Industry Market
- Xilinx Inc (AMD Inc)
- Clarifai Inc
- IBM Corporation
- Samsung Electronics Co Ltd
- Google LLC (Alphabet Inc)
- Microsoft Corporation
- Qualcomm Incorporated
- Amazon Web Services Inc (Amazon Com Inc)
- Micron Technologies Inc
- Nvidia Corporation
- Intel Corporation
Key Developments in AI Image Recognition Industry Industry
- September 2022: Samsung Medison showcased its HERA W10 ultrasound system with AI diagnostic solutions at the ISUOG World Congress, highlighting the growing application of AI in medical imaging.
- September 2022: Alcatraz AI secured USD 25 Million in Series A funding, demonstrating investor confidence in AI-powered security solutions.
Strategic Outlook for AI Image Recognition Industry Market
The AI image recognition market is poised for continued strong growth, driven by technological advancements, increasing adoption across diverse industries, and supportive regulatory environments. The convergence of AI with other emerging technologies will unlock new opportunities and further expand the market's potential in the coming years. Companies that can effectively leverage these trends and address the challenges associated with data privacy and algorithmic bias will be best positioned for success.
AI Image Recognition Industry Segmentation
-
1. Type
- 1.1. Hardware
- 1.2. Software
- 1.3. Services
-
2. End-user Verticals
- 2.1. Automotive
- 2.2. BFSI
- 2.3. Healthcare
- 2.4. Retail
- 2.5. Security
- 2.6. Other End-user Verticals
AI Image Recognition Industry Segmentation By Geography
- 1. North America
- 2. Europe
- 3. Asia
- 4. Australia and New Zealand
- 5. Latin America
- 6. Middle East and Africa
AI Image Recognition Industry REPORT HIGHLIGHTS
| Aspects | Details |
|---|---|
| Study Period | 2019-2033 |
| Base Year | 2024 |
| Estimated Year | 2025 |
| Forecast Period | 2025-2033 |
| Historical Period | 2019-2024 |
| Growth Rate | CAGR of 11.76% from 2019-2033 |
| Segmentation |
|
Table of Contents
- 1. Introduction
- 1.1. Research Scope
- 1.2. Market Segmentation
- 1.3. Research Methodology
- 1.4. Definitions and Assumptions
- 2. Executive Summary
- 2.1. Introduction
- 3. Market Dynamics
- 3.1. Introduction
- 3.2. Market Drivers
- 3.2.1. Growing AI Adoption; Increasing Use of Big Data Analytics; Declining Costs of Hardware
- 3.3. Market Restrains
- 3.3.1. Lack of Technical Expertise
- 3.4. Market Trends
- 3.4.1. Healthcare Sector is Expected to Witness Significant Growth
- 4. Market Factor Analysis
- 4.1. Porters Five Forces
- 4.2. Supply/Value Chain
- 4.3. PESTEL analysis
- 4.4. Market Entropy
- 4.5. Patent/Trademark Analysis
- 5. Global AI Image Recognition Industry Analysis, Insights and Forecast, 2019-2031
- 5.1. Market Analysis, Insights and Forecast - by Type
- 5.1.1. Hardware
- 5.1.2. Software
- 5.1.3. Services
- 5.2. Market Analysis, Insights and Forecast - by End-user Verticals
- 5.2.1. Automotive
- 5.2.2. BFSI
- 5.2.3. Healthcare
- 5.2.4. Retail
- 5.2.5. Security
- 5.2.6. Other End-user Verticals
- 5.3. Market Analysis, Insights and Forecast - by Region
- 5.3.1. North America
- 5.3.2. Europe
- 5.3.3. Asia
- 5.3.4. Australia and New Zealand
- 5.3.5. Latin America
- 5.3.6. Middle East and Africa
- 5.1. Market Analysis, Insights and Forecast - by Type
- 6. North America AI Image Recognition Industry Analysis, Insights and Forecast, 2019-2031
- 6.1. Market Analysis, Insights and Forecast - by Type
- 6.1.1. Hardware
- 6.1.2. Software
- 6.1.3. Services
- 6.2. Market Analysis, Insights and Forecast - by End-user Verticals
- 6.2.1. Automotive
- 6.2.2. BFSI
- 6.2.3. Healthcare
- 6.2.4. Retail
- 6.2.5. Security
- 6.2.6. Other End-user Verticals
- 6.1. Market Analysis, Insights and Forecast - by Type
- 7. Europe AI Image Recognition Industry Analysis, Insights and Forecast, 2019-2031
- 7.1. Market Analysis, Insights and Forecast - by Type
- 7.1.1. Hardware
- 7.1.2. Software
- 7.1.3. Services
- 7.2. Market Analysis, Insights and Forecast - by End-user Verticals
- 7.2.1. Automotive
- 7.2.2. BFSI
- 7.2.3. Healthcare
- 7.2.4. Retail
- 7.2.5. Security
- 7.2.6. Other End-user Verticals
- 7.1. Market Analysis, Insights and Forecast - by Type
- 8. Asia AI Image Recognition Industry Analysis, Insights and Forecast, 2019-2031
- 8.1. Market Analysis, Insights and Forecast - by Type
- 8.1.1. Hardware
- 8.1.2. Software
- 8.1.3. Services
- 8.2. Market Analysis, Insights and Forecast - by End-user Verticals
- 8.2.1. Automotive
- 8.2.2. BFSI
- 8.2.3. Healthcare
- 8.2.4. Retail
- 8.2.5. Security
- 8.2.6. Other End-user Verticals
- 8.1. Market Analysis, Insights and Forecast - by Type
- 9. Australia and New Zealand AI Image Recognition Industry Analysis, Insights and Forecast, 2019-2031
- 9.1. Market Analysis, Insights and Forecast - by Type
- 9.1.1. Hardware
- 9.1.2. Software
- 9.1.3. Services
- 9.2. Market Analysis, Insights and Forecast - by End-user Verticals
- 9.2.1. Automotive
- 9.2.2. BFSI
- 9.2.3. Healthcare
- 9.2.4. Retail
- 9.2.5. Security
- 9.2.6. Other End-user Verticals
- 9.1. Market Analysis, Insights and Forecast - by Type
- 10. Latin America AI Image Recognition Industry Analysis, Insights and Forecast, 2019-2031
- 10.1. Market Analysis, Insights and Forecast - by Type
- 10.1.1. Hardware
- 10.1.2. Software
- 10.1.3. Services
- 10.2. Market Analysis, Insights and Forecast - by End-user Verticals
- 10.2.1. Automotive
- 10.2.2. BFSI
- 10.2.3. Healthcare
- 10.2.4. Retail
- 10.2.5. Security
- 10.2.6. Other End-user Verticals
- 10.1. Market Analysis, Insights and Forecast - by Type
- 11. Middle East and Africa AI Image Recognition Industry Analysis, Insights and Forecast, 2019-2031
- 11.1. Market Analysis, Insights and Forecast - by Type
- 11.1.1. Hardware
- 11.1.2. Software
- 11.1.3. Services
- 11.2. Market Analysis, Insights and Forecast - by End-user Verticals
- 11.2.1. Automotive
- 11.2.2. BFSI
- 11.2.3. Healthcare
- 11.2.4. Retail
- 11.2.5. Security
- 11.2.6. Other End-user Verticals
- 11.1. Market Analysis, Insights and Forecast - by Type
- 12. North America AI Image Recognition Industry Analysis, Insights and Forecast, 2019-2031
- 12.1. Market Analysis, Insights and Forecast - By Country/Sub-region
- 12.1.1 United States
- 12.1.2 Canada
- 12.1.3 Mexico
- 13. Europe AI Image Recognition Industry Analysis, Insights and Forecast, 2019-2031
- 13.1. Market Analysis, Insights and Forecast - By Country/Sub-region
- 13.1.1 Germany
- 13.1.2 United Kingdom
- 13.1.3 France
- 13.1.4 Spain
- 13.1.5 Italy
- 13.1.6 Spain
- 13.1.7 Belgium
- 13.1.8 Netherland
- 13.1.9 Nordics
- 13.1.10 Rest of Europe
- 14. Asia Pacific AI Image Recognition Industry Analysis, Insights and Forecast, 2019-2031
- 14.1. Market Analysis, Insights and Forecast - By Country/Sub-region
- 14.1.1 China
- 14.1.2 Japan
- 14.1.3 India
- 14.1.4 South Korea
- 14.1.5 Southeast Asia
- 14.1.6 Australia
- 14.1.7 Indonesia
- 14.1.8 Phillipes
- 14.1.9 Singapore
- 14.1.10 Thailandc
- 14.1.11 Rest of Asia Pacific
- 15. South America AI Image Recognition Industry Analysis, Insights and Forecast, 2019-2031
- 15.1. Market Analysis, Insights and Forecast - By Country/Sub-region
- 15.1.1 Brazil
- 15.1.2 Argentina
- 15.1.3 Peru
- 15.1.4 Chile
- 15.1.5 Colombia
- 15.1.6 Ecuador
- 15.1.7 Venezuela
- 15.1.8 Rest of South America
- 16. North America AI Image Recognition Industry Analysis, Insights and Forecast, 2019-2031
- 16.1. Market Analysis, Insights and Forecast - By Country/Sub-region
- 16.1.1 United States
- 16.1.2 Canada
- 16.1.3 Mexico
- 17. MEA AI Image Recognition Industry Analysis, Insights and Forecast, 2019-2031
- 17.1. Market Analysis, Insights and Forecast - By Country/Sub-region
- 17.1.1 United Arab Emirates
- 17.1.2 Saudi Arabia
- 17.1.3 South Africa
- 17.1.4 Rest of Middle East and Africa
- 18. Competitive Analysis
- 18.1. Global Market Share Analysis 2024
- 18.2. Company Profiles
- 18.2.1 Xilinx Inc (AMD Inc )
- 18.2.1.1. Overview
- 18.2.1.2. Products
- 18.2.1.3. SWOT Analysis
- 18.2.1.4. Recent Developments
- 18.2.1.5. Financials (Based on Availability)
- 18.2.2 Clarifai Inc
- 18.2.2.1. Overview
- 18.2.2.2. Products
- 18.2.2.3. SWOT Analysis
- 18.2.2.4. Recent Developments
- 18.2.2.5. Financials (Based on Availability)
- 18.2.3 IBM Corporation
- 18.2.3.1. Overview
- 18.2.3.2. Products
- 18.2.3.3. SWOT Analysis
- 18.2.3.4. Recent Developments
- 18.2.3.5. Financials (Based on Availability)
- 18.2.4 Samsung Electronics Co Ltd
- 18.2.4.1. Overview
- 18.2.4.2. Products
- 18.2.4.3. SWOT Analysis
- 18.2.4.4. Recent Developments
- 18.2.4.5. Financials (Based on Availability)
- 18.2.5 Google LLC (Alphabet Inc )
- 18.2.5.1. Overview
- 18.2.5.2. Products
- 18.2.5.3. SWOT Analysis
- 18.2.5.4. Recent Developments
- 18.2.5.5. Financials (Based on Availability)
- 18.2.6 Microsoft Corporation
- 18.2.6.1. Overview
- 18.2.6.2. Products
- 18.2.6.3. SWOT Analysis
- 18.2.6.4. Recent Developments
- 18.2.6.5. Financials (Based on Availability)
- 18.2.7 Qualcomm Incorporated
- 18.2.7.1. Overview
- 18.2.7.2. Products
- 18.2.7.3. SWOT Analysis
- 18.2.7.4. Recent Developments
- 18.2.7.5. Financials (Based on Availability)
- 18.2.8 Amazon Web Services Inc (Amazon Com Inc )
- 18.2.8.1. Overview
- 18.2.8.2. Products
- 18.2.8.3. SWOT Analysis
- 18.2.8.4. Recent Developments
- 18.2.8.5. Financials (Based on Availability)
- 18.2.9 Micron Technologies Inc
- 18.2.9.1. Overview
- 18.2.9.2. Products
- 18.2.9.3. SWOT Analysis
- 18.2.9.4. Recent Developments
- 18.2.9.5. Financials (Based on Availability)
- 18.2.10 Nvidia Corporation
- 18.2.10.1. Overview
- 18.2.10.2. Products
- 18.2.10.3. SWOT Analysis
- 18.2.10.4. Recent Developments
- 18.2.10.5. Financials (Based on Availability)
- 18.2.11 Intel Corporation
- 18.2.11.1. Overview
- 18.2.11.2. Products
- 18.2.11.3. SWOT Analysis
- 18.2.11.4. Recent Developments
- 18.2.11.5. Financials (Based on Availability)
- 18.2.1 Xilinx Inc (AMD Inc )
List of Figures
- Figure 1: Global AI Image Recognition Industry Revenue Breakdown (Million, %) by Region 2024 & 2032
- Figure 2: Global AI Image Recognition Industry Volume Breakdown (K Unit, %) by Region 2024 & 2032
- Figure 3: North America AI Image Recognition Industry Revenue (Million), by Country 2024 & 2032
- Figure 4: North America AI Image Recognition Industry Volume (K Unit), by Country 2024 & 2032
- Figure 5: North America AI Image Recognition Industry Revenue Share (%), by Country 2024 & 2032
- Figure 6: North America AI Image Recognition Industry Volume Share (%), by Country 2024 & 2032
- Figure 7: Europe AI Image Recognition Industry Revenue (Million), by Country 2024 & 2032
- Figure 8: Europe AI Image Recognition Industry Volume (K Unit), by Country 2024 & 2032
- Figure 9: Europe AI Image Recognition Industry Revenue Share (%), by Country 2024 & 2032
- Figure 10: Europe AI Image Recognition Industry Volume Share (%), by Country 2024 & 2032
- Figure 11: Asia Pacific AI Image Recognition Industry Revenue (Million), by Country 2024 & 2032
- Figure 12: Asia Pacific AI Image Recognition Industry Volume (K Unit), by Country 2024 & 2032
- Figure 13: Asia Pacific AI Image Recognition Industry Revenue Share (%), by Country 2024 & 2032
- Figure 14: Asia Pacific AI Image Recognition Industry Volume Share (%), by Country 2024 & 2032
- Figure 15: South America AI Image Recognition Industry Revenue (Million), by Country 2024 & 2032
- Figure 16: South America AI Image Recognition Industry Volume (K Unit), by Country 2024 & 2032
- Figure 17: South America AI Image Recognition Industry Revenue Share (%), by Country 2024 & 2032
- Figure 18: South America AI Image Recognition Industry Volume Share (%), by Country 2024 & 2032
- Figure 19: North America AI Image Recognition Industry Revenue (Million), by Country 2024 & 2032
- Figure 20: North America AI Image Recognition Industry Volume (K Unit), by Country 2024 & 2032
- Figure 21: North America AI Image Recognition Industry Revenue Share (%), by Country 2024 & 2032
- Figure 22: North America AI Image Recognition Industry Volume Share (%), by Country 2024 & 2032
- Figure 23: MEA AI Image Recognition Industry Revenue (Million), by Country 2024 & 2032
- Figure 24: MEA AI Image Recognition Industry Volume (K Unit), by Country 2024 & 2032
- Figure 25: MEA AI Image Recognition Industry Revenue Share (%), by Country 2024 & 2032
- Figure 26: MEA AI Image Recognition Industry Volume Share (%), by Country 2024 & 2032
- Figure 27: North America AI Image Recognition Industry Revenue (Million), by Type 2024 & 2032
- Figure 28: North America AI Image Recognition Industry Volume (K Unit), by Type 2024 & 2032
- Figure 29: North America AI Image Recognition Industry Revenue Share (%), by Type 2024 & 2032
- Figure 30: North America AI Image Recognition Industry Volume Share (%), by Type 2024 & 2032
- Figure 31: North America AI Image Recognition Industry Revenue (Million), by End-user Verticals 2024 & 2032
- Figure 32: North America AI Image Recognition Industry Volume (K Unit), by End-user Verticals 2024 & 2032
- Figure 33: North America AI Image Recognition Industry Revenue Share (%), by End-user Verticals 2024 & 2032
- Figure 34: North America AI Image Recognition Industry Volume Share (%), by End-user Verticals 2024 & 2032
- Figure 35: North America AI Image Recognition Industry Revenue (Million), by Country 2024 & 2032
- Figure 36: North America AI Image Recognition Industry Volume (K Unit), by Country 2024 & 2032
- Figure 37: North America AI Image Recognition Industry Revenue Share (%), by Country 2024 & 2032
- Figure 38: North America AI Image Recognition Industry Volume Share (%), by Country 2024 & 2032
- Figure 39: Europe AI Image Recognition Industry Revenue (Million), by Type 2024 & 2032
- Figure 40: Europe AI Image Recognition Industry Volume (K Unit), by Type 2024 & 2032
- Figure 41: Europe AI Image Recognition Industry Revenue Share (%), by Type 2024 & 2032
- Figure 42: Europe AI Image Recognition Industry Volume Share (%), by Type 2024 & 2032
- Figure 43: Europe AI Image Recognition Industry Revenue (Million), by End-user Verticals 2024 & 2032
- Figure 44: Europe AI Image Recognition Industry Volume (K Unit), by End-user Verticals 2024 & 2032
- Figure 45: Europe AI Image Recognition Industry Revenue Share (%), by End-user Verticals 2024 & 2032
- Figure 46: Europe AI Image Recognition Industry Volume Share (%), by End-user Verticals 2024 & 2032
- Figure 47: Europe AI Image Recognition Industry Revenue (Million), by Country 2024 & 2032
- Figure 48: Europe AI Image Recognition Industry Volume (K Unit), by Country 2024 & 2032
- Figure 49: Europe AI Image Recognition Industry Revenue Share (%), by Country 2024 & 2032
- Figure 50: Europe AI Image Recognition Industry Volume Share (%), by Country 2024 & 2032
- Figure 51: Asia AI Image Recognition Industry Revenue (Million), by Type 2024 & 2032
- Figure 52: Asia AI Image Recognition Industry Volume (K Unit), by Type 2024 & 2032
- Figure 53: Asia AI Image Recognition Industry Revenue Share (%), by Type 2024 & 2032
- Figure 54: Asia AI Image Recognition Industry Volume Share (%), by Type 2024 & 2032
- Figure 55: Asia AI Image Recognition Industry Revenue (Million), by End-user Verticals 2024 & 2032
- Figure 56: Asia AI Image Recognition Industry Volume (K Unit), by End-user Verticals 2024 & 2032
- Figure 57: Asia AI Image Recognition Industry Revenue Share (%), by End-user Verticals 2024 & 2032
- Figure 58: Asia AI Image Recognition Industry Volume Share (%), by End-user Verticals 2024 & 2032
- Figure 59: Asia AI Image Recognition Industry Revenue (Million), by Country 2024 & 2032
- Figure 60: Asia AI Image Recognition Industry Volume (K Unit), by Country 2024 & 2032
- Figure 61: Asia AI Image Recognition Industry Revenue Share (%), by Country 2024 & 2032
- Figure 62: Asia AI Image Recognition Industry Volume Share (%), by Country 2024 & 2032
- Figure 63: Australia and New Zealand AI Image Recognition Industry Revenue (Million), by Type 2024 & 2032
- Figure 64: Australia and New Zealand AI Image Recognition Industry Volume (K Unit), by Type 2024 & 2032
- Figure 65: Australia and New Zealand AI Image Recognition Industry Revenue Share (%), by Type 2024 & 2032
- Figure 66: Australia and New Zealand AI Image Recognition Industry Volume Share (%), by Type 2024 & 2032
- Figure 67: Australia and New Zealand AI Image Recognition Industry Revenue (Million), by End-user Verticals 2024 & 2032
- Figure 68: Australia and New Zealand AI Image Recognition Industry Volume (K Unit), by End-user Verticals 2024 & 2032
- Figure 69: Australia and New Zealand AI Image Recognition Industry Revenue Share (%), by End-user Verticals 2024 & 2032
- Figure 70: Australia and New Zealand AI Image Recognition Industry Volume Share (%), by End-user Verticals 2024 & 2032
- Figure 71: Australia and New Zealand AI Image Recognition Industry Revenue (Million), by Country 2024 & 2032
- Figure 72: Australia and New Zealand AI Image Recognition Industry Volume (K Unit), by Country 2024 & 2032
- Figure 73: Australia and New Zealand AI Image Recognition Industry Revenue Share (%), by Country 2024 & 2032
- Figure 74: Australia and New Zealand AI Image Recognition Industry Volume Share (%), by Country 2024 & 2032
- Figure 75: Latin America AI Image Recognition Industry Revenue (Million), by Type 2024 & 2032
- Figure 76: Latin America AI Image Recognition Industry Volume (K Unit), by Type 2024 & 2032
- Figure 77: Latin America AI Image Recognition Industry Revenue Share (%), by Type 2024 & 2032
- Figure 78: Latin America AI Image Recognition Industry Volume Share (%), by Type 2024 & 2032
- Figure 79: Latin America AI Image Recognition Industry Revenue (Million), by End-user Verticals 2024 & 2032
- Figure 80: Latin America AI Image Recognition Industry Volume (K Unit), by End-user Verticals 2024 & 2032
- Figure 81: Latin America AI Image Recognition Industry Revenue Share (%), by End-user Verticals 2024 & 2032
- Figure 82: Latin America AI Image Recognition Industry Volume Share (%), by End-user Verticals 2024 & 2032
- Figure 83: Latin America AI Image Recognition Industry Revenue (Million), by Country 2024 & 2032
- Figure 84: Latin America AI Image Recognition Industry Volume (K Unit), by Country 2024 & 2032
- Figure 85: Latin America AI Image Recognition Industry Revenue Share (%), by Country 2024 & 2032
- Figure 86: Latin America AI Image Recognition Industry Volume Share (%), by Country 2024 & 2032
- Figure 87: Middle East and Africa AI Image Recognition Industry Revenue (Million), by Type 2024 & 2032
- Figure 88: Middle East and Africa AI Image Recognition Industry Volume (K Unit), by Type 2024 & 2032
- Figure 89: Middle East and Africa AI Image Recognition Industry Revenue Share (%), by Type 2024 & 2032
- Figure 90: Middle East and Africa AI Image Recognition Industry Volume Share (%), by Type 2024 & 2032
- Figure 91: Middle East and Africa AI Image Recognition Industry Revenue (Million), by End-user Verticals 2024 & 2032
- Figure 92: Middle East and Africa AI Image Recognition Industry Volume (K Unit), by End-user Verticals 2024 & 2032
- Figure 93: Middle East and Africa AI Image Recognition Industry Revenue Share (%), by End-user Verticals 2024 & 2032
- Figure 94: Middle East and Africa AI Image Recognition Industry Volume Share (%), by End-user Verticals 2024 & 2032
- Figure 95: Middle East and Africa AI Image Recognition Industry Revenue (Million), by Country 2024 & 2032
- Figure 96: Middle East and Africa AI Image Recognition Industry Volume (K Unit), by Country 2024 & 2032
- Figure 97: Middle East and Africa AI Image Recognition Industry Revenue Share (%), by Country 2024 & 2032
- Figure 98: Middle East and Africa AI Image Recognition Industry Volume Share (%), by Country 2024 & 2032
List of Tables
- Table 1: Global AI Image Recognition Industry Revenue Million Forecast, by Region 2019 & 2032
- Table 2: Global AI Image Recognition Industry Volume K Unit Forecast, by Region 2019 & 2032
- Table 3: Global AI Image Recognition Industry Revenue Million Forecast, by Type 2019 & 2032
- Table 4: Global AI Image Recognition Industry Volume K Unit Forecast, by Type 2019 & 2032
- Table 5: Global AI Image Recognition Industry Revenue Million Forecast, by End-user Verticals 2019 & 2032
- Table 6: Global AI Image Recognition Industry Volume K Unit Forecast, by End-user Verticals 2019 & 2032
- Table 7: Global AI Image Recognition Industry Revenue Million Forecast, by Region 2019 & 2032
- Table 8: Global AI Image Recognition Industry Volume K Unit Forecast, by Region 2019 & 2032
- Table 9: Global AI Image Recognition Industry Revenue Million Forecast, by Country 2019 & 2032
- Table 10: Global AI Image Recognition Industry Volume K Unit Forecast, by Country 2019 & 2032
- Table 11: United States AI Image Recognition Industry Revenue (Million) Forecast, by Application 2019 & 2032
- Table 12: United States AI Image Recognition Industry Volume (K Unit) Forecast, by Application 2019 & 2032
- Table 13: Canada AI Image Recognition Industry Revenue (Million) Forecast, by Application 2019 & 2032
- Table 14: Canada AI Image Recognition Industry Volume (K Unit) Forecast, by Application 2019 & 2032
- Table 15: Mexico AI Image Recognition Industry Revenue (Million) Forecast, by Application 2019 & 2032
- Table 16: Mexico AI Image Recognition Industry Volume (K Unit) Forecast, by Application 2019 & 2032
- Table 17: Global AI Image Recognition Industry Revenue Million Forecast, by Country 2019 & 2032
- Table 18: Global AI Image Recognition Industry Volume K Unit Forecast, by Country 2019 & 2032
- Table 19: Germany AI Image Recognition Industry Revenue (Million) Forecast, by Application 2019 & 2032
- Table 20: Germany AI Image Recognition Industry Volume (K Unit) Forecast, by Application 2019 & 2032
- Table 21: United Kingdom AI Image Recognition Industry Revenue (Million) Forecast, by Application 2019 & 2032
- Table 22: United Kingdom AI Image Recognition Industry Volume (K Unit) Forecast, by Application 2019 & 2032
- Table 23: France AI Image Recognition Industry Revenue (Million) Forecast, by Application 2019 & 2032
- Table 24: France AI Image Recognition Industry Volume (K Unit) Forecast, by Application 2019 & 2032
- Table 25: Spain AI Image Recognition Industry Revenue (Million) Forecast, by Application 2019 & 2032
- Table 26: Spain AI Image Recognition Industry Volume (K Unit) Forecast, by Application 2019 & 2032
- Table 27: Italy AI Image Recognition Industry Revenue (Million) Forecast, by Application 2019 & 2032
- Table 28: Italy AI Image Recognition Industry Volume (K Unit) Forecast, by Application 2019 & 2032
- Table 29: Spain AI Image Recognition Industry Revenue (Million) Forecast, by Application 2019 & 2032
- Table 30: Spain AI Image Recognition Industry Volume (K Unit) Forecast, by Application 2019 & 2032
- Table 31: Belgium AI Image Recognition Industry Revenue (Million) Forecast, by Application 2019 & 2032
- Table 32: Belgium AI Image Recognition Industry Volume (K Unit) Forecast, by Application 2019 & 2032
- Table 33: Netherland AI Image Recognition Industry Revenue (Million) Forecast, by Application 2019 & 2032
- Table 34: Netherland AI Image Recognition Industry Volume (K Unit) Forecast, by Application 2019 & 2032
- Table 35: Nordics AI Image Recognition Industry Revenue (Million) Forecast, by Application 2019 & 2032
- Table 36: Nordics AI Image Recognition Industry Volume (K Unit) Forecast, by Application 2019 & 2032
- Table 37: Rest of Europe AI Image Recognition Industry Revenue (Million) Forecast, by Application 2019 & 2032
- Table 38: Rest of Europe AI Image Recognition Industry Volume (K Unit) Forecast, by Application 2019 & 2032
- Table 39: Global AI Image Recognition Industry Revenue Million Forecast, by Country 2019 & 2032
- Table 40: Global AI Image Recognition Industry Volume K Unit Forecast, by Country 2019 & 2032
- Table 41: China AI Image Recognition Industry Revenue (Million) Forecast, by Application 2019 & 2032
- Table 42: China AI Image Recognition Industry Volume (K Unit) Forecast, by Application 2019 & 2032
- Table 43: Japan AI Image Recognition Industry Revenue (Million) Forecast, by Application 2019 & 2032
- Table 44: Japan AI Image Recognition Industry Volume (K Unit) Forecast, by Application 2019 & 2032
- Table 45: India AI Image Recognition Industry Revenue (Million) Forecast, by Application 2019 & 2032
- Table 46: India AI Image Recognition Industry Volume (K Unit) Forecast, by Application 2019 & 2032
- Table 47: South Korea AI Image Recognition Industry Revenue (Million) Forecast, by Application 2019 & 2032
- Table 48: South Korea AI Image Recognition Industry Volume (K Unit) Forecast, by Application 2019 & 2032
- Table 49: Southeast Asia AI Image Recognition Industry Revenue (Million) Forecast, by Application 2019 & 2032
- Table 50: Southeast Asia AI Image Recognition Industry Volume (K Unit) Forecast, by Application 2019 & 2032
- Table 51: Australia AI Image Recognition Industry Revenue (Million) Forecast, by Application 2019 & 2032
- Table 52: Australia AI Image Recognition Industry Volume (K Unit) Forecast, by Application 2019 & 2032
- Table 53: Indonesia AI Image Recognition Industry Revenue (Million) Forecast, by Application 2019 & 2032
- Table 54: Indonesia AI Image Recognition Industry Volume (K Unit) Forecast, by Application 2019 & 2032
- Table 55: Phillipes AI Image Recognition Industry Revenue (Million) Forecast, by Application 2019 & 2032
- Table 56: Phillipes AI Image Recognition Industry Volume (K Unit) Forecast, by Application 2019 & 2032
- Table 57: Singapore AI Image Recognition Industry Revenue (Million) Forecast, by Application 2019 & 2032
- Table 58: Singapore AI Image Recognition Industry Volume (K Unit) Forecast, by Application 2019 & 2032
- Table 59: Thailandc AI Image Recognition Industry Revenue (Million) Forecast, by Application 2019 & 2032
- Table 60: Thailandc AI Image Recognition Industry Volume (K Unit) Forecast, by Application 2019 & 2032
- Table 61: Rest of Asia Pacific AI Image Recognition Industry Revenue (Million) Forecast, by Application 2019 & 2032
- Table 62: Rest of Asia Pacific AI Image Recognition Industry Volume (K Unit) Forecast, by Application 2019 & 2032
- Table 63: Global AI Image Recognition Industry Revenue Million Forecast, by Country 2019 & 2032
- Table 64: Global AI Image Recognition Industry Volume K Unit Forecast, by Country 2019 & 2032
- Table 65: Brazil AI Image Recognition Industry Revenue (Million) Forecast, by Application 2019 & 2032
- Table 66: Brazil AI Image Recognition Industry Volume (K Unit) Forecast, by Application 2019 & 2032
- Table 67: Argentina AI Image Recognition Industry Revenue (Million) Forecast, by Application 2019 & 2032
- Table 68: Argentina AI Image Recognition Industry Volume (K Unit) Forecast, by Application 2019 & 2032
- Table 69: Peru AI Image Recognition Industry Revenue (Million) Forecast, by Application 2019 & 2032
- Table 70: Peru AI Image Recognition Industry Volume (K Unit) Forecast, by Application 2019 & 2032
- Table 71: Chile AI Image Recognition Industry Revenue (Million) Forecast, by Application 2019 & 2032
- Table 72: Chile AI Image Recognition Industry Volume (K Unit) Forecast, by Application 2019 & 2032
- Table 73: Colombia AI Image Recognition Industry Revenue (Million) Forecast, by Application 2019 & 2032
- Table 74: Colombia AI Image Recognition Industry Volume (K Unit) Forecast, by Application 2019 & 2032
- Table 75: Ecuador AI Image Recognition Industry Revenue (Million) Forecast, by Application 2019 & 2032
- Table 76: Ecuador AI Image Recognition Industry Volume (K Unit) Forecast, by Application 2019 & 2032
- Table 77: Venezuela AI Image Recognition Industry Revenue (Million) Forecast, by Application 2019 & 2032
- Table 78: Venezuela AI Image Recognition Industry Volume (K Unit) Forecast, by Application 2019 & 2032
- Table 79: Rest of South America AI Image Recognition Industry Revenue (Million) Forecast, by Application 2019 & 2032
- Table 80: Rest of South America AI Image Recognition Industry Volume (K Unit) Forecast, by Application 2019 & 2032
- Table 81: Global AI Image Recognition Industry Revenue Million Forecast, by Country 2019 & 2032
- Table 82: Global AI Image Recognition Industry Volume K Unit Forecast, by Country 2019 & 2032
- Table 83: United States AI Image Recognition Industry Revenue (Million) Forecast, by Application 2019 & 2032
- Table 84: United States AI Image Recognition Industry Volume (K Unit) Forecast, by Application 2019 & 2032
- Table 85: Canada AI Image Recognition Industry Revenue (Million) Forecast, by Application 2019 & 2032
- Table 86: Canada AI Image Recognition Industry Volume (K Unit) Forecast, by Application 2019 & 2032
- Table 87: Mexico AI Image Recognition Industry Revenue (Million) Forecast, by Application 2019 & 2032
- Table 88: Mexico AI Image Recognition Industry Volume (K Unit) Forecast, by Application 2019 & 2032
- Table 89: Global AI Image Recognition Industry Revenue Million Forecast, by Country 2019 & 2032
- Table 90: Global AI Image Recognition Industry Volume K Unit Forecast, by Country 2019 & 2032
- Table 91: United Arab Emirates AI Image Recognition Industry Revenue (Million) Forecast, by Application 2019 & 2032
- Table 92: United Arab Emirates AI Image Recognition Industry Volume (K Unit) Forecast, by Application 2019 & 2032
- Table 93: Saudi Arabia AI Image Recognition Industry Revenue (Million) Forecast, by Application 2019 & 2032
- Table 94: Saudi Arabia AI Image Recognition Industry Volume (K Unit) Forecast, by Application 2019 & 2032
- Table 95: South Africa AI Image Recognition Industry Revenue (Million) Forecast, by Application 2019 & 2032
- Table 96: South Africa AI Image Recognition Industry Volume (K Unit) Forecast, by Application 2019 & 2032
- Table 97: Rest of Middle East and Africa AI Image Recognition Industry Revenue (Million) Forecast, by Application 2019 & 2032
- Table 98: Rest of Middle East and Africa AI Image Recognition Industry Volume (K Unit) Forecast, by Application 2019 & 2032
- Table 99: Global AI Image Recognition Industry Revenue Million Forecast, by Type 2019 & 2032
- Table 100: Global AI Image Recognition Industry Volume K Unit Forecast, by Type 2019 & 2032
- Table 101: Global AI Image Recognition Industry Revenue Million Forecast, by End-user Verticals 2019 & 2032
- Table 102: Global AI Image Recognition Industry Volume K Unit Forecast, by End-user Verticals 2019 & 2032
- Table 103: Global AI Image Recognition Industry Revenue Million Forecast, by Country 2019 & 2032
- Table 104: Global AI Image Recognition Industry Volume K Unit Forecast, by Country 2019 & 2032
- Table 105: Global AI Image Recognition Industry Revenue Million Forecast, by Type 2019 & 2032
- Table 106: Global AI Image Recognition Industry Volume K Unit Forecast, by Type 2019 & 2032
- Table 107: Global AI Image Recognition Industry Revenue Million Forecast, by End-user Verticals 2019 & 2032
- Table 108: Global AI Image Recognition Industry Volume K Unit Forecast, by End-user Verticals 2019 & 2032
- Table 109: Global AI Image Recognition Industry Revenue Million Forecast, by Country 2019 & 2032
- Table 110: Global AI Image Recognition Industry Volume K Unit Forecast, by Country 2019 & 2032
- Table 111: Global AI Image Recognition Industry Revenue Million Forecast, by Type 2019 & 2032
- Table 112: Global AI Image Recognition Industry Volume K Unit Forecast, by Type 2019 & 2032
- Table 113: Global AI Image Recognition Industry Revenue Million Forecast, by End-user Verticals 2019 & 2032
- Table 114: Global AI Image Recognition Industry Volume K Unit Forecast, by End-user Verticals 2019 & 2032
- Table 115: Global AI Image Recognition Industry Revenue Million Forecast, by Country 2019 & 2032
- Table 116: Global AI Image Recognition Industry Volume K Unit Forecast, by Country 2019 & 2032
- Table 117: Global AI Image Recognition Industry Revenue Million Forecast, by Type 2019 & 2032
- Table 118: Global AI Image Recognition Industry Volume K Unit Forecast, by Type 2019 & 2032
- Table 119: Global AI Image Recognition Industry Revenue Million Forecast, by End-user Verticals 2019 & 2032
- Table 120: Global AI Image Recognition Industry Volume K Unit Forecast, by End-user Verticals 2019 & 2032
- Table 121: Global AI Image Recognition Industry Revenue Million Forecast, by Country 2019 & 2032
- Table 122: Global AI Image Recognition Industry Volume K Unit Forecast, by Country 2019 & 2032
- Table 123: Global AI Image Recognition Industry Revenue Million Forecast, by Type 2019 & 2032
- Table 124: Global AI Image Recognition Industry Volume K Unit Forecast, by Type 2019 & 2032
- Table 125: Global AI Image Recognition Industry Revenue Million Forecast, by End-user Verticals 2019 & 2032
- Table 126: Global AI Image Recognition Industry Volume K Unit Forecast, by End-user Verticals 2019 & 2032
- Table 127: Global AI Image Recognition Industry Revenue Million Forecast, by Country 2019 & 2032
- Table 128: Global AI Image Recognition Industry Volume K Unit Forecast, by Country 2019 & 2032
- Table 129: Global AI Image Recognition Industry Revenue Million Forecast, by Type 2019 & 2032
- Table 130: Global AI Image Recognition Industry Volume K Unit Forecast, by Type 2019 & 2032
- Table 131: Global AI Image Recognition Industry Revenue Million Forecast, by End-user Verticals 2019 & 2032
- Table 132: Global AI Image Recognition Industry Volume K Unit Forecast, by End-user Verticals 2019 & 2032
- Table 133: Global AI Image Recognition Industry Revenue Million Forecast, by Country 2019 & 2032
- Table 134: Global AI Image Recognition Industry Volume K Unit Forecast, by Country 2019 & 2032
Frequently Asked Questions
1. What is the projected Compound Annual Growth Rate (CAGR) of the AI Image Recognition Industry?
The projected CAGR is approximately 11.76%.
2. Which companies are prominent players in the AI Image Recognition Industry?
Key companies in the market include Xilinx Inc (AMD Inc ), Clarifai Inc, IBM Corporation, Samsung Electronics Co Ltd, Google LLC (Alphabet Inc ), Microsoft Corporation, Qualcomm Incorporated, Amazon Web Services Inc (Amazon Com Inc ), Micron Technologies Inc, Nvidia Corporation, Intel Corporation.
3. What are the main segments of the AI Image Recognition Industry?
The market segments include Type, End-user Verticals.
4. Can you provide details about the market size?
The market size is estimated to be USD 2.55 Million as of 2022.
5. What are some drivers contributing to market growth?
Growing AI Adoption; Increasing Use of Big Data Analytics; Declining Costs of Hardware.
6. What are the notable trends driving market growth?
Healthcare Sector is Expected to Witness Significant Growth.
7. Are there any restraints impacting market growth?
Lack of Technical Expertise.
8. Can you provide examples of recent developments in the market?
September 2022: The International Society of Ultrasound in Obstetrics and Gynecology (ISUOG) World Congress 2022 was to take place in London, United Kingdom, from September 16 to September 18, and Samsung Medison, a leading manufacturer of medical equipment and a subsidiary of Samsung Electronics, was to attend the function to demonstrate its high-end HERA W10 obstetric and gynecological ultrasound equipment. The HERA W10 system has Intelligent Assist (AI diagnostic solutions), V8, and V7. These two top-of-the-line ultrasound systems can be employed with premium AI diagnostic solutions in various medical specialties.
9. What pricing options are available for accessing the report?
Pricing options include single-user, multi-user, and enterprise licenses priced at USD 4750, USD 5250, and USD 8750 respectively.
10. Is the market size provided in terms of value or volume?
The market size is provided in terms of value, measured in Million and volume, measured in K Unit.
11. Are there any specific market keywords associated with the report?
Yes, the market keyword associated with the report is "AI Image Recognition Industry," which aids in identifying and referencing the specific market segment covered.
12. How do I determine which pricing option suits my needs best?
The pricing options vary based on user requirements and access needs. Individual users may opt for single-user licenses, while businesses requiring broader access may choose multi-user or enterprise licenses for cost-effective access to the report.
13. Are there any additional resources or data provided in the AI Image Recognition Industry report?
While the report offers comprehensive insights, it's advisable to review the specific contents or supplementary materials provided to ascertain if additional resources or data are available.
14. How can I stay updated on further developments or reports in the AI Image Recognition Industry?
To stay informed about further developments, trends, and reports in the AI Image Recognition Industry, consider subscribing to industry newsletters, following relevant companies and organizations, or regularly checking reputable industry news sources and publications.
Methodology
Step 1 - Identification of Relevant Samples Size from Population Database


Step 2 - Approaches for Defining Global Market Size (Value, Volume* & Price*)

Note*: In applicable scenarios
Step 3 - Data Sources
Primary Research
- Web Analytics
- Survey Reports
- Research Institute
- Latest Research Reports
- Opinion Leaders
Secondary Research
- Annual Reports
- White Paper
- Latest Press Release
- Industry Association
- Paid Database
- Investor Presentations

Step 4 - Data Triangulation
Involves using different sources of information in order to increase the validity of a study
These sources are likely to be stakeholders in a program - participants, other researchers, program staff, other community members, and so on.
Then we put all data in single framework & apply various statistical tools to find out the dynamic on the market.
During the analysis stage, feedback from the stakeholder groups would be compared to determine areas of agreement as well as areas of divergence


