
Key Insights
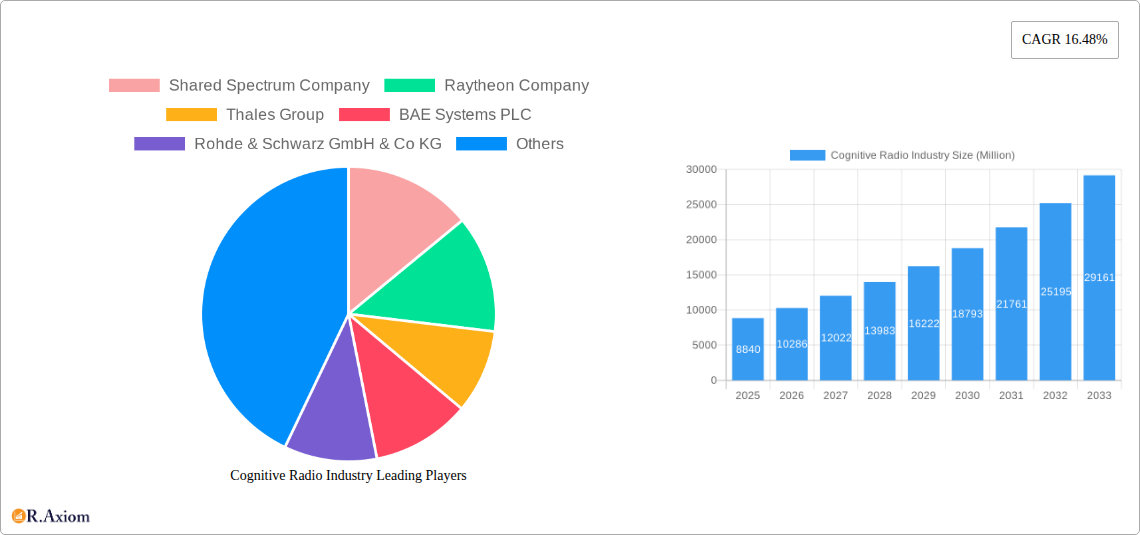
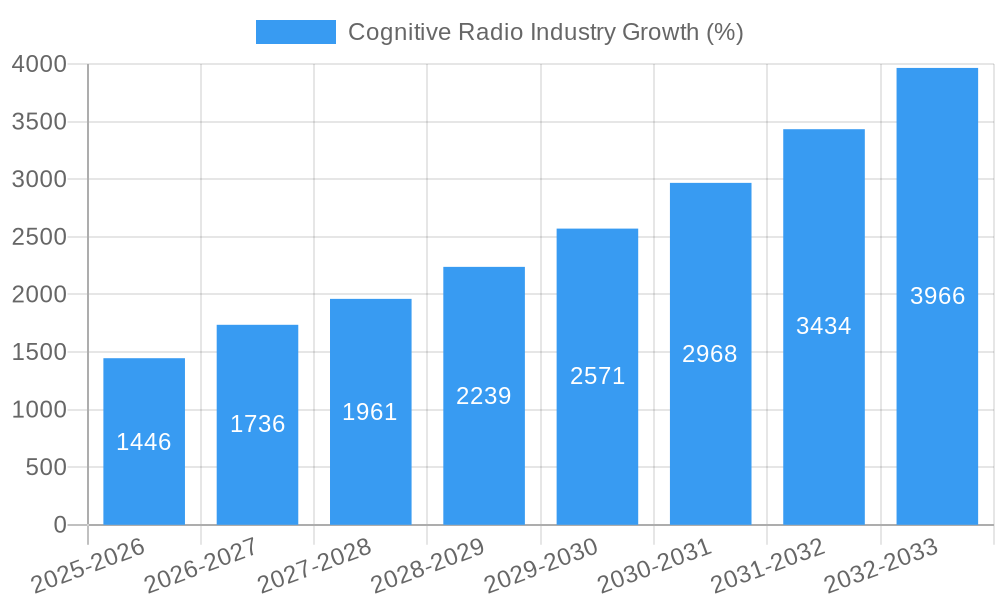
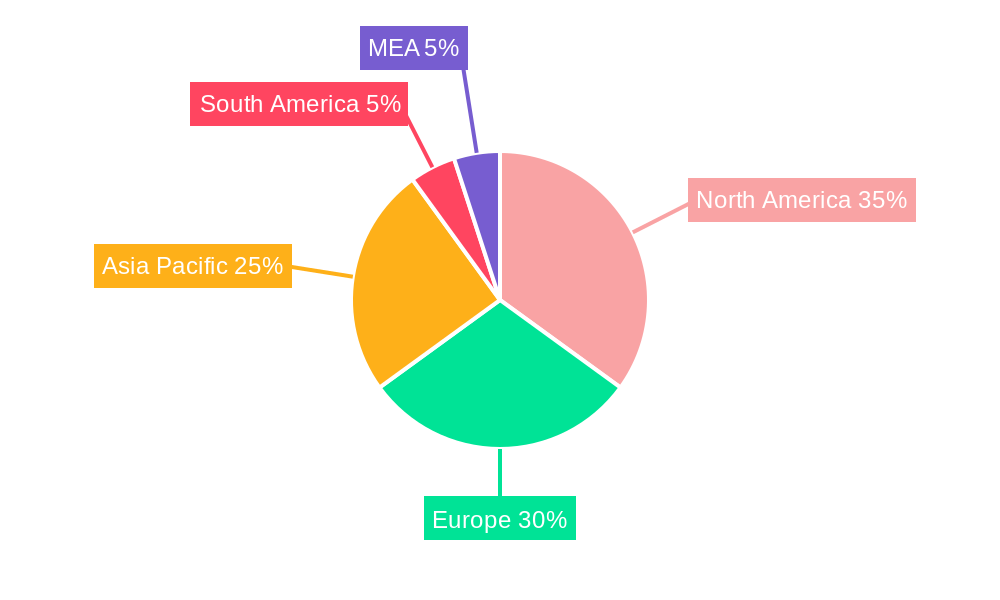
The Cognitive Radio (CR) market is experiencing robust growth, projected to reach \$8.84 billion in 2025 and maintain a Compound Annual Growth Rate (CAGR) of 16.48% from 2025 to 2033. This expansion is driven by the increasing demand for efficient spectrum utilization in a crowded wireless environment. The proliferation of Internet of Things (IoT) devices, the rise of 5G and beyond 5G networks, and the need for improved network performance in sectors like telecommunications, IT, and government & defense are key catalysts. Furthermore, advancements in spectrum sensing technologies and the development of sophisticated cognitive radio algorithms are fueling market growth. The segment breakdown reveals a strong contribution from the telecommunications sector, followed by IT and ITeS. Within applications, spectrum sensing and allocation, and location detection are leading segments. Professional services currently dominate the service landscape, highlighting the initial emphasis on technology implementation and consultation. Growth is expected to be geographically diverse, with North America and Europe holding significant market share initially, followed by rapid expansion in the Asia-Pacific region driven by increasing digitalization and infrastructure development.
The competitive landscape is characterized by a mix of established players like Raytheon, Thales, and BAE Systems, alongside specialized companies focusing on cognitive radio technologies. Future growth will likely see increased partnerships and mergers and acquisitions as companies seek to expand their capabilities and market reach. Potential restraints include the complexity of CR technology implementation, regulatory hurdles in spectrum allocation, and interoperability challenges across different systems. However, ongoing technological advancements and increased industry collaboration are expected to mitigate these challenges. The continued focus on innovation in areas like artificial intelligence (AI) and machine learning (ML) will further enhance the capabilities of cognitive radios, driving market expansion. The long-term outlook for the Cognitive Radio market is positive, with substantial growth potential across various sectors and geographic regions.
Cognitive Radio Industry Market Report: 2019-2033
This comprehensive report provides a detailed analysis of the Cognitive Radio industry, offering actionable insights for stakeholders across the value chain. The study period covers 2019-2033, with 2025 as the base and estimated year. The report forecasts market trends from 2025-2033, building upon historical data from 2019-2024. The report values are in Millions.
Cognitive Radio Industry Market Concentration & Innovation
The Cognitive Radio market exhibits a moderately concentrated landscape, with a few key players holding significant market share. The exact market share distribution for 2025 is estimated at xx%, with the top five companies accounting for approximately xx% of the total revenue. Innovation is driven by the need for improved spectrum efficiency, enhanced security, and the integration of AI and machine learning. Regulatory frameworks, such as those governing spectrum allocation and usage, significantly influence market growth. Product substitutes, primarily traditional radio technologies, face increasing pressure from the cost-effectiveness and efficiency gains of Cognitive Radio. End-user trends, including the rising demand for reliable and high-speed wireless communication across various sectors, are major catalysts. M&A activity has been moderate, with deal values averaging approximately xx Million USD per transaction in recent years. Examples include:
- Strategic Acquisitions: Several key players have engaged in strategic acquisitions to expand their product portfolios and market reach. Deal sizes in the recent past have ranged from xx Million USD to xx Million USD.
- Joint Ventures: Collaborative partnerships have emerged to accelerate innovation and enhance market penetration, particularly in niche applications like government and defense.
Cognitive Radio Industry Industry Trends & Insights
The Cognitive Radio market is experiencing robust growth, driven by several key factors. The Compound Annual Growth Rate (CAGR) from 2025 to 2033 is projected to be xx%, fueled by the increasing demand for efficient spectrum utilization in the face of ever-growing wireless data traffic. Technological disruptions, including the advent of 5G and the exploration of 6G technologies, are further propelling market expansion. Consumer preferences towards seamless connectivity and enhanced data speeds are critical drivers. Competitive dynamics are shaped by innovation, cost efficiency, and strategic partnerships. Market penetration is rapidly expanding, especially in the telecommunication and government & defense sectors, with an estimated penetration rate of xx% in 2025, projected to increase to xx% by 2033. This growth is further influenced by factors like the growing adoption of IoT devices and the increasing need for efficient spectrum management in densely populated areas.
Dominant Markets & Segments in Cognitive Radio Industry
Dominant Regions/Countries: The North American and European markets currently dominate the Cognitive Radio landscape, fueled by robust technological advancements and supportive regulatory frameworks. However, the Asia-Pacific region is experiencing rapid growth, driven by increasing digitalization and infrastructural development.
Dominant Segments:
- By End-user Industry: The Telecommunication sector holds the largest market share due to the high demand for spectrum-efficient solutions, followed by the Government & Defense sector, driven by applications in military communication and surveillance.
- By Application: Spectrum Sensing & Allocation is the leading application segment due to its critical role in dynamic spectrum access. Cognitive routing and QoS Optimization are also exhibiting significant growth.
- By Service: Managed Services are gaining prominence owing to their cost-effectiveness and reduced operational burden for end-users.
Key Drivers:
- Economic Policies: Government initiatives promoting digitalization and technological advancements are fostering industry growth.
- Infrastructure Development: Investments in 5G and beyond infrastructure are paving the way for widespread Cognitive Radio adoption.
- Technological Advancements: The integration of AI and Machine Learning capabilities is improving the efficiency and intelligence of Cognitive Radio systems.
Cognitive Radio Industry Product Developments
Recent years have witnessed significant product innovations in Cognitive Radio technology, focusing on enhanced spectrum sensing algorithms, improved cognitive routing protocols, and the integration of AI-powered decision-making capabilities. These advancements have led to more efficient spectrum utilization, improved network performance, and enhanced security. The market is witnessing a shift towards software-defined radios and cloud-based platforms, enabling greater flexibility and scalability. These innovations are well-aligned with evolving market needs for dynamic spectrum access and seamless connectivity across diverse applications.
Report Scope & Segmentation Analysis
This report segments the Cognitive Radio market by:
By End-user Industry: Telecommunication, IT & ITes, Government & Defense, Transportation, Other End-user Industries. Each segment exhibits unique growth trajectories based on the specific needs and priorities of each sector.
By Application: Spectrum Sensing & Allocation, Location Detection, Cognitive Routing, QoS (Quality of Service) Optimisation, Other Applications. This segmentation highlights the diverse applications of Cognitive Radio technology and their respective market sizes.
By Service: Professional Services, Managed Services. This reflects the varying service models available to end-users, each with its own market characteristics.
Growth projections for each segment are provided based on anticipated technological advancements, market adoption rates, and regulatory developments. Market size estimations are provided for each segment and are broken down by region, country, and application. The competitive landscape for each segment is also analyzed, considering the presence of major players and emerging competitors.
Key Drivers of Cognitive Radio Industry Growth
The growth of the Cognitive Radio industry is driven by several key factors:
- Increasing Demand for Spectrum Efficiency: The growing demand for wireless connectivity necessitates more efficient use of the available spectrum.
- Technological Advancements: Innovations in AI, machine learning, and software-defined radio are enhancing the capabilities of Cognitive Radio systems.
- Regulatory Support: Government initiatives aimed at promoting dynamic spectrum access are creating a favorable regulatory environment. For instance, the allocation of unlicensed spectrum bands for Cognitive Radio technologies is boosting growth.
Challenges in the Cognitive Radio Industry Sector
The Cognitive Radio industry faces several challenges:
- Regulatory Hurdles: The complexity of spectrum regulations and licensing procedures can hinder market growth in some regions.
- Interoperability Issues: Ensuring seamless interoperability between different Cognitive Radio systems remains a challenge.
- High Initial Investment Costs: The implementation of Cognitive Radio technologies can require significant upfront investment, potentially limiting adoption in certain sectors. This can reduce market penetration by xx% compared to projections without this cost barrier.
Emerging Opportunities in Cognitive Radio Industry
The Cognitive Radio market presents several exciting opportunities:
- 5G and Beyond Deployment: Cognitive Radio technologies play a crucial role in optimizing spectrum utilization in 5G and future wireless networks.
- IoT Applications: Cognitive Radio is well-suited to support the growing number of connected devices in the Internet of Things.
- Private LTE/5G Networks: This is a rapidly growing sector with substantial potential for Cognitive Radio adoption.
Leading Players in the Cognitive Radio Industry Market
- Shared Spectrum Company
- Raytheon Company
- Thales Group
- BAE Systems PLC
- Rohde & Schwarz GmbH & Co KG
- Spectrum Signal Processing (Vecima)
- Rockwell Collins Inc (United Technologies Company)
- Innovation Nutaq Inc (NuRAN Wireless Inc)
Key Developments in Cognitive Radio Industry Industry
- March 2023: Intellisense Systems Inc. leveraged BrainChip's Akida neuromorphic technology to enhance cognitive communication capabilities on SWaP-constrained platforms for commercial and government markets, notably benefiting NASA's space communication and networking.
- February 2023: Neva SGR's investment in CoreTigo signifies a push towards more connected and efficient industrial automation, reducing the complexity of wired systems.
- November 2022: Ericsson's planned 11.9 Million USD investment in UK wireless connectivity highlights a focus on cognitive networks, AI, and 6G research, potentially shaping future market trends.
Strategic Outlook for Cognitive Radio Industry Market
The Cognitive Radio industry is poised for significant growth in the coming years. The convergence of increasing demand for wireless connectivity, technological advancements in AI and machine learning, and supportive regulatory frameworks will fuel market expansion. The integration of Cognitive Radio technologies into 5G and future networks, along with their application in the rapidly growing IoT and private network sectors, presents substantial opportunities for market players. The industry is expected to witness continuous innovation, resulting in more efficient, secure, and intelligent wireless communication systems, further enhancing market potential.
Cognitive Radio Industry Segmentation
-
1. Application
- 1.1. Spectrum Sensing & Allocation
- 1.2. Location Detection
- 1.3. Cognitive Routing
- 1.4. QoS (Quality of Service) Optimisation
- 1.5. Other Applications
-
2. Service
- 2.1. Professional Services
- 2.2. Managed Services
-
3. End-user Industry
- 3.1. Telecommunication
- 3.2. IT & ITes
- 3.3. Government & Defense
- 3.4. Transportation
- 3.5. Other End-user Industries
Cognitive Radio Industry Segmentation By Geography
-
1. North America
- 1.1. United States
- 1.2. Canada
-
2. Europe
- 2.1. United Kingdom
- 2.2. Germany
- 2.3. France
- 2.4. Rest of Europe
-
3. Asia Pacific
- 3.1. China
- 3.2. Japan
- 3.3. South Korea
- 3.4. Rest of Asia Pacific
-
4. Latin America
- 4.1. Brazil
- 4.2. Argentina
- 4.3. Rest of South America
-
5. MEA
- 5.1. UAE
- 5.2. South Africa
- 5.3. Saudi Arabia
- 5.4. Rest Of MEA
Cognitive Radio Industry REPORT HIGHLIGHTS
| Aspects | Details |
|---|---|
| Study Period | 2019-2033 |
| Base Year | 2024 |
| Estimated Year | 2025 |
| Forecast Period | 2025-2033 |
| Historical Period | 2019-2024 |
| Growth Rate | CAGR of 16.48% from 2019-2033 |
| Segmentation |
|
Table of Contents
- 1. Introduction
- 1.1. Research Scope
- 1.2. Market Segmentation
- 1.3. Research Methodology
- 1.4. Definitions and Assumptions
- 2. Executive Summary
- 2.1. Introduction
- 3. Market Dynamics
- 3.1. Introduction
- 3.2. Market Drivers
- 3.2.1. Growing Need to Optimise the Spectrum Utilisation; Rising Development of 5G Service Applications Among End-user Industries
- 3.3. Market Restrains
- 3.3.1. Lack of Proper Computational Security Infrastructure
- 3.4. Market Trends
- 3.4.1. Telecommunication Sector is Gaining Traction Due to Emergence of 5G Applications
- 4. Market Factor Analysis
- 4.1. Porters Five Forces
- 4.2. Supply/Value Chain
- 4.3. PESTEL analysis
- 4.4. Market Entropy
- 4.5. Patent/Trademark Analysis
- 5. Global Cognitive Radio Industry Analysis, Insights and Forecast, 2019-2031
- 5.1. Market Analysis, Insights and Forecast - by Application
- 5.1.1. Spectrum Sensing & Allocation
- 5.1.2. Location Detection
- 5.1.3. Cognitive Routing
- 5.1.4. QoS (Quality of Service) Optimisation
- 5.1.5. Other Applications
- 5.2. Market Analysis, Insights and Forecast - by Service
- 5.2.1. Professional Services
- 5.2.2. Managed Services
- 5.3. Market Analysis, Insights and Forecast - by End-user Industry
- 5.3.1. Telecommunication
- 5.3.2. IT & ITes
- 5.3.3. Government & Defense
- 5.3.4. Transportation
- 5.3.5. Other End-user Industries
- 5.4. Market Analysis, Insights and Forecast - by Region
- 5.4.1. North America
- 5.4.2. Europe
- 5.4.3. Asia Pacific
- 5.4.4. Latin America
- 5.4.5. MEA
- 5.1. Market Analysis, Insights and Forecast - by Application
- 6. North America Cognitive Radio Industry Analysis, Insights and Forecast, 2019-2031
- 6.1. Market Analysis, Insights and Forecast - by Application
- 6.1.1. Spectrum Sensing & Allocation
- 6.1.2. Location Detection
- 6.1.3. Cognitive Routing
- 6.1.4. QoS (Quality of Service) Optimisation
- 6.1.5. Other Applications
- 6.2. Market Analysis, Insights and Forecast - by Service
- 6.2.1. Professional Services
- 6.2.2. Managed Services
- 6.3. Market Analysis, Insights and Forecast - by End-user Industry
- 6.3.1. Telecommunication
- 6.3.2. IT & ITes
- 6.3.3. Government & Defense
- 6.3.4. Transportation
- 6.3.5. Other End-user Industries
- 6.1. Market Analysis, Insights and Forecast - by Application
- 7. Europe Cognitive Radio Industry Analysis, Insights and Forecast, 2019-2031
- 7.1. Market Analysis, Insights and Forecast - by Application
- 7.1.1. Spectrum Sensing & Allocation
- 7.1.2. Location Detection
- 7.1.3. Cognitive Routing
- 7.1.4. QoS (Quality of Service) Optimisation
- 7.1.5. Other Applications
- 7.2. Market Analysis, Insights and Forecast - by Service
- 7.2.1. Professional Services
- 7.2.2. Managed Services
- 7.3. Market Analysis, Insights and Forecast - by End-user Industry
- 7.3.1. Telecommunication
- 7.3.2. IT & ITes
- 7.3.3. Government & Defense
- 7.3.4. Transportation
- 7.3.5. Other End-user Industries
- 7.1. Market Analysis, Insights and Forecast - by Application
- 8. Asia Pacific Cognitive Radio Industry Analysis, Insights and Forecast, 2019-2031
- 8.1. Market Analysis, Insights and Forecast - by Application
- 8.1.1. Spectrum Sensing & Allocation
- 8.1.2. Location Detection
- 8.1.3. Cognitive Routing
- 8.1.4. QoS (Quality of Service) Optimisation
- 8.1.5. Other Applications
- 8.2. Market Analysis, Insights and Forecast - by Service
- 8.2.1. Professional Services
- 8.2.2. Managed Services
- 8.3. Market Analysis, Insights and Forecast - by End-user Industry
- 8.3.1. Telecommunication
- 8.3.2. IT & ITes
- 8.3.3. Government & Defense
- 8.3.4. Transportation
- 8.3.5. Other End-user Industries
- 8.1. Market Analysis, Insights and Forecast - by Application
- 9. Latin America Cognitive Radio Industry Analysis, Insights and Forecast, 2019-2031
- 9.1. Market Analysis, Insights and Forecast - by Application
- 9.1.1. Spectrum Sensing & Allocation
- 9.1.2. Location Detection
- 9.1.3. Cognitive Routing
- 9.1.4. QoS (Quality of Service) Optimisation
- 9.1.5. Other Applications
- 9.2. Market Analysis, Insights and Forecast - by Service
- 9.2.1. Professional Services
- 9.2.2. Managed Services
- 9.3. Market Analysis, Insights and Forecast - by End-user Industry
- 9.3.1. Telecommunication
- 9.3.2. IT & ITes
- 9.3.3. Government & Defense
- 9.3.4. Transportation
- 9.3.5. Other End-user Industries
- 9.1. Market Analysis, Insights and Forecast - by Application
- 10. MEA Cognitive Radio Industry Analysis, Insights and Forecast, 2019-2031
- 10.1. Market Analysis, Insights and Forecast - by Application
- 10.1.1. Spectrum Sensing & Allocation
- 10.1.2. Location Detection
- 10.1.3. Cognitive Routing
- 10.1.4. QoS (Quality of Service) Optimisation
- 10.1.5. Other Applications
- 10.2. Market Analysis, Insights and Forecast - by Service
- 10.2.1. Professional Services
- 10.2.2. Managed Services
- 10.3. Market Analysis, Insights and Forecast - by End-user Industry
- 10.3.1. Telecommunication
- 10.3.2. IT & ITes
- 10.3.3. Government & Defense
- 10.3.4. Transportation
- 10.3.5. Other End-user Industries
- 10.1. Market Analysis, Insights and Forecast - by Application
- 11. North America Cognitive Radio Industry Analysis, Insights and Forecast, 2019-2031
- 11.1. Market Analysis, Insights and Forecast - By Country/Sub-region
- 11.1.1 United States
- 11.1.2 Canada
- 11.1.3 Mexico
- 12. Europe Cognitive Radio Industry Analysis, Insights and Forecast, 2019-2031
- 12.1. Market Analysis, Insights and Forecast - By Country/Sub-region
- 12.1.1 Germany
- 12.1.2 United Kingdom
- 12.1.3 France
- 12.1.4 Spain
- 12.1.5 Italy
- 12.1.6 Spain
- 12.1.7 Belgium
- 12.1.8 Netherland
- 12.1.9 Nordics
- 12.1.10 Rest of Europe
- 13. Asia Pacific Cognitive Radio Industry Analysis, Insights and Forecast, 2019-2031
- 13.1. Market Analysis, Insights and Forecast - By Country/Sub-region
- 13.1.1 China
- 13.1.2 Japan
- 13.1.3 India
- 13.1.4 South Korea
- 13.1.5 Southeast Asia
- 13.1.6 Australia
- 13.1.7 Indonesia
- 13.1.8 Phillipes
- 13.1.9 Singapore
- 13.1.10 Thailandc
- 13.1.11 Rest of Asia Pacific
- 14. South America Cognitive Radio Industry Analysis, Insights and Forecast, 2019-2031
- 14.1. Market Analysis, Insights and Forecast - By Country/Sub-region
- 14.1.1 Brazil
- 14.1.2 Argentina
- 14.1.3 Peru
- 14.1.4 Chile
- 14.1.5 Colombia
- 14.1.6 Ecuador
- 14.1.7 Venezuela
- 14.1.8 Rest of South America
- 15. North America Cognitive Radio Industry Analysis, Insights and Forecast, 2019-2031
- 15.1. Market Analysis, Insights and Forecast - By Country/Sub-region
- 15.1.1 United States
- 15.1.2 Canada
- 15.1.3 Mexico
- 16. MEA Cognitive Radio Industry Analysis, Insights and Forecast, 2019-2031
- 16.1. Market Analysis, Insights and Forecast - By Country/Sub-region
- 16.1.1 United Arab Emirates
- 16.1.2 Saudi Arabia
- 16.1.3 South Africa
- 16.1.4 Rest of Middle East and Africa
- 17. Competitive Analysis
- 17.1. Global Market Share Analysis 2024
- 17.2. Company Profiles
- 17.2.1 Shared Spectrum Company
- 17.2.1.1. Overview
- 17.2.1.2. Products
- 17.2.1.3. SWOT Analysis
- 17.2.1.4. Recent Developments
- 17.2.1.5. Financials (Based on Availability)
- 17.2.2 Raytheon Company
- 17.2.2.1. Overview
- 17.2.2.2. Products
- 17.2.2.3. SWOT Analysis
- 17.2.2.4. Recent Developments
- 17.2.2.5. Financials (Based on Availability)
- 17.2.3 Thales Group
- 17.2.3.1. Overview
- 17.2.3.2. Products
- 17.2.3.3. SWOT Analysis
- 17.2.3.4. Recent Developments
- 17.2.3.5. Financials (Based on Availability)
- 17.2.4 BAE Systems PLC
- 17.2.4.1. Overview
- 17.2.4.2. Products
- 17.2.4.3. SWOT Analysis
- 17.2.4.4. Recent Developments
- 17.2.4.5. Financials (Based on Availability)
- 17.2.5 Rohde & Schwarz GmbH & Co KG
- 17.2.5.1. Overview
- 17.2.5.2. Products
- 17.2.5.3. SWOT Analysis
- 17.2.5.4. Recent Developments
- 17.2.5.5. Financials (Based on Availability)
- 17.2.6 Spectrum Signal Processing (Vecima)
- 17.2.6.1. Overview
- 17.2.6.2. Products
- 17.2.6.3. SWOT Analysis
- 17.2.6.4. Recent Developments
- 17.2.6.5. Financials (Based on Availability)
- 17.2.7 Rockwell Collins Inc (United Technologies Company)
- 17.2.7.1. Overview
- 17.2.7.2. Products
- 17.2.7.3. SWOT Analysis
- 17.2.7.4. Recent Developments
- 17.2.7.5. Financials (Based on Availability)
- 17.2.8 Innovation Nutaq Inc (NuRAN Wireless Inc )
- 17.2.8.1. Overview
- 17.2.8.2. Products
- 17.2.8.3. SWOT Analysis
- 17.2.8.4. Recent Developments
- 17.2.8.5. Financials (Based on Availability)
- 17.2.1 Shared Spectrum Company
List of Figures
- Figure 1: Global Cognitive Radio Industry Revenue Breakdown (Million, %) by Region 2024 & 2032
- Figure 2: Global Cognitive Radio Industry Volume Breakdown (K Unit, %) by Region 2024 & 2032
- Figure 3: North America Cognitive Radio Industry Revenue (Million), by Country 2024 & 2032
- Figure 4: North America Cognitive Radio Industry Volume (K Unit), by Country 2024 & 2032
- Figure 5: North America Cognitive Radio Industry Revenue Share (%), by Country 2024 & 2032
- Figure 6: North America Cognitive Radio Industry Volume Share (%), by Country 2024 & 2032
- Figure 7: Europe Cognitive Radio Industry Revenue (Million), by Country 2024 & 2032
- Figure 8: Europe Cognitive Radio Industry Volume (K Unit), by Country 2024 & 2032
- Figure 9: Europe Cognitive Radio Industry Revenue Share (%), by Country 2024 & 2032
- Figure 10: Europe Cognitive Radio Industry Volume Share (%), by Country 2024 & 2032
- Figure 11: Asia Pacific Cognitive Radio Industry Revenue (Million), by Country 2024 & 2032
- Figure 12: Asia Pacific Cognitive Radio Industry Volume (K Unit), by Country 2024 & 2032
- Figure 13: Asia Pacific Cognitive Radio Industry Revenue Share (%), by Country 2024 & 2032
- Figure 14: Asia Pacific Cognitive Radio Industry Volume Share (%), by Country 2024 & 2032
- Figure 15: South America Cognitive Radio Industry Revenue (Million), by Country 2024 & 2032
- Figure 16: South America Cognitive Radio Industry Volume (K Unit), by Country 2024 & 2032
- Figure 17: South America Cognitive Radio Industry Revenue Share (%), by Country 2024 & 2032
- Figure 18: South America Cognitive Radio Industry Volume Share (%), by Country 2024 & 2032
- Figure 19: North America Cognitive Radio Industry Revenue (Million), by Country 2024 & 2032
- Figure 20: North America Cognitive Radio Industry Volume (K Unit), by Country 2024 & 2032
- Figure 21: North America Cognitive Radio Industry Revenue Share (%), by Country 2024 & 2032
- Figure 22: North America Cognitive Radio Industry Volume Share (%), by Country 2024 & 2032
- Figure 23: MEA Cognitive Radio Industry Revenue (Million), by Country 2024 & 2032
- Figure 24: MEA Cognitive Radio Industry Volume (K Unit), by Country 2024 & 2032
- Figure 25: MEA Cognitive Radio Industry Revenue Share (%), by Country 2024 & 2032
- Figure 26: MEA Cognitive Radio Industry Volume Share (%), by Country 2024 & 2032
- Figure 27: North America Cognitive Radio Industry Revenue (Million), by Application 2024 & 2032
- Figure 28: North America Cognitive Radio Industry Volume (K Unit), by Application 2024 & 2032
- Figure 29: North America Cognitive Radio Industry Revenue Share (%), by Application 2024 & 2032
- Figure 30: North America Cognitive Radio Industry Volume Share (%), by Application 2024 & 2032
- Figure 31: North America Cognitive Radio Industry Revenue (Million), by Service 2024 & 2032
- Figure 32: North America Cognitive Radio Industry Volume (K Unit), by Service 2024 & 2032
- Figure 33: North America Cognitive Radio Industry Revenue Share (%), by Service 2024 & 2032
- Figure 34: North America Cognitive Radio Industry Volume Share (%), by Service 2024 & 2032
- Figure 35: North America Cognitive Radio Industry Revenue (Million), by End-user Industry 2024 & 2032
- Figure 36: North America Cognitive Radio Industry Volume (K Unit), by End-user Industry 2024 & 2032
- Figure 37: North America Cognitive Radio Industry Revenue Share (%), by End-user Industry 2024 & 2032
- Figure 38: North America Cognitive Radio Industry Volume Share (%), by End-user Industry 2024 & 2032
- Figure 39: North America Cognitive Radio Industry Revenue (Million), by Country 2024 & 2032
- Figure 40: North America Cognitive Radio Industry Volume (K Unit), by Country 2024 & 2032
- Figure 41: North America Cognitive Radio Industry Revenue Share (%), by Country 2024 & 2032
- Figure 42: North America Cognitive Radio Industry Volume Share (%), by Country 2024 & 2032
- Figure 43: Europe Cognitive Radio Industry Revenue (Million), by Application 2024 & 2032
- Figure 44: Europe Cognitive Radio Industry Volume (K Unit), by Application 2024 & 2032
- Figure 45: Europe Cognitive Radio Industry Revenue Share (%), by Application 2024 & 2032
- Figure 46: Europe Cognitive Radio Industry Volume Share (%), by Application 2024 & 2032
- Figure 47: Europe Cognitive Radio Industry Revenue (Million), by Service 2024 & 2032
- Figure 48: Europe Cognitive Radio Industry Volume (K Unit), by Service 2024 & 2032
- Figure 49: Europe Cognitive Radio Industry Revenue Share (%), by Service 2024 & 2032
- Figure 50: Europe Cognitive Radio Industry Volume Share (%), by Service 2024 & 2032
- Figure 51: Europe Cognitive Radio Industry Revenue (Million), by End-user Industry 2024 & 2032
- Figure 52: Europe Cognitive Radio Industry Volume (K Unit), by End-user Industry 2024 & 2032
- Figure 53: Europe Cognitive Radio Industry Revenue Share (%), by End-user Industry 2024 & 2032
- Figure 54: Europe Cognitive Radio Industry Volume Share (%), by End-user Industry 2024 & 2032
- Figure 55: Europe Cognitive Radio Industry Revenue (Million), by Country 2024 & 2032
- Figure 56: Europe Cognitive Radio Industry Volume (K Unit), by Country 2024 & 2032
- Figure 57: Europe Cognitive Radio Industry Revenue Share (%), by Country 2024 & 2032
- Figure 58: Europe Cognitive Radio Industry Volume Share (%), by Country 2024 & 2032
- Figure 59: Asia Pacific Cognitive Radio Industry Revenue (Million), by Application 2024 & 2032
- Figure 60: Asia Pacific Cognitive Radio Industry Volume (K Unit), by Application 2024 & 2032
- Figure 61: Asia Pacific Cognitive Radio Industry Revenue Share (%), by Application 2024 & 2032
- Figure 62: Asia Pacific Cognitive Radio Industry Volume Share (%), by Application 2024 & 2032
- Figure 63: Asia Pacific Cognitive Radio Industry Revenue (Million), by Service 2024 & 2032
- Figure 64: Asia Pacific Cognitive Radio Industry Volume (K Unit), by Service 2024 & 2032
- Figure 65: Asia Pacific Cognitive Radio Industry Revenue Share (%), by Service 2024 & 2032
- Figure 66: Asia Pacific Cognitive Radio Industry Volume Share (%), by Service 2024 & 2032
- Figure 67: Asia Pacific Cognitive Radio Industry Revenue (Million), by End-user Industry 2024 & 2032
- Figure 68: Asia Pacific Cognitive Radio Industry Volume (K Unit), by End-user Industry 2024 & 2032
- Figure 69: Asia Pacific Cognitive Radio Industry Revenue Share (%), by End-user Industry 2024 & 2032
- Figure 70: Asia Pacific Cognitive Radio Industry Volume Share (%), by End-user Industry 2024 & 2032
- Figure 71: Asia Pacific Cognitive Radio Industry Revenue (Million), by Country 2024 & 2032
- Figure 72: Asia Pacific Cognitive Radio Industry Volume (K Unit), by Country 2024 & 2032
- Figure 73: Asia Pacific Cognitive Radio Industry Revenue Share (%), by Country 2024 & 2032
- Figure 74: Asia Pacific Cognitive Radio Industry Volume Share (%), by Country 2024 & 2032
- Figure 75: Latin America Cognitive Radio Industry Revenue (Million), by Application 2024 & 2032
- Figure 76: Latin America Cognitive Radio Industry Volume (K Unit), by Application 2024 & 2032
- Figure 77: Latin America Cognitive Radio Industry Revenue Share (%), by Application 2024 & 2032
- Figure 78: Latin America Cognitive Radio Industry Volume Share (%), by Application 2024 & 2032
- Figure 79: Latin America Cognitive Radio Industry Revenue (Million), by Service 2024 & 2032
- Figure 80: Latin America Cognitive Radio Industry Volume (K Unit), by Service 2024 & 2032
- Figure 81: Latin America Cognitive Radio Industry Revenue Share (%), by Service 2024 & 2032
- Figure 82: Latin America Cognitive Radio Industry Volume Share (%), by Service 2024 & 2032
- Figure 83: Latin America Cognitive Radio Industry Revenue (Million), by End-user Industry 2024 & 2032
- Figure 84: Latin America Cognitive Radio Industry Volume (K Unit), by End-user Industry 2024 & 2032
- Figure 85: Latin America Cognitive Radio Industry Revenue Share (%), by End-user Industry 2024 & 2032
- Figure 86: Latin America Cognitive Radio Industry Volume Share (%), by End-user Industry 2024 & 2032
- Figure 87: Latin America Cognitive Radio Industry Revenue (Million), by Country 2024 & 2032
- Figure 88: Latin America Cognitive Radio Industry Volume (K Unit), by Country 2024 & 2032
- Figure 89: Latin America Cognitive Radio Industry Revenue Share (%), by Country 2024 & 2032
- Figure 90: Latin America Cognitive Radio Industry Volume Share (%), by Country 2024 & 2032
- Figure 91: MEA Cognitive Radio Industry Revenue (Million), by Application 2024 & 2032
- Figure 92: MEA Cognitive Radio Industry Volume (K Unit), by Application 2024 & 2032
- Figure 93: MEA Cognitive Radio Industry Revenue Share (%), by Application 2024 & 2032
- Figure 94: MEA Cognitive Radio Industry Volume Share (%), by Application 2024 & 2032
- Figure 95: MEA Cognitive Radio Industry Revenue (Million), by Service 2024 & 2032
- Figure 96: MEA Cognitive Radio Industry Volume (K Unit), by Service 2024 & 2032
- Figure 97: MEA Cognitive Radio Industry Revenue Share (%), by Service 2024 & 2032
- Figure 98: MEA Cognitive Radio Industry Volume Share (%), by Service 2024 & 2032
- Figure 99: MEA Cognitive Radio Industry Revenue (Million), by End-user Industry 2024 & 2032
- Figure 100: MEA Cognitive Radio Industry Volume (K Unit), by End-user Industry 2024 & 2032
- Figure 101: MEA Cognitive Radio Industry Revenue Share (%), by End-user Industry 2024 & 2032
- Figure 102: MEA Cognitive Radio Industry Volume Share (%), by End-user Industry 2024 & 2032
- Figure 103: MEA Cognitive Radio Industry Revenue (Million), by Country 2024 & 2032
- Figure 104: MEA Cognitive Radio Industry Volume (K Unit), by Country 2024 & 2032
- Figure 105: MEA Cognitive Radio Industry Revenue Share (%), by Country 2024 & 2032
- Figure 106: MEA Cognitive Radio Industry Volume Share (%), by Country 2024 & 2032
List of Tables
- Table 1: Global Cognitive Radio Industry Revenue Million Forecast, by Region 2019 & 2032
- Table 2: Global Cognitive Radio Industry Volume K Unit Forecast, by Region 2019 & 2032
- Table 3: Global Cognitive Radio Industry Revenue Million Forecast, by Application 2019 & 2032
- Table 4: Global Cognitive Radio Industry Volume K Unit Forecast, by Application 2019 & 2032
- Table 5: Global Cognitive Radio Industry Revenue Million Forecast, by Service 2019 & 2032
- Table 6: Global Cognitive Radio Industry Volume K Unit Forecast, by Service 2019 & 2032
- Table 7: Global Cognitive Radio Industry Revenue Million Forecast, by End-user Industry 2019 & 2032
- Table 8: Global Cognitive Radio Industry Volume K Unit Forecast, by End-user Industry 2019 & 2032
- Table 9: Global Cognitive Radio Industry Revenue Million Forecast, by Region 2019 & 2032
- Table 10: Global Cognitive Radio Industry Volume K Unit Forecast, by Region 2019 & 2032
- Table 11: Global Cognitive Radio Industry Revenue Million Forecast, by Country 2019 & 2032
- Table 12: Global Cognitive Radio Industry Volume K Unit Forecast, by Country 2019 & 2032
- Table 13: United States Cognitive Radio Industry Revenue (Million) Forecast, by Application 2019 & 2032
- Table 14: United States Cognitive Radio Industry Volume (K Unit) Forecast, by Application 2019 & 2032
- Table 15: Canada Cognitive Radio Industry Revenue (Million) Forecast, by Application 2019 & 2032
- Table 16: Canada Cognitive Radio Industry Volume (K Unit) Forecast, by Application 2019 & 2032
- Table 17: Mexico Cognitive Radio Industry Revenue (Million) Forecast, by Application 2019 & 2032
- Table 18: Mexico Cognitive Radio Industry Volume (K Unit) Forecast, by Application 2019 & 2032
- Table 19: Global Cognitive Radio Industry Revenue Million Forecast, by Country 2019 & 2032
- Table 20: Global Cognitive Radio Industry Volume K Unit Forecast, by Country 2019 & 2032
- Table 21: Germany Cognitive Radio Industry Revenue (Million) Forecast, by Application 2019 & 2032
- Table 22: Germany Cognitive Radio Industry Volume (K Unit) Forecast, by Application 2019 & 2032
- Table 23: United Kingdom Cognitive Radio Industry Revenue (Million) Forecast, by Application 2019 & 2032
- Table 24: United Kingdom Cognitive Radio Industry Volume (K Unit) Forecast, by Application 2019 & 2032
- Table 25: France Cognitive Radio Industry Revenue (Million) Forecast, by Application 2019 & 2032
- Table 26: France Cognitive Radio Industry Volume (K Unit) Forecast, by Application 2019 & 2032
- Table 27: Spain Cognitive Radio Industry Revenue (Million) Forecast, by Application 2019 & 2032
- Table 28: Spain Cognitive Radio Industry Volume (K Unit) Forecast, by Application 2019 & 2032
- Table 29: Italy Cognitive Radio Industry Revenue (Million) Forecast, by Application 2019 & 2032
- Table 30: Italy Cognitive Radio Industry Volume (K Unit) Forecast, by Application 2019 & 2032
- Table 31: Spain Cognitive Radio Industry Revenue (Million) Forecast, by Application 2019 & 2032
- Table 32: Spain Cognitive Radio Industry Volume (K Unit) Forecast, by Application 2019 & 2032
- Table 33: Belgium Cognitive Radio Industry Revenue (Million) Forecast, by Application 2019 & 2032
- Table 34: Belgium Cognitive Radio Industry Volume (K Unit) Forecast, by Application 2019 & 2032
- Table 35: Netherland Cognitive Radio Industry Revenue (Million) Forecast, by Application 2019 & 2032
- Table 36: Netherland Cognitive Radio Industry Volume (K Unit) Forecast, by Application 2019 & 2032
- Table 37: Nordics Cognitive Radio Industry Revenue (Million) Forecast, by Application 2019 & 2032
- Table 38: Nordics Cognitive Radio Industry Volume (K Unit) Forecast, by Application 2019 & 2032
- Table 39: Rest of Europe Cognitive Radio Industry Revenue (Million) Forecast, by Application 2019 & 2032
- Table 40: Rest of Europe Cognitive Radio Industry Volume (K Unit) Forecast, by Application 2019 & 2032
- Table 41: Global Cognitive Radio Industry Revenue Million Forecast, by Country 2019 & 2032
- Table 42: Global Cognitive Radio Industry Volume K Unit Forecast, by Country 2019 & 2032
- Table 43: China Cognitive Radio Industry Revenue (Million) Forecast, by Application 2019 & 2032
- Table 44: China Cognitive Radio Industry Volume (K Unit) Forecast, by Application 2019 & 2032
- Table 45: Japan Cognitive Radio Industry Revenue (Million) Forecast, by Application 2019 & 2032
- Table 46: Japan Cognitive Radio Industry Volume (K Unit) Forecast, by Application 2019 & 2032
- Table 47: India Cognitive Radio Industry Revenue (Million) Forecast, by Application 2019 & 2032
- Table 48: India Cognitive Radio Industry Volume (K Unit) Forecast, by Application 2019 & 2032
- Table 49: South Korea Cognitive Radio Industry Revenue (Million) Forecast, by Application 2019 & 2032
- Table 50: South Korea Cognitive Radio Industry Volume (K Unit) Forecast, by Application 2019 & 2032
- Table 51: Southeast Asia Cognitive Radio Industry Revenue (Million) Forecast, by Application 2019 & 2032
- Table 52: Southeast Asia Cognitive Radio Industry Volume (K Unit) Forecast, by Application 2019 & 2032
- Table 53: Australia Cognitive Radio Industry Revenue (Million) Forecast, by Application 2019 & 2032
- Table 54: Australia Cognitive Radio Industry Volume (K Unit) Forecast, by Application 2019 & 2032
- Table 55: Indonesia Cognitive Radio Industry Revenue (Million) Forecast, by Application 2019 & 2032
- Table 56: Indonesia Cognitive Radio Industry Volume (K Unit) Forecast, by Application 2019 & 2032
- Table 57: Phillipes Cognitive Radio Industry Revenue (Million) Forecast, by Application 2019 & 2032
- Table 58: Phillipes Cognitive Radio Industry Volume (K Unit) Forecast, by Application 2019 & 2032
- Table 59: Singapore Cognitive Radio Industry Revenue (Million) Forecast, by Application 2019 & 2032
- Table 60: Singapore Cognitive Radio Industry Volume (K Unit) Forecast, by Application 2019 & 2032
- Table 61: Thailandc Cognitive Radio Industry Revenue (Million) Forecast, by Application 2019 & 2032
- Table 62: Thailandc Cognitive Radio Industry Volume (K Unit) Forecast, by Application 2019 & 2032
- Table 63: Rest of Asia Pacific Cognitive Radio Industry Revenue (Million) Forecast, by Application 2019 & 2032
- Table 64: Rest of Asia Pacific Cognitive Radio Industry Volume (K Unit) Forecast, by Application 2019 & 2032
- Table 65: Global Cognitive Radio Industry Revenue Million Forecast, by Country 2019 & 2032
- Table 66: Global Cognitive Radio Industry Volume K Unit Forecast, by Country 2019 & 2032
- Table 67: Brazil Cognitive Radio Industry Revenue (Million) Forecast, by Application 2019 & 2032
- Table 68: Brazil Cognitive Radio Industry Volume (K Unit) Forecast, by Application 2019 & 2032
- Table 69: Argentina Cognitive Radio Industry Revenue (Million) Forecast, by Application 2019 & 2032
- Table 70: Argentina Cognitive Radio Industry Volume (K Unit) Forecast, by Application 2019 & 2032
- Table 71: Peru Cognitive Radio Industry Revenue (Million) Forecast, by Application 2019 & 2032
- Table 72: Peru Cognitive Radio Industry Volume (K Unit) Forecast, by Application 2019 & 2032
- Table 73: Chile Cognitive Radio Industry Revenue (Million) Forecast, by Application 2019 & 2032
- Table 74: Chile Cognitive Radio Industry Volume (K Unit) Forecast, by Application 2019 & 2032
- Table 75: Colombia Cognitive Radio Industry Revenue (Million) Forecast, by Application 2019 & 2032
- Table 76: Colombia Cognitive Radio Industry Volume (K Unit) Forecast, by Application 2019 & 2032
- Table 77: Ecuador Cognitive Radio Industry Revenue (Million) Forecast, by Application 2019 & 2032
- Table 78: Ecuador Cognitive Radio Industry Volume (K Unit) Forecast, by Application 2019 & 2032
- Table 79: Venezuela Cognitive Radio Industry Revenue (Million) Forecast, by Application 2019 & 2032
- Table 80: Venezuela Cognitive Radio Industry Volume (K Unit) Forecast, by Application 2019 & 2032
- Table 81: Rest of South America Cognitive Radio Industry Revenue (Million) Forecast, by Application 2019 & 2032
- Table 82: Rest of South America Cognitive Radio Industry Volume (K Unit) Forecast, by Application 2019 & 2032
- Table 83: Global Cognitive Radio Industry Revenue Million Forecast, by Country 2019 & 2032
- Table 84: Global Cognitive Radio Industry Volume K Unit Forecast, by Country 2019 & 2032
- Table 85: United States Cognitive Radio Industry Revenue (Million) Forecast, by Application 2019 & 2032
- Table 86: United States Cognitive Radio Industry Volume (K Unit) Forecast, by Application 2019 & 2032
- Table 87: Canada Cognitive Radio Industry Revenue (Million) Forecast, by Application 2019 & 2032
- Table 88: Canada Cognitive Radio Industry Volume (K Unit) Forecast, by Application 2019 & 2032
- Table 89: Mexico Cognitive Radio Industry Revenue (Million) Forecast, by Application 2019 & 2032
- Table 90: Mexico Cognitive Radio Industry Volume (K Unit) Forecast, by Application 2019 & 2032
- Table 91: Global Cognitive Radio Industry Revenue Million Forecast, by Country 2019 & 2032
- Table 92: Global Cognitive Radio Industry Volume K Unit Forecast, by Country 2019 & 2032
- Table 93: United Arab Emirates Cognitive Radio Industry Revenue (Million) Forecast, by Application 2019 & 2032
- Table 94: United Arab Emirates Cognitive Radio Industry Volume (K Unit) Forecast, by Application 2019 & 2032
- Table 95: Saudi Arabia Cognitive Radio Industry Revenue (Million) Forecast, by Application 2019 & 2032
- Table 96: Saudi Arabia Cognitive Radio Industry Volume (K Unit) Forecast, by Application 2019 & 2032
- Table 97: South Africa Cognitive Radio Industry Revenue (Million) Forecast, by Application 2019 & 2032
- Table 98: South Africa Cognitive Radio Industry Volume (K Unit) Forecast, by Application 2019 & 2032
- Table 99: Rest of Middle East and Africa Cognitive Radio Industry Revenue (Million) Forecast, by Application 2019 & 2032
- Table 100: Rest of Middle East and Africa Cognitive Radio Industry Volume (K Unit) Forecast, by Application 2019 & 2032
- Table 101: Global Cognitive Radio Industry Revenue Million Forecast, by Application 2019 & 2032
- Table 102: Global Cognitive Radio Industry Volume K Unit Forecast, by Application 2019 & 2032
- Table 103: Global Cognitive Radio Industry Revenue Million Forecast, by Service 2019 & 2032
- Table 104: Global Cognitive Radio Industry Volume K Unit Forecast, by Service 2019 & 2032
- Table 105: Global Cognitive Radio Industry Revenue Million Forecast, by End-user Industry 2019 & 2032
- Table 106: Global Cognitive Radio Industry Volume K Unit Forecast, by End-user Industry 2019 & 2032
- Table 107: Global Cognitive Radio Industry Revenue Million Forecast, by Country 2019 & 2032
- Table 108: Global Cognitive Radio Industry Volume K Unit Forecast, by Country 2019 & 2032
- Table 109: United States Cognitive Radio Industry Revenue (Million) Forecast, by Application 2019 & 2032
- Table 110: United States Cognitive Radio Industry Volume (K Unit) Forecast, by Application 2019 & 2032
- Table 111: Canada Cognitive Radio Industry Revenue (Million) Forecast, by Application 2019 & 2032
- Table 112: Canada Cognitive Radio Industry Volume (K Unit) Forecast, by Application 2019 & 2032
- Table 113: Global Cognitive Radio Industry Revenue Million Forecast, by Application 2019 & 2032
- Table 114: Global Cognitive Radio Industry Volume K Unit Forecast, by Application 2019 & 2032
- Table 115: Global Cognitive Radio Industry Revenue Million Forecast, by Service 2019 & 2032
- Table 116: Global Cognitive Radio Industry Volume K Unit Forecast, by Service 2019 & 2032
- Table 117: Global Cognitive Radio Industry Revenue Million Forecast, by End-user Industry 2019 & 2032
- Table 118: Global Cognitive Radio Industry Volume K Unit Forecast, by End-user Industry 2019 & 2032
- Table 119: Global Cognitive Radio Industry Revenue Million Forecast, by Country 2019 & 2032
- Table 120: Global Cognitive Radio Industry Volume K Unit Forecast, by Country 2019 & 2032
- Table 121: United Kingdom Cognitive Radio Industry Revenue (Million) Forecast, by Application 2019 & 2032
- Table 122: United Kingdom Cognitive Radio Industry Volume (K Unit) Forecast, by Application 2019 & 2032
- Table 123: Germany Cognitive Radio Industry Revenue (Million) Forecast, by Application 2019 & 2032
- Table 124: Germany Cognitive Radio Industry Volume (K Unit) Forecast, by Application 2019 & 2032
- Table 125: France Cognitive Radio Industry Revenue (Million) Forecast, by Application 2019 & 2032
- Table 126: France Cognitive Radio Industry Volume (K Unit) Forecast, by Application 2019 & 2032
- Table 127: Rest of Europe Cognitive Radio Industry Revenue (Million) Forecast, by Application 2019 & 2032
- Table 128: Rest of Europe Cognitive Radio Industry Volume (K Unit) Forecast, by Application 2019 & 2032
- Table 129: Global Cognitive Radio Industry Revenue Million Forecast, by Application 2019 & 2032
- Table 130: Global Cognitive Radio Industry Volume K Unit Forecast, by Application 2019 & 2032
- Table 131: Global Cognitive Radio Industry Revenue Million Forecast, by Service 2019 & 2032
- Table 132: Global Cognitive Radio Industry Volume K Unit Forecast, by Service 2019 & 2032
- Table 133: Global Cognitive Radio Industry Revenue Million Forecast, by End-user Industry 2019 & 2032
- Table 134: Global Cognitive Radio Industry Volume K Unit Forecast, by End-user Industry 2019 & 2032
- Table 135: Global Cognitive Radio Industry Revenue Million Forecast, by Country 2019 & 2032
- Table 136: Global Cognitive Radio Industry Volume K Unit Forecast, by Country 2019 & 2032
- Table 137: China Cognitive Radio Industry Revenue (Million) Forecast, by Application 2019 & 2032
- Table 138: China Cognitive Radio Industry Volume (K Unit) Forecast, by Application 2019 & 2032
- Table 139: Japan Cognitive Radio Industry Revenue (Million) Forecast, by Application 2019 & 2032
- Table 140: Japan Cognitive Radio Industry Volume (K Unit) Forecast, by Application 2019 & 2032
- Table 141: South Korea Cognitive Radio Industry Revenue (Million) Forecast, by Application 2019 & 2032
- Table 142: South Korea Cognitive Radio Industry Volume (K Unit) Forecast, by Application 2019 & 2032
- Table 143: Rest of Asia Pacific Cognitive Radio Industry Revenue (Million) Forecast, by Application 2019 & 2032
- Table 144: Rest of Asia Pacific Cognitive Radio Industry Volume (K Unit) Forecast, by Application 2019 & 2032
- Table 145: Global Cognitive Radio Industry Revenue Million Forecast, by Application 2019 & 2032
- Table 146: Global Cognitive Radio Industry Volume K Unit Forecast, by Application 2019 & 2032
- Table 147: Global Cognitive Radio Industry Revenue Million Forecast, by Service 2019 & 2032
- Table 148: Global Cognitive Radio Industry Volume K Unit Forecast, by Service 2019 & 2032
- Table 149: Global Cognitive Radio Industry Revenue Million Forecast, by End-user Industry 2019 & 2032
- Table 150: Global Cognitive Radio Industry Volume K Unit Forecast, by End-user Industry 2019 & 2032
- Table 151: Global Cognitive Radio Industry Revenue Million Forecast, by Country 2019 & 2032
- Table 152: Global Cognitive Radio Industry Volume K Unit Forecast, by Country 2019 & 2032
- Table 153: Brazil Cognitive Radio Industry Revenue (Million) Forecast, by Application 2019 & 2032
- Table 154: Brazil Cognitive Radio Industry Volume (K Unit) Forecast, by Application 2019 & 2032
- Table 155: Argentina Cognitive Radio Industry Revenue (Million) Forecast, by Application 2019 & 2032
- Table 156: Argentina Cognitive Radio Industry Volume (K Unit) Forecast, by Application 2019 & 2032
- Table 157: Rest of South America Cognitive Radio Industry Revenue (Million) Forecast, by Application 2019 & 2032
- Table 158: Rest of South America Cognitive Radio Industry Volume (K Unit) Forecast, by Application 2019 & 2032
- Table 159: Global Cognitive Radio Industry Revenue Million Forecast, by Application 2019 & 2032
- Table 160: Global Cognitive Radio Industry Volume K Unit Forecast, by Application 2019 & 2032
- Table 161: Global Cognitive Radio Industry Revenue Million Forecast, by Service 2019 & 2032
- Table 162: Global Cognitive Radio Industry Volume K Unit Forecast, by Service 2019 & 2032
- Table 163: Global Cognitive Radio Industry Revenue Million Forecast, by End-user Industry 2019 & 2032
- Table 164: Global Cognitive Radio Industry Volume K Unit Forecast, by End-user Industry 2019 & 2032
- Table 165: Global Cognitive Radio Industry Revenue Million Forecast, by Country 2019 & 2032
- Table 166: Global Cognitive Radio Industry Volume K Unit Forecast, by Country 2019 & 2032
- Table 167: UAE Cognitive Radio Industry Revenue (Million) Forecast, by Application 2019 & 2032
- Table 168: UAE Cognitive Radio Industry Volume (K Unit) Forecast, by Application 2019 & 2032
- Table 169: South Africa Cognitive Radio Industry Revenue (Million) Forecast, by Application 2019 & 2032
- Table 170: South Africa Cognitive Radio Industry Volume (K Unit) Forecast, by Application 2019 & 2032
- Table 171: Saudi Arabia Cognitive Radio Industry Revenue (Million) Forecast, by Application 2019 & 2032
- Table 172: Saudi Arabia Cognitive Radio Industry Volume (K Unit) Forecast, by Application 2019 & 2032
- Table 173: Rest Of MEA Cognitive Radio Industry Revenue (Million) Forecast, by Application 2019 & 2032
- Table 174: Rest Of MEA Cognitive Radio Industry Volume (K Unit) Forecast, by Application 2019 & 2032
Frequently Asked Questions
1. What is the projected Compound Annual Growth Rate (CAGR) of the Cognitive Radio Industry?
The projected CAGR is approximately 16.48%.
2. Which companies are prominent players in the Cognitive Radio Industry?
Key companies in the market include Shared Spectrum Company, Raytheon Company, Thales Group, BAE Systems PLC, Rohde & Schwarz GmbH & Co KG, Spectrum Signal Processing (Vecima), Rockwell Collins Inc (United Technologies Company), Innovation Nutaq Inc (NuRAN Wireless Inc ).
3. What are the main segments of the Cognitive Radio Industry?
The market segments include Application, Service, End-user Industry.
4. Can you provide details about the market size?
The market size is estimated to be USD 8.84 Million as of 2022.
5. What are some drivers contributing to market growth?
Growing Need to Optimise the Spectrum Utilisation; Rising Development of 5G Service Applications Among End-user Industries.
6. What are the notable trends driving market growth?
Telecommunication Sector is Gaining Traction Due to Emergence of 5G Applications.
7. Are there any restraints impacting market growth?
Lack of Proper Computational Security Infrastructure.
8. Can you provide examples of recent developments in the market?
March 2023: Intellisense Systems Inc. selected BrainChip's Akida neuromorphic technology to improve the cognitive communication capabilities on size, weight, and power (SWaP)-constrained platforms (such as spacecraft and robotics) for commercial and government markets. The NECR technology from Intellisense offers NASA a variety of applications and can be used to improve the stability and dependability of space communication and networking, particularly for cognitive radio equipment.
9. What pricing options are available for accessing the report?
Pricing options include single-user, multi-user, and enterprise licenses priced at USD 4750, USD 5250, and USD 8750 respectively.
10. Is the market size provided in terms of value or volume?
The market size is provided in terms of value, measured in Million and volume, measured in K Unit.
11. Are there any specific market keywords associated with the report?
Yes, the market keyword associated with the report is "Cognitive Radio Industry," which aids in identifying and referencing the specific market segment covered.
12. How do I determine which pricing option suits my needs best?
The pricing options vary based on user requirements and access needs. Individual users may opt for single-user licenses, while businesses requiring broader access may choose multi-user or enterprise licenses for cost-effective access to the report.
13. Are there any additional resources or data provided in the Cognitive Radio Industry report?
While the report offers comprehensive insights, it's advisable to review the specific contents or supplementary materials provided to ascertain if additional resources or data are available.
14. How can I stay updated on further developments or reports in the Cognitive Radio Industry?
To stay informed about further developments, trends, and reports in the Cognitive Radio Industry, consider subscribing to industry newsletters, following relevant companies and organizations, or regularly checking reputable industry news sources and publications.
Methodology
Step 1 - Identification of Relevant Samples Size from Population Database


Step 2 - Approaches for Defining Global Market Size (Value, Volume* & Price*)

Note*: In applicable scenarios
Step 3 - Data Sources
Primary Research
- Web Analytics
- Survey Reports
- Research Institute
- Latest Research Reports
- Opinion Leaders
Secondary Research
- Annual Reports
- White Paper
- Latest Press Release
- Industry Association
- Paid Database
- Investor Presentations

Step 4 - Data Triangulation
Involves using different sources of information in order to increase the validity of a study
These sources are likely to be stakeholders in a program - participants, other researchers, program staff, other community members, and so on.
Then we put all data in single framework & apply various statistical tools to find out the dynamic on the market.
During the analysis stage, feedback from the stakeholder groups would be compared to determine areas of agreement as well as areas of divergence


