

Key Insights
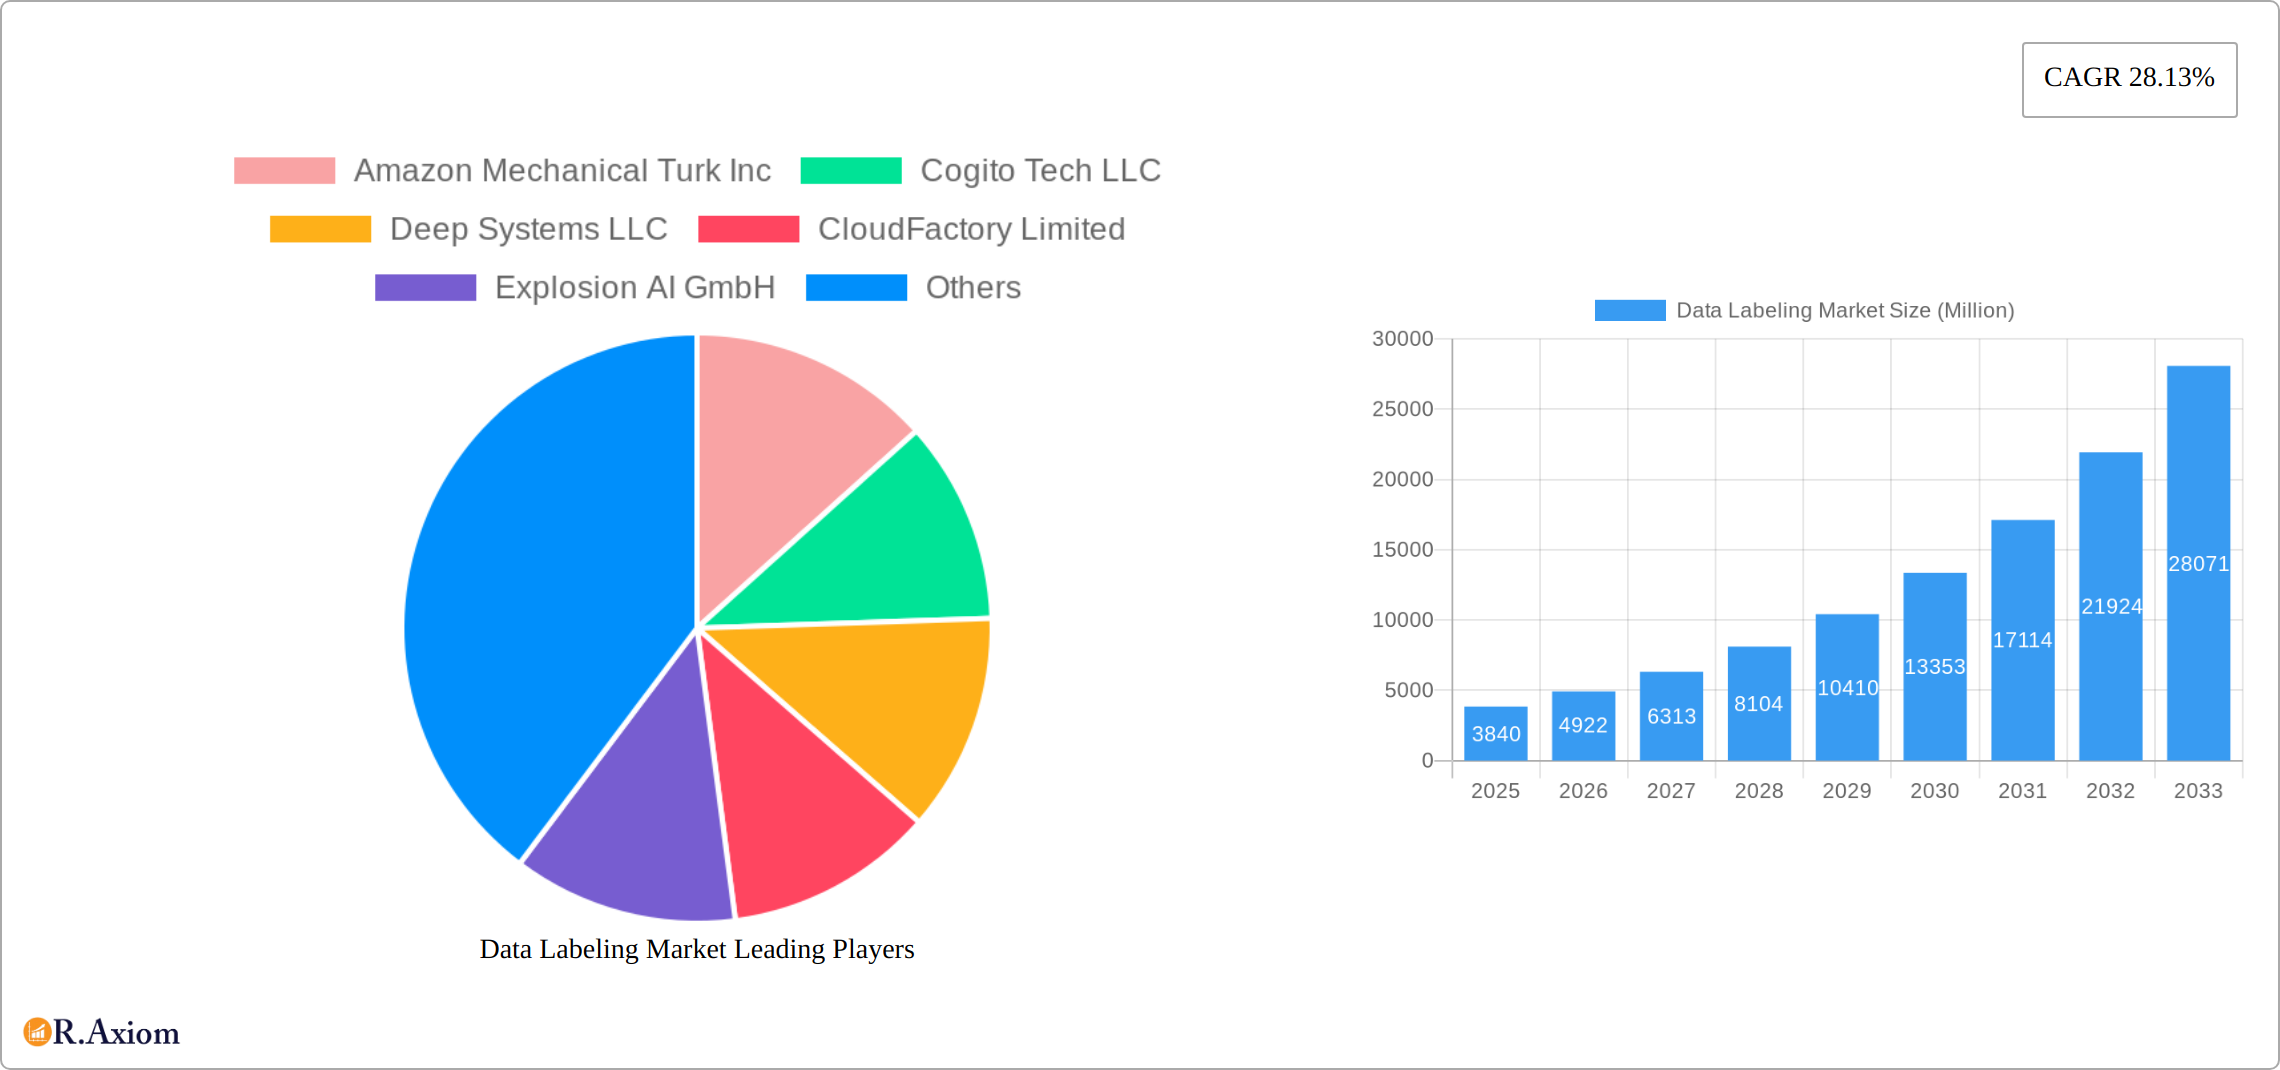
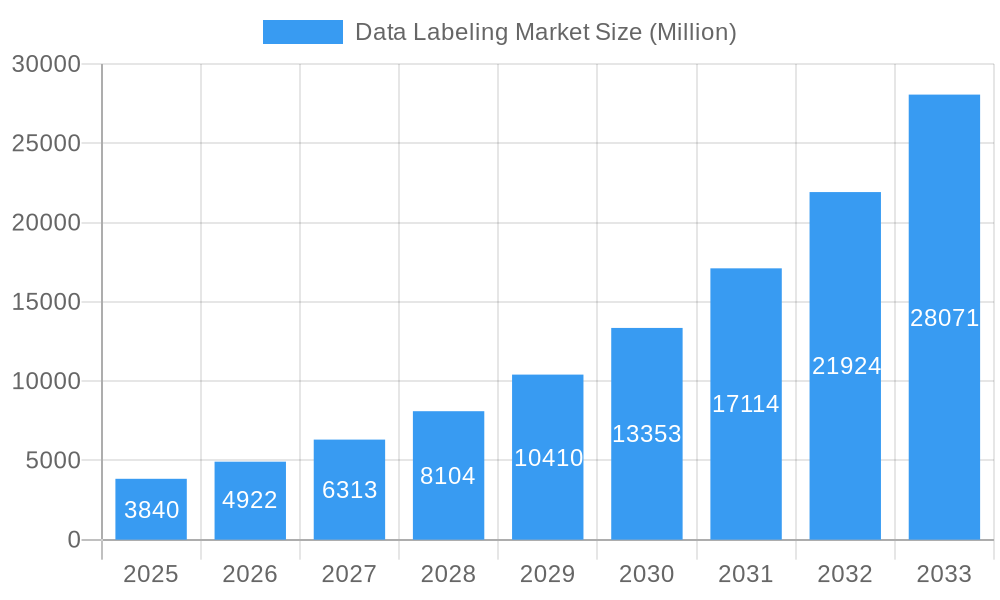
The data labeling market, currently valued at $3.84 billion in 2025, is experiencing robust growth, projected to expand significantly over the forecast period of 2025-2033. A compound annual growth rate (CAGR) of 28.13% indicates a substantial increase in demand driven by the burgeoning artificial intelligence (AI) and machine learning (ML) sectors. The rising need for high-quality training data to fuel the development and accuracy of AI algorithms is a primary driver. This includes the increasing adoption of deep learning models which require extensive labeled datasets for optimal performance across various applications such as computer vision, natural language processing, and autonomous vehicles. Furthermore, the expansion of big data analytics and the growing complexity of AI models are fueling this market's expansion. The market's growth isn't uniform across all segments; we can expect to see higher growth in specialized labeling services catering to niche AI applications, alongside increased competition amongst providers offering scalable, cost-effective solutions.
Data Labeling Market Market Size (In Billion)
Key players like Amazon Mechanical Turk, Appen Limited, and Labelbox Inc. are prominent in this competitive landscape, offering diverse services ranging from image annotation and text labeling to more complex data augmentation techniques. However, the market is also witnessing the emergence of smaller, specialized firms focusing on specific niches within data labeling. Geographic distribution is expected to be heavily weighted towards regions with established technology hubs and strong AI research capabilities, although growth is anticipated in developing economies as well, driven by increasing adoption of AI across various sectors like healthcare and finance. The restraining factors may include issues with data quality, security concerns, and the high cost of highly specialized labeling tasks. The ongoing evolution of AI and ML technologies will necessitate further innovation in data labeling techniques to meet future requirements.
Data Labeling Market Company Market Share
This in-depth report provides a comprehensive analysis of the Data Labeling Market, covering market size, growth drivers, key players, industry trends, and future outlook from 2019 to 2033. The report leverages extensive market research and incorporates recent industry developments to provide actionable insights for stakeholders. The study period spans 2019-2033, with 2025 as the base and estimated year. The forecast period is 2025-2033, and the historical period covers 2019-2024.
Data Labeling Market Concentration & Innovation
The Data Labeling market exhibits a moderately concentrated landscape with several major players and numerous smaller niche players. Market share is dynamic, with established players like Appen Limited and Labelbox Inc. holding significant portions, while smaller, specialized firms compete intensely. Innovation is driven by advancements in Artificial Intelligence (AI), particularly in machine learning and deep learning, which constantly increase the demand for high-quality labeled data. The market is also influenced by evolving regulatory frameworks surrounding data privacy and security, impacting data handling practices and vendor selection. Product substitutes include automated labeling tools and synthetic data generation techniques; however, human-in-the-loop approaches remain crucial for accuracy. End-user trends favor scalable, cost-effective, and secure solutions, driving demand for cloud-based data labeling platforms and automation technologies. M&A activity within the sector is prevalent, with larger companies acquiring smaller specialized firms to expand capabilities and market share. For instance, a hypothetical deal valued at USD xx Million could significantly shift market dynamics in 2026. This could potentially increase the market concentration further.
Data Labeling Market Industry Trends & Insights
The Data Labeling market is experiencing robust growth, fueled by the exponential rise of artificial intelligence (AI) and machine learning (ML) across diverse sectors. This expansion is projected to continue at a significant Compound Annual Growth Rate (CAGR) from 2025 to 2033, reaching a substantial market size of [Insert Updated USD Value] Million by 2033. This growth trajectory is driven by several key factors: the ever-increasing volume of data generated by the Internet of Things (IoT) devices, the widespread adoption of cloud computing, and the critical need for high-quality, accurately labeled data to train increasingly sophisticated AI models. Technological advancements, such as transfer learning and semi-supervised learning techniques, are playing a vital role in streamlining the data labeling process, enhancing efficiency, and reducing costs. However, challenges remain, including mitigating data bias, ensuring rigorous quality control, and addressing the persistent need for highly skilled professionals. While developed regions, particularly North America, currently lead in market penetration due to early adoption and significant investments in AI, developing economies demonstrate promising growth potential, presenting exciting opportunities for expansion.
Dominant Markets & Segments in Data Labeling Market
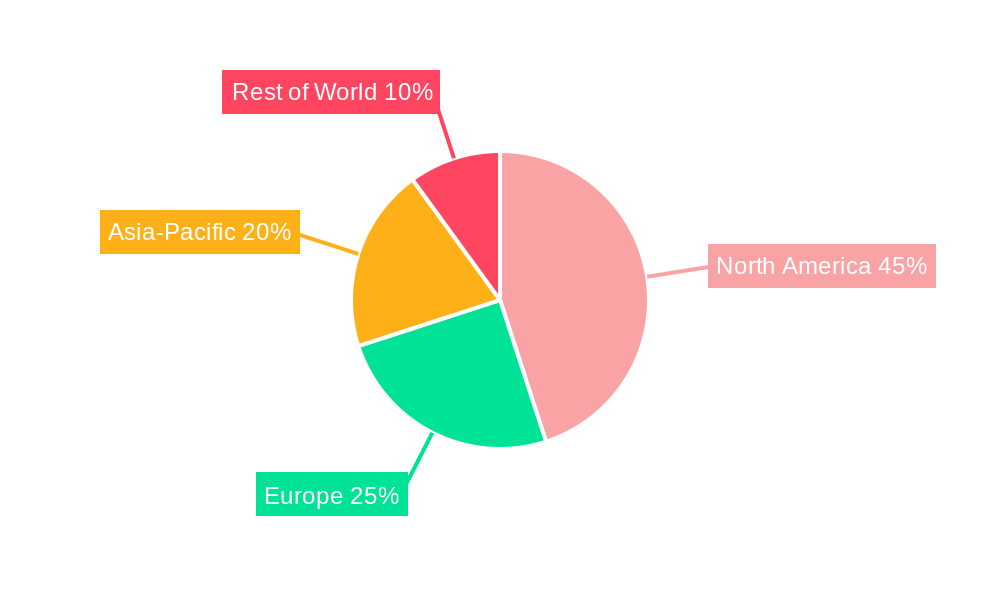
North America currently holds a dominant position in the Data Labeling market, driven by a robust technology sector, substantial venture capital investments in AI, and the widespread adoption of AI-driven solutions across various industries. This leadership is further solidified by the presence of major technology companies, significant government funding for AI initiatives, a large pool of skilled professionals, advanced infrastructure, and readily accessible capital.
- Key Drivers in North America:
- Significant investment in AI research and development.
- High concentration of technology companies and innovative startups.
- Well-established and scalable cloud infrastructure.
- Stringent data privacy regulations driving demand for secure and compliant labeling services.
- Increased demand across diverse sectors including healthcare, finance, and automotive.
While North America maintains its leading position, the Asia-Pacific region is poised for substantial growth in the coming years, propelled by rapid expansion in its technology sector and the increasing adoption of AI applications across various sectors. This growth is further fueled by a burgeoning pool of skilled workers and increasing government support for AI initiatives.
Data Labeling Market Product Developments
Recent product innovations focus on enhancing automation, improving accuracy, and expanding data types handled. New platforms leverage advanced machine learning techniques, including LLMs, to automate data cleaning, labeling, and enrichment processes. This results in improved efficiency and reduced costs for enterprises. The competitive advantage lies in offering faster, more accurate, and cost-effective data labeling solutions catering to diverse data types (images, videos, text, sensor data) and industry needs (autonomous vehicles, healthcare, finance). The focus on integrating human-in-the-loop approaches with automated tools ensures high data quality.
Report Scope & Segmentation Analysis
This report segments the Data Labeling market based on several key criteria:
By Data Type: Image, Video, Text, Audio, Sensor Data. Growth projections vary significantly across data types, with image and video data labeling maintaining leading positions due to the prevalence of computer vision applications.
By Service Type: Automated, Semi-automated, Human-powered. The market is transitioning towards automation, but human-in-the-loop solutions will continue to be relevant due to the need for handling complex and nuanced data.
By Industry: Automotive, Healthcare, Finance, Retail, Media and Entertainment. Each industry presents unique data labeling challenges and opportunities, influencing service requirements.
By Deployment: Cloud, On-premises. Cloud-based deployment is gaining traction due to scalability, flexibility, and cost-effectiveness.
Key Drivers of Data Labeling Market Growth
The Data Labeling market is propelled by several key factors:
- Exponential growth in data generation: The proliferation of IoT devices, social media, and other data sources generates massive volumes of unstructured data requiring labeling for AI model training.
- Increasing demand for AI applications: The widespread adoption of AI across industries fuels the need for high-quality labeled datasets.
- Advancements in machine learning techniques: Improved algorithms and deep learning models demand more sophisticated and labeled datasets for effective training.
- Government funding and initiatives: Government investments in AI research and development are significantly driving market growth.
Challenges in the Data Labeling Market Sector
The Data Labeling market faces several significant challenges that impact its growth and evolution:
- Data Bias and Quality Control: Ensuring the accuracy and unbiased nature of labeled datasets is paramount to prevent the development of flawed and unreliable AI models. Addressing inherent biases and implementing robust quality control measures are crucial.
- Data Privacy and Security Concerns: Handling sensitive data requires stringent security protocols and compliance with relevant data privacy regulations (e.g., GDPR, CCPA) to protect sensitive information.
- High Costs and Labor-Intensive Processes: Traditional data labeling methods can be costly and time-consuming, particularly for complex datasets. This necessitates the exploration of more efficient and cost-effective solutions.
- Shortage of Skilled Professionals: The market faces a persistent challenge in finding and retaining experienced data labelers with the necessary domain expertise. Addressing this skills gap is crucial for sustainable growth.
Emerging Opportunities in Data Labeling Market
Despite the challenges, the Data Labeling market presents several promising emerging opportunities:
- Synthetic Data Generation: The creation and utilization of synthetic data offers a powerful solution to alleviate data scarcity issues, address privacy concerns, and enhance data augmentation strategies.
- Automated Data Labeling Techniques: Continued advancements in AI and ML are driving the development of automated data labeling techniques, promising to significantly improve efficiency and reduce costs.
- New Data Types and Applications: The emergence of novel data types, such as 3D point cloud data, expands the scope of data labeling into new areas, particularly in applications such as autonomous driving and robotics.
- Expansion into Developing Markets: The growing adoption of AI in developing economies represents a significant untapped market potential, offering substantial growth opportunities for data labeling providers.
- Specialized Data Labeling Solutions: Demand for specialized labeling services tailored to specific industries and data types is increasing, creating opportunities for niche players.
Leading Players in the Data Labeling Market Market
- Amazon Mechanical Turk Inc
- Cogito Tech LLC
- Deep Systems LLC
- CloudFactory Limited
- Explosion AI GmbH
- Alegion
- Heex Technologies
- Clickworker GmbH
- Appen Limited
- edgecase ai
- Labelbox Inc
- List Not Exhaustive
Key Developments in Data Labeling Market Industry
October 2023: Refuel.ai launched Refuel Cloud, an LLM-powered platform automating data labeling. This significantly impacts the market by increasing efficiency and reducing reliance on manual labor.
September 2024: The NGA's USD 700 Million investment in AI data labeling services over five years highlights the growing importance of this sector for government and defense applications. This will boost demand for specialized data labeling capabilities, particularly in geospatial data analysis.
Strategic Outlook for Data Labeling Market Market
The Data Labeling market is poised for continued strong growth, driven by the increasing adoption of AI across industries. Future opportunities lie in leveraging advanced automation techniques, addressing data bias challenges, and expanding into new data types and application areas. The market's strategic outlook remains positive, with ongoing innovation and significant investment shaping the future landscape. The market is expected to evolve towards more integrated, efficient, and secure solutions, catering to the growing needs of businesses and governments alike.
Data Labeling Market Segmentation
-
1. Sourcing Type
- 1.1. In-house
- 1.2. Outsourced
-
2. Type
- 2.1. Text
- 2.2. Image
- 2.3. Audio
-
3. Labeling Type
- 3.1. Manual
- 3.2. Automatic
- 3.3. Semi-supervised
-
4. End-user Industry
- 4.1. Healthcare
- 4.2. Automotive
- 4.3. Industrial
- 4.4. IT
- 4.5. Financial Services
- 4.6. Retail
- 4.7. Others
Data Labeling Market Segmentation By Geography
- 1. North America
- 2. Europe
- 3. Asia
- 4. Australia and New Zealand
- 5. Middle East and Africa
- 6. Latin America
Data Labeling Market Regional Market Share
Geographic Coverage of Data Labeling Market
Data Labeling Market REPORT HIGHLIGHTS
| Aspects | Details |
|---|---|
| Study Period | 2020-2034 |
| Base Year | 2025 |
| Estimated Year | 2026 |
| Forecast Period | 2026-2034 |
| Historical Period | 2020-2025 |
| Growth Rate | CAGR of 28.13% from 2020-2034 |
| Segmentation |
|
Table of Contents
- 1. Introduction
- 1.1. Research Scope
- 1.2. Market Segmentation
- 1.3. Research Objective
- 1.4. Definitions and Assumptions
- 2. Executive Summary
- 2.1. Market Snapshot
- 3. Market Dynamics
- 3.1. Market Drivers
- 3.2. Market Restrains
- 3.3. Market Trends
- 3.4. Market Opportunities
- 4. Market Factor Analysis
- 4.1. Porters Five Forces
- 4.1.1. Bargaining Power of Suppliers
- 4.1.2. Bargaining Power of Buyers
- 4.1.3. Threat of New Entrants
- 4.1.4. Threat of Substitutes
- 4.1.5. Competitive Rivalry
- 4.2. PESTEL analysis
- 4.3. BCG Analysis
- 4.3.1. Stars (High Growth, High Market Share)
- 4.3.2. Cash Cows (Low Growth, High Market Share)
- 4.3.3. Question Mark (High Growth, Low Market Share)
- 4.3.4. Dogs (Low Growth, Low Market Share)
- 4.4. Ansoff Matrix Analysis
- 4.5. Supply Chain Analysis
- 4.6. Regulatory Landscape
- 4.7. Current Market Potential and Opportunity Assessment (TAM–SAM–SOM Framework)
- 4.8. RAX Analyst Note
- 4.1. Porters Five Forces
- 5. Market Analysis, Insights and Forecast 2021-2033
- 5.1. Market Analysis, Insights and Forecast - by Sourcing Type
- 5.1.1. In-house
- 5.1.2. Outsourced
- 5.2. Market Analysis, Insights and Forecast - by Type
- 5.2.1. Text
- 5.2.2. Image
- 5.2.3. Audio
- 5.3. Market Analysis, Insights and Forecast - by Labeling Type
- 5.3.1. Manual
- 5.3.2. Automatic
- 5.3.3. Semi-supervised
- 5.4. Market Analysis, Insights and Forecast - by End-user Industry
- 5.4.1. Healthcare
- 5.4.2. Automotive
- 5.4.3. Industrial
- 5.4.4. IT
- 5.4.5. Financial Services
- 5.4.6. Retail
- 5.4.7. Others
- 5.5. Market Analysis, Insights and Forecast - by Region
- 5.5.1. North America
- 5.5.2. Europe
- 5.5.3. Asia
- 5.5.4. Australia and New Zealand
- 5.5.5. Middle East and Africa
- 5.5.6. Latin America
- 5.1. Market Analysis, Insights and Forecast - by Sourcing Type
- 6. Global Data Labeling Market Analysis, Insights and Forecast, 2021-2033
- 6.1. Market Analysis, Insights and Forecast - by Sourcing Type
- 6.1.1. In-house
- 6.1.2. Outsourced
- 6.2. Market Analysis, Insights and Forecast - by Type
- 6.2.1. Text
- 6.2.2. Image
- 6.2.3. Audio
- 6.3. Market Analysis, Insights and Forecast - by Labeling Type
- 6.3.1. Manual
- 6.3.2. Automatic
- 6.3.3. Semi-supervised
- 6.4. Market Analysis, Insights and Forecast - by End-user Industry
- 6.4.1. Healthcare
- 6.4.2. Automotive
- 6.4.3. Industrial
- 6.4.4. IT
- 6.4.5. Financial Services
- 6.4.6. Retail
- 6.4.7. Others
- 6.1. Market Analysis, Insights and Forecast - by Sourcing Type
- 7. North America Data Labeling Market Analysis, Insights and Forecast, 2020-2032
- 7.1. Market Analysis, Insights and Forecast - by Sourcing Type
- 7.1.1. In-house
- 7.1.2. Outsourced
- 7.2. Market Analysis, Insights and Forecast - by Type
- 7.2.1. Text
- 7.2.2. Image
- 7.2.3. Audio
- 7.3. Market Analysis, Insights and Forecast - by Labeling Type
- 7.3.1. Manual
- 7.3.2. Automatic
- 7.3.3. Semi-supervised
- 7.4. Market Analysis, Insights and Forecast - by End-user Industry
- 7.4.1. Healthcare
- 7.4.2. Automotive
- 7.4.3. Industrial
- 7.4.4. IT
- 7.4.5. Financial Services
- 7.4.6. Retail
- 7.4.7. Others
- 7.1. Market Analysis, Insights and Forecast - by Sourcing Type
- 8. Europe Data Labeling Market Analysis, Insights and Forecast, 2020-2032
- 8.1. Market Analysis, Insights and Forecast - by Sourcing Type
- 8.1.1. In-house
- 8.1.2. Outsourced
- 8.2. Market Analysis, Insights and Forecast - by Type
- 8.2.1. Text
- 8.2.2. Image
- 8.2.3. Audio
- 8.3. Market Analysis, Insights and Forecast - by Labeling Type
- 8.3.1. Manual
- 8.3.2. Automatic
- 8.3.3. Semi-supervised
- 8.4. Market Analysis, Insights and Forecast - by End-user Industry
- 8.4.1. Healthcare
- 8.4.2. Automotive
- 8.4.3. Industrial
- 8.4.4. IT
- 8.4.5. Financial Services
- 8.4.6. Retail
- 8.4.7. Others
- 8.1. Market Analysis, Insights and Forecast - by Sourcing Type
- 9. Asia Data Labeling Market Analysis, Insights and Forecast, 2020-2032
- 9.1. Market Analysis, Insights and Forecast - by Sourcing Type
- 9.1.1. In-house
- 9.1.2. Outsourced
- 9.2. Market Analysis, Insights and Forecast - by Type
- 9.2.1. Text
- 9.2.2. Image
- 9.2.3. Audio
- 9.3. Market Analysis, Insights and Forecast - by Labeling Type
- 9.3.1. Manual
- 9.3.2. Automatic
- 9.3.3. Semi-supervised
- 9.4. Market Analysis, Insights and Forecast - by End-user Industry
- 9.4.1. Healthcare
- 9.4.2. Automotive
- 9.4.3. Industrial
- 9.4.4. IT
- 9.4.5. Financial Services
- 9.4.6. Retail
- 9.4.7. Others
- 9.1. Market Analysis, Insights and Forecast - by Sourcing Type
- 10. Australia and New Zealand Data Labeling Market Analysis, Insights and Forecast, 2020-2032
- 10.1. Market Analysis, Insights and Forecast - by Sourcing Type
- 10.1.1. In-house
- 10.1.2. Outsourced
- 10.2. Market Analysis, Insights and Forecast - by Type
- 10.2.1. Text
- 10.2.2. Image
- 10.2.3. Audio
- 10.3. Market Analysis, Insights and Forecast - by Labeling Type
- 10.3.1. Manual
- 10.3.2. Automatic
- 10.3.3. Semi-supervised
- 10.4. Market Analysis, Insights and Forecast - by End-user Industry
- 10.4.1. Healthcare
- 10.4.2. Automotive
- 10.4.3. Industrial
- 10.4.4. IT
- 10.4.5. Financial Services
- 10.4.6. Retail
- 10.4.7. Others
- 10.1. Market Analysis, Insights and Forecast - by Sourcing Type
- 11. Middle East and Africa Data Labeling Market Analysis, Insights and Forecast, 2020-2032
- 11.1. Market Analysis, Insights and Forecast - by Sourcing Type
- 11.1.1. In-house
- 11.1.2. Outsourced
- 11.2. Market Analysis, Insights and Forecast - by Type
- 11.2.1. Text
- 11.2.2. Image
- 11.2.3. Audio
- 11.3. Market Analysis, Insights and Forecast - by Labeling Type
- 11.3.1. Manual
- 11.3.2. Automatic
- 11.3.3. Semi-supervised
- 11.4. Market Analysis, Insights and Forecast - by End-user Industry
- 11.4.1. Healthcare
- 11.4.2. Automotive
- 11.4.3. Industrial
- 11.4.4. IT
- 11.4.5. Financial Services
- 11.4.6. Retail
- 11.4.7. Others
- 11.1. Market Analysis, Insights and Forecast - by Sourcing Type
- 12. Latin America Data Labeling Market Analysis, Insights and Forecast, 2020-2032
- 12.1. Market Analysis, Insights and Forecast - by Sourcing Type
- 12.1.1. In-house
- 12.1.2. Outsourced
- 12.2. Market Analysis, Insights and Forecast - by Type
- 12.2.1. Text
- 12.2.2. Image
- 12.2.3. Audio
- 12.3. Market Analysis, Insights and Forecast - by Labeling Type
- 12.3.1. Manual
- 12.3.2. Automatic
- 12.3.3. Semi-supervised
- 12.4. Market Analysis, Insights and Forecast - by End-user Industry
- 12.4.1. Healthcare
- 12.4.2. Automotive
- 12.4.3. Industrial
- 12.4.4. IT
- 12.4.5. Financial Services
- 12.4.6. Retail
- 12.4.7. Others
- 12.1. Market Analysis, Insights and Forecast - by Sourcing Type
- 13. Competitive Analysis
- 13.1. Company Profiles
- 13.1.1 Amazon Mechanical Turk Inc
- 13.1.1.1. Company Overview
- 13.1.1.2. Products
- 13.1.1.3. Company Financials
- 13.1.1.4. SWOT Analysis
- 13.1.2 Cogito Tech LLC
- 13.1.2.1. Company Overview
- 13.1.2.2. Products
- 13.1.2.3. Company Financials
- 13.1.2.4. SWOT Analysis
- 13.1.3 Deep Systems LLC
- 13.1.3.1. Company Overview
- 13.1.3.2. Products
- 13.1.3.3. Company Financials
- 13.1.3.4. SWOT Analysis
- 13.1.4 CloudFactory Limited
- 13.1.4.1. Company Overview
- 13.1.4.2. Products
- 13.1.4.3. Company Financials
- 13.1.4.4. SWOT Analysis
- 13.1.5 Explosion AI GmbH
- 13.1.5.1. Company Overview
- 13.1.5.2. Products
- 13.1.5.3. Company Financials
- 13.1.5.4. SWOT Analysis
- 13.1.6 Alegion
- 13.1.6.1. Company Overview
- 13.1.6.2. Products
- 13.1.6.3. Company Financials
- 13.1.6.4. SWOT Analysis
- 13.1.7 Heex Technologies
- 13.1.7.1. Company Overview
- 13.1.7.2. Products
- 13.1.7.3. Company Financials
- 13.1.7.4. SWOT Analysis
- 13.1.8 Clickworker GmbH
- 13.1.8.1. Company Overview
- 13.1.8.2. Products
- 13.1.8.3. Company Financials
- 13.1.8.4. SWOT Analysis
- 13.1.9 Appen Limited
- 13.1.9.1. Company Overview
- 13.1.9.2. Products
- 13.1.9.3. Company Financials
- 13.1.9.4. SWOT Analysis
- 13.1.10 edgecase ai
- 13.1.10.1. Company Overview
- 13.1.10.2. Products
- 13.1.10.3. Company Financials
- 13.1.10.4. SWOT Analysis
- 13.1.11 Labelbox Inc*List Not Exhaustive
- 13.1.11.1. Company Overview
- 13.1.11.2. Products
- 13.1.11.3. Company Financials
- 13.1.11.4. SWOT Analysis
- 13.1.1 Amazon Mechanical Turk Inc
- 13.2. Market Entropy
- 13.2.1 Company's Key Areas Served
- 13.2.2 Recent Developments
- 13.3. Company Market Share Analysis 2025
- 13.3.1 Top 5 Companies Market Share Analysis
- 13.3.2 Top 3 Companies Market Share Analysis
- 13.4. List of Potential Customers
- 14. Research Methodology
List of Figures
- Figure 1: Global Data Labeling Market Revenue Breakdown (Million, %) by Region 2025 & 2033
- Figure 2: Global Data Labeling Market Volume Breakdown (Billion, %) by Region 2025 & 2033
- Figure 3: North America Data Labeling Market Revenue (Million), by Sourcing Type 2025 & 2033
- Figure 4: North America Data Labeling Market Volume (Billion), by Sourcing Type 2025 & 2033
- Figure 5: North America Data Labeling Market Revenue Share (%), by Sourcing Type 2025 & 2033
- Figure 6: North America Data Labeling Market Volume Share (%), by Sourcing Type 2025 & 2033
- Figure 7: North America Data Labeling Market Revenue (Million), by Type 2025 & 2033
- Figure 8: North America Data Labeling Market Volume (Billion), by Type 2025 & 2033
- Figure 9: North America Data Labeling Market Revenue Share (%), by Type 2025 & 2033
- Figure 10: North America Data Labeling Market Volume Share (%), by Type 2025 & 2033
- Figure 11: North America Data Labeling Market Revenue (Million), by Labeling Type 2025 & 2033
- Figure 12: North America Data Labeling Market Volume (Billion), by Labeling Type 2025 & 2033
- Figure 13: North America Data Labeling Market Revenue Share (%), by Labeling Type 2025 & 2033
- Figure 14: North America Data Labeling Market Volume Share (%), by Labeling Type 2025 & 2033
- Figure 15: North America Data Labeling Market Revenue (Million), by End-user Industry 2025 & 2033
- Figure 16: North America Data Labeling Market Volume (Billion), by End-user Industry 2025 & 2033
- Figure 17: North America Data Labeling Market Revenue Share (%), by End-user Industry 2025 & 2033
- Figure 18: North America Data Labeling Market Volume Share (%), by End-user Industry 2025 & 2033
- Figure 19: North America Data Labeling Market Revenue (Million), by Country 2025 & 2033
- Figure 20: North America Data Labeling Market Volume (Billion), by Country 2025 & 2033
- Figure 21: North America Data Labeling Market Revenue Share (%), by Country 2025 & 2033
- Figure 22: North America Data Labeling Market Volume Share (%), by Country 2025 & 2033
- Figure 23: Europe Data Labeling Market Revenue (Million), by Sourcing Type 2025 & 2033
- Figure 24: Europe Data Labeling Market Volume (Billion), by Sourcing Type 2025 & 2033
- Figure 25: Europe Data Labeling Market Revenue Share (%), by Sourcing Type 2025 & 2033
- Figure 26: Europe Data Labeling Market Volume Share (%), by Sourcing Type 2025 & 2033
- Figure 27: Europe Data Labeling Market Revenue (Million), by Type 2025 & 2033
- Figure 28: Europe Data Labeling Market Volume (Billion), by Type 2025 & 2033
- Figure 29: Europe Data Labeling Market Revenue Share (%), by Type 2025 & 2033
- Figure 30: Europe Data Labeling Market Volume Share (%), by Type 2025 & 2033
- Figure 31: Europe Data Labeling Market Revenue (Million), by Labeling Type 2025 & 2033
- Figure 32: Europe Data Labeling Market Volume (Billion), by Labeling Type 2025 & 2033
- Figure 33: Europe Data Labeling Market Revenue Share (%), by Labeling Type 2025 & 2033
- Figure 34: Europe Data Labeling Market Volume Share (%), by Labeling Type 2025 & 2033
- Figure 35: Europe Data Labeling Market Revenue (Million), by End-user Industry 2025 & 2033
- Figure 36: Europe Data Labeling Market Volume (Billion), by End-user Industry 2025 & 2033
- Figure 37: Europe Data Labeling Market Revenue Share (%), by End-user Industry 2025 & 2033
- Figure 38: Europe Data Labeling Market Volume Share (%), by End-user Industry 2025 & 2033
- Figure 39: Europe Data Labeling Market Revenue (Million), by Country 2025 & 2033
- Figure 40: Europe Data Labeling Market Volume (Billion), by Country 2025 & 2033
- Figure 41: Europe Data Labeling Market Revenue Share (%), by Country 2025 & 2033
- Figure 42: Europe Data Labeling Market Volume Share (%), by Country 2025 & 2033
- Figure 43: Asia Data Labeling Market Revenue (Million), by Sourcing Type 2025 & 2033
- Figure 44: Asia Data Labeling Market Volume (Billion), by Sourcing Type 2025 & 2033
- Figure 45: Asia Data Labeling Market Revenue Share (%), by Sourcing Type 2025 & 2033
- Figure 46: Asia Data Labeling Market Volume Share (%), by Sourcing Type 2025 & 2033
- Figure 47: Asia Data Labeling Market Revenue (Million), by Type 2025 & 2033
- Figure 48: Asia Data Labeling Market Volume (Billion), by Type 2025 & 2033
- Figure 49: Asia Data Labeling Market Revenue Share (%), by Type 2025 & 2033
- Figure 50: Asia Data Labeling Market Volume Share (%), by Type 2025 & 2033
- Figure 51: Asia Data Labeling Market Revenue (Million), by Labeling Type 2025 & 2033
- Figure 52: Asia Data Labeling Market Volume (Billion), by Labeling Type 2025 & 2033
- Figure 53: Asia Data Labeling Market Revenue Share (%), by Labeling Type 2025 & 2033
- Figure 54: Asia Data Labeling Market Volume Share (%), by Labeling Type 2025 & 2033
- Figure 55: Asia Data Labeling Market Revenue (Million), by End-user Industry 2025 & 2033
- Figure 56: Asia Data Labeling Market Volume (Billion), by End-user Industry 2025 & 2033
- Figure 57: Asia Data Labeling Market Revenue Share (%), by End-user Industry 2025 & 2033
- Figure 58: Asia Data Labeling Market Volume Share (%), by End-user Industry 2025 & 2033
- Figure 59: Asia Data Labeling Market Revenue (Million), by Country 2025 & 2033
- Figure 60: Asia Data Labeling Market Volume (Billion), by Country 2025 & 2033
- Figure 61: Asia Data Labeling Market Revenue Share (%), by Country 2025 & 2033
- Figure 62: Asia Data Labeling Market Volume Share (%), by Country 2025 & 2033
- Figure 63: Australia and New Zealand Data Labeling Market Revenue (Million), by Sourcing Type 2025 & 2033
- Figure 64: Australia and New Zealand Data Labeling Market Volume (Billion), by Sourcing Type 2025 & 2033
- Figure 65: Australia and New Zealand Data Labeling Market Revenue Share (%), by Sourcing Type 2025 & 2033
- Figure 66: Australia and New Zealand Data Labeling Market Volume Share (%), by Sourcing Type 2025 & 2033
- Figure 67: Australia and New Zealand Data Labeling Market Revenue (Million), by Type 2025 & 2033
- Figure 68: Australia and New Zealand Data Labeling Market Volume (Billion), by Type 2025 & 2033
- Figure 69: Australia and New Zealand Data Labeling Market Revenue Share (%), by Type 2025 & 2033
- Figure 70: Australia and New Zealand Data Labeling Market Volume Share (%), by Type 2025 & 2033
- Figure 71: Australia and New Zealand Data Labeling Market Revenue (Million), by Labeling Type 2025 & 2033
- Figure 72: Australia and New Zealand Data Labeling Market Volume (Billion), by Labeling Type 2025 & 2033
- Figure 73: Australia and New Zealand Data Labeling Market Revenue Share (%), by Labeling Type 2025 & 2033
- Figure 74: Australia and New Zealand Data Labeling Market Volume Share (%), by Labeling Type 2025 & 2033
- Figure 75: Australia and New Zealand Data Labeling Market Revenue (Million), by End-user Industry 2025 & 2033
- Figure 76: Australia and New Zealand Data Labeling Market Volume (Billion), by End-user Industry 2025 & 2033
- Figure 77: Australia and New Zealand Data Labeling Market Revenue Share (%), by End-user Industry 2025 & 2033
- Figure 78: Australia and New Zealand Data Labeling Market Volume Share (%), by End-user Industry 2025 & 2033
- Figure 79: Australia and New Zealand Data Labeling Market Revenue (Million), by Country 2025 & 2033
- Figure 80: Australia and New Zealand Data Labeling Market Volume (Billion), by Country 2025 & 2033
- Figure 81: Australia and New Zealand Data Labeling Market Revenue Share (%), by Country 2025 & 2033
- Figure 82: Australia and New Zealand Data Labeling Market Volume Share (%), by Country 2025 & 2033
- Figure 83: Middle East and Africa Data Labeling Market Revenue (Million), by Sourcing Type 2025 & 2033
- Figure 84: Middle East and Africa Data Labeling Market Volume (Billion), by Sourcing Type 2025 & 2033
- Figure 85: Middle East and Africa Data Labeling Market Revenue Share (%), by Sourcing Type 2025 & 2033
- Figure 86: Middle East and Africa Data Labeling Market Volume Share (%), by Sourcing Type 2025 & 2033
- Figure 87: Middle East and Africa Data Labeling Market Revenue (Million), by Type 2025 & 2033
- Figure 88: Middle East and Africa Data Labeling Market Volume (Billion), by Type 2025 & 2033
- Figure 89: Middle East and Africa Data Labeling Market Revenue Share (%), by Type 2025 & 2033
- Figure 90: Middle East and Africa Data Labeling Market Volume Share (%), by Type 2025 & 2033
- Figure 91: Middle East and Africa Data Labeling Market Revenue (Million), by Labeling Type 2025 & 2033
- Figure 92: Middle East and Africa Data Labeling Market Volume (Billion), by Labeling Type 2025 & 2033
- Figure 93: Middle East and Africa Data Labeling Market Revenue Share (%), by Labeling Type 2025 & 2033
- Figure 94: Middle East and Africa Data Labeling Market Volume Share (%), by Labeling Type 2025 & 2033
- Figure 95: Middle East and Africa Data Labeling Market Revenue (Million), by End-user Industry 2025 & 2033
- Figure 96: Middle East and Africa Data Labeling Market Volume (Billion), by End-user Industry 2025 & 2033
- Figure 97: Middle East and Africa Data Labeling Market Revenue Share (%), by End-user Industry 2025 & 2033
- Figure 98: Middle East and Africa Data Labeling Market Volume Share (%), by End-user Industry 2025 & 2033
- Figure 99: Middle East and Africa Data Labeling Market Revenue (Million), by Country 2025 & 2033
- Figure 100: Middle East and Africa Data Labeling Market Volume (Billion), by Country 2025 & 2033
- Figure 101: Middle East and Africa Data Labeling Market Revenue Share (%), by Country 2025 & 2033
- Figure 102: Middle East and Africa Data Labeling Market Volume Share (%), by Country 2025 & 2033
- Figure 103: Latin America Data Labeling Market Revenue (Million), by Sourcing Type 2025 & 2033
- Figure 104: Latin America Data Labeling Market Volume (Billion), by Sourcing Type 2025 & 2033
- Figure 105: Latin America Data Labeling Market Revenue Share (%), by Sourcing Type 2025 & 2033
- Figure 106: Latin America Data Labeling Market Volume Share (%), by Sourcing Type 2025 & 2033
- Figure 107: Latin America Data Labeling Market Revenue (Million), by Type 2025 & 2033
- Figure 108: Latin America Data Labeling Market Volume (Billion), by Type 2025 & 2033
- Figure 109: Latin America Data Labeling Market Revenue Share (%), by Type 2025 & 2033
- Figure 110: Latin America Data Labeling Market Volume Share (%), by Type 2025 & 2033
- Figure 111: Latin America Data Labeling Market Revenue (Million), by Labeling Type 2025 & 2033
- Figure 112: Latin America Data Labeling Market Volume (Billion), by Labeling Type 2025 & 2033
- Figure 113: Latin America Data Labeling Market Revenue Share (%), by Labeling Type 2025 & 2033
- Figure 114: Latin America Data Labeling Market Volume Share (%), by Labeling Type 2025 & 2033
- Figure 115: Latin America Data Labeling Market Revenue (Million), by End-user Industry 2025 & 2033
- Figure 116: Latin America Data Labeling Market Volume (Billion), by End-user Industry 2025 & 2033
- Figure 117: Latin America Data Labeling Market Revenue Share (%), by End-user Industry 2025 & 2033
- Figure 118: Latin America Data Labeling Market Volume Share (%), by End-user Industry 2025 & 2033
- Figure 119: Latin America Data Labeling Market Revenue (Million), by Country 2025 & 2033
- Figure 120: Latin America Data Labeling Market Volume (Billion), by Country 2025 & 2033
- Figure 121: Latin America Data Labeling Market Revenue Share (%), by Country 2025 & 2033
- Figure 122: Latin America Data Labeling Market Volume Share (%), by Country 2025 & 2033
List of Tables
- Table 1: Global Data Labeling Market Revenue Million Forecast, by Sourcing Type 2020 & 2033
- Table 2: Global Data Labeling Market Volume Billion Forecast, by Sourcing Type 2020 & 2033
- Table 3: Global Data Labeling Market Revenue Million Forecast, by Type 2020 & 2033
- Table 4: Global Data Labeling Market Volume Billion Forecast, by Type 2020 & 2033
- Table 5: Global Data Labeling Market Revenue Million Forecast, by Labeling Type 2020 & 2033
- Table 6: Global Data Labeling Market Volume Billion Forecast, by Labeling Type 2020 & 2033
- Table 7: Global Data Labeling Market Revenue Million Forecast, by End-user Industry 2020 & 2033
- Table 8: Global Data Labeling Market Volume Billion Forecast, by End-user Industry 2020 & 2033
- Table 9: Global Data Labeling Market Revenue Million Forecast, by Region 2020 & 2033
- Table 10: Global Data Labeling Market Volume Billion Forecast, by Region 2020 & 2033
- Table 11: Global Data Labeling Market Revenue Million Forecast, by Sourcing Type 2020 & 2033
- Table 12: Global Data Labeling Market Volume Billion Forecast, by Sourcing Type 2020 & 2033
- Table 13: Global Data Labeling Market Revenue Million Forecast, by Type 2020 & 2033
- Table 14: Global Data Labeling Market Volume Billion Forecast, by Type 2020 & 2033
- Table 15: Global Data Labeling Market Revenue Million Forecast, by Labeling Type 2020 & 2033
- Table 16: Global Data Labeling Market Volume Billion Forecast, by Labeling Type 2020 & 2033
- Table 17: Global Data Labeling Market Revenue Million Forecast, by End-user Industry 2020 & 2033
- Table 18: Global Data Labeling Market Volume Billion Forecast, by End-user Industry 2020 & 2033
- Table 19: Global Data Labeling Market Revenue Million Forecast, by Country 2020 & 2033
- Table 20: Global Data Labeling Market Volume Billion Forecast, by Country 2020 & 2033
- Table 21: Global Data Labeling Market Revenue Million Forecast, by Sourcing Type 2020 & 2033
- Table 22: Global Data Labeling Market Volume Billion Forecast, by Sourcing Type 2020 & 2033
- Table 23: Global Data Labeling Market Revenue Million Forecast, by Type 2020 & 2033
- Table 24: Global Data Labeling Market Volume Billion Forecast, by Type 2020 & 2033
- Table 25: Global Data Labeling Market Revenue Million Forecast, by Labeling Type 2020 & 2033
- Table 26: Global Data Labeling Market Volume Billion Forecast, by Labeling Type 2020 & 2033
- Table 27: Global Data Labeling Market Revenue Million Forecast, by End-user Industry 2020 & 2033
- Table 28: Global Data Labeling Market Volume Billion Forecast, by End-user Industry 2020 & 2033
- Table 29: Global Data Labeling Market Revenue Million Forecast, by Country 2020 & 2033
- Table 30: Global Data Labeling Market Volume Billion Forecast, by Country 2020 & 2033
- Table 31: Global Data Labeling Market Revenue Million Forecast, by Sourcing Type 2020 & 2033
- Table 32: Global Data Labeling Market Volume Billion Forecast, by Sourcing Type 2020 & 2033
- Table 33: Global Data Labeling Market Revenue Million Forecast, by Type 2020 & 2033
- Table 34: Global Data Labeling Market Volume Billion Forecast, by Type 2020 & 2033
- Table 35: Global Data Labeling Market Revenue Million Forecast, by Labeling Type 2020 & 2033
- Table 36: Global Data Labeling Market Volume Billion Forecast, by Labeling Type 2020 & 2033
- Table 37: Global Data Labeling Market Revenue Million Forecast, by End-user Industry 2020 & 2033
- Table 38: Global Data Labeling Market Volume Billion Forecast, by End-user Industry 2020 & 2033
- Table 39: Global Data Labeling Market Revenue Million Forecast, by Country 2020 & 2033
- Table 40: Global Data Labeling Market Volume Billion Forecast, by Country 2020 & 2033
- Table 41: Global Data Labeling Market Revenue Million Forecast, by Sourcing Type 2020 & 2033
- Table 42: Global Data Labeling Market Volume Billion Forecast, by Sourcing Type 2020 & 2033
- Table 43: Global Data Labeling Market Revenue Million Forecast, by Type 2020 & 2033
- Table 44: Global Data Labeling Market Volume Billion Forecast, by Type 2020 & 2033
- Table 45: Global Data Labeling Market Revenue Million Forecast, by Labeling Type 2020 & 2033
- Table 46: Global Data Labeling Market Volume Billion Forecast, by Labeling Type 2020 & 2033
- Table 47: Global Data Labeling Market Revenue Million Forecast, by End-user Industry 2020 & 2033
- Table 48: Global Data Labeling Market Volume Billion Forecast, by End-user Industry 2020 & 2033
- Table 49: Global Data Labeling Market Revenue Million Forecast, by Country 2020 & 2033
- Table 50: Global Data Labeling Market Volume Billion Forecast, by Country 2020 & 2033
- Table 51: Global Data Labeling Market Revenue Million Forecast, by Sourcing Type 2020 & 2033
- Table 52: Global Data Labeling Market Volume Billion Forecast, by Sourcing Type 2020 & 2033
- Table 53: Global Data Labeling Market Revenue Million Forecast, by Type 2020 & 2033
- Table 54: Global Data Labeling Market Volume Billion Forecast, by Type 2020 & 2033
- Table 55: Global Data Labeling Market Revenue Million Forecast, by Labeling Type 2020 & 2033
- Table 56: Global Data Labeling Market Volume Billion Forecast, by Labeling Type 2020 & 2033
- Table 57: Global Data Labeling Market Revenue Million Forecast, by End-user Industry 2020 & 2033
- Table 58: Global Data Labeling Market Volume Billion Forecast, by End-user Industry 2020 & 2033
- Table 59: Global Data Labeling Market Revenue Million Forecast, by Country 2020 & 2033
- Table 60: Global Data Labeling Market Volume Billion Forecast, by Country 2020 & 2033
- Table 61: Global Data Labeling Market Revenue Million Forecast, by Sourcing Type 2020 & 2033
- Table 62: Global Data Labeling Market Volume Billion Forecast, by Sourcing Type 2020 & 2033
- Table 63: Global Data Labeling Market Revenue Million Forecast, by Type 2020 & 2033
- Table 64: Global Data Labeling Market Volume Billion Forecast, by Type 2020 & 2033
- Table 65: Global Data Labeling Market Revenue Million Forecast, by Labeling Type 2020 & 2033
- Table 66: Global Data Labeling Market Volume Billion Forecast, by Labeling Type 2020 & 2033
- Table 67: Global Data Labeling Market Revenue Million Forecast, by End-user Industry 2020 & 2033
- Table 68: Global Data Labeling Market Volume Billion Forecast, by End-user Industry 2020 & 2033
- Table 69: Global Data Labeling Market Revenue Million Forecast, by Country 2020 & 2033
- Table 70: Global Data Labeling Market Volume Billion Forecast, by Country 2020 & 2033
Frequently Asked Questions
1. What is the projected Compound Annual Growth Rate (CAGR) of the Data Labeling Market?
The projected CAGR is approximately 28.13%.
2. Which companies are prominent players in the Data Labeling Market?
Key companies in the market include Amazon Mechanical Turk Inc, Cogito Tech LLC, Deep Systems LLC, CloudFactory Limited, Explosion AI GmbH, Alegion, Heex Technologies, Clickworker GmbH, Appen Limited, edgecase ai, Labelbox Inc*List Not Exhaustive.
3. What are the main segments of the Data Labeling Market?
The market segments include Sourcing Type, Type, Labeling Type, End-user Industry.
4. Can you provide details about the market size?
The market size is estimated to be USD 3.84 Million as of 2022.
5. What are some drivers contributing to market growth?
Rising Penetration of Connected Cars and Advances in Autonomous Driving Technology; Advances in Big Data Analytics based on AI and ML.
6. What are the notable trends driving market growth?
Healthcare is Expected to Witness Remarkable Growth.
7. Are there any restraints impacting market growth?
Rising Penetration of Connected Cars and Advances in Autonomous Driving Technology; Advances in Big Data Analytics based on AI and ML.
8. Can you provide examples of recent developments in the market?
September 2024: The National Geospatial-Intelligence Agency (NGA) is poised to invest heavily in artificial intelligence, earmarking up to USD 700 million for data labeling services over the next five years. This initiative aims to enhance NGA's machine-learning capabilities, particularly in analyzing satellite imagery and other geospatial data. The agency has opted for a multi-vendor indefinite-delivery/indefinite-quantity (IDIQ) contract, emphasizing the importance of annotating raw data be it images or videos—to render it understandable for machine learning models. For instance, when dealing with satellite imagery, the focus could be on labeling distinct entities such as buildings, roads, or patches of vegetation.October 2023: Refuel.ai unveiled a new platform, Refuel Cloud, and a specialized large language model (LLM) for data labeling. Refuel Cloud harnesses advanced LLMs, including its proprietary model, to automate data cleaning, labeling, and enrichment at scale, catering to diverse industry use cases. Recognizing that clean data underpins modern AI and data-centric software, Refuel Cloud addresses the historical challenge of human labor bottlenecks in data production. With Refuel Cloud, enterprises can swiftly generate the expansive, precise datasets they require in mere minutes, a task that traditionally spanned weeks.
9. What pricing options are available for accessing the report?
Pricing options include single-user, multi-user, and enterprise licenses priced at USD 4750, USD 5250, and USD 8750 respectively.
10. Is the market size provided in terms of value or volume?
The market size is provided in terms of value, measured in Million and volume, measured in Billion.
11. Are there any specific market keywords associated with the report?
Yes, the market keyword associated with the report is "Data Labeling Market," which aids in identifying and referencing the specific market segment covered.
12. How do I determine which pricing option suits my needs best?
The pricing options vary based on user requirements and access needs. Individual users may opt for single-user licenses, while businesses requiring broader access may choose multi-user or enterprise licenses for cost-effective access to the report.
13. Are there any additional resources or data provided in the Data Labeling Market report?
While the report offers comprehensive insights, it's advisable to review the specific contents or supplementary materials provided to ascertain if additional resources or data are available.
14. How can I stay updated on further developments or reports in the Data Labeling Market?
To stay informed about further developments, trends, and reports in the Data Labeling Market, consider subscribing to industry newsletters, following relevant companies and organizations, or regularly checking reputable industry news sources and publications.
Methodology
Step 1 - Identification of Relevant Samples Size from Population Database


Step 2 - Approaches for Defining Global Market Size (Value, Volume* & Price*)

Note*: In applicable scenarios
Step 3 - Data Sources
Primary Research
- Web Analytics
- Survey Reports
- Research Institute
- Latest Research Reports
- Opinion Leaders
Secondary Research
- Annual Reports
- White Paper
- Latest Press Release
- Industry Association
- Paid Database
- Investor Presentations

Step 4 - Data Triangulation
Involves using different sources of information in order to increase the validity of a study
These sources are likely to be stakeholders in a program - participants, other researchers, program staff, other community members, and so on.
Then we put all data in single framework & apply various statistical tools to find out the dynamic on the market.
During the analysis stage, feedback from the stakeholder groups would be compared to determine areas of agreement as well as areas of divergence