
Key Insights
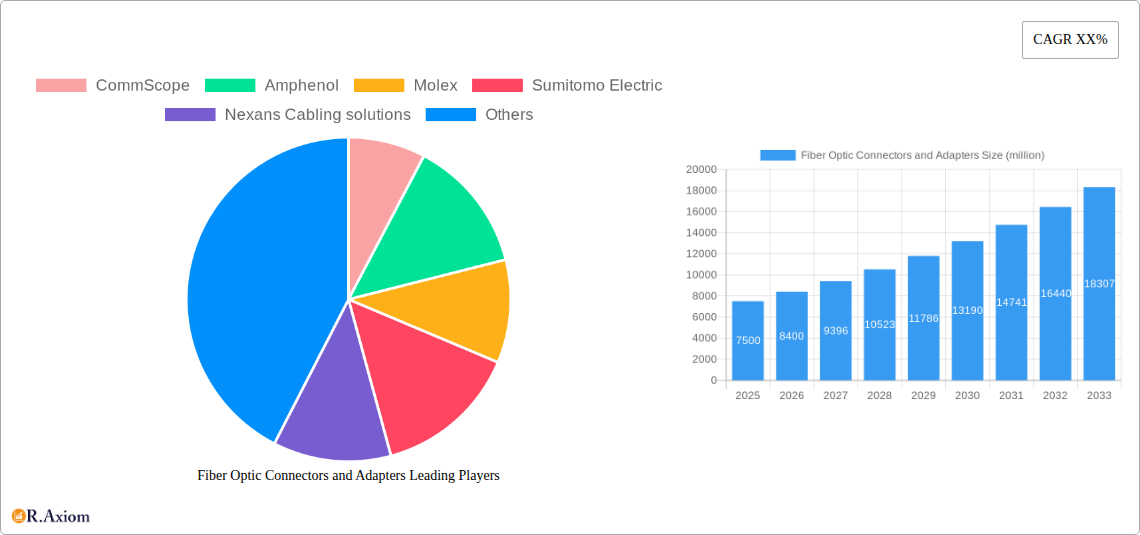
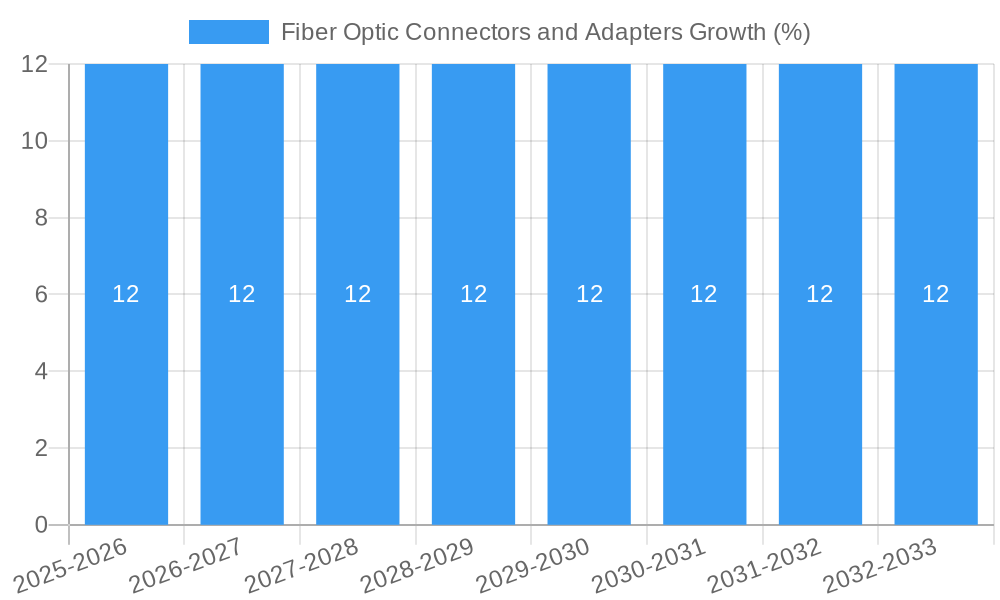
The global Fiber Optic Connectors and Adapters market is poised for significant expansion, projected to reach an estimated market size of $7,500 million by 2025. This growth is underpinned by a robust Compound Annual Growth Rate (CAGR) of 12% projected throughout the forecast period of 2025-2033. The increasing demand for higher bandwidth and faster data transmission, driven by the proliferation of 5G networks, cloud computing, and the Internet of Things (IoT), are the primary catalysts for this surge. Furthermore, the continuous advancements in telecommunications infrastructure, coupled with the growing adoption of fiber-to-the-home (FTTH) initiatives by governments worldwide to enhance digital connectivity, are fueling market expansion. Emerging applications in data centers, healthcare, and automotive industries, where reliable and high-speed data transfer is paramount, are also contributing to the positive market trajectory. The market is segmented into various applications including Residential, Commercial, Public, and Others, with Residential and Commercial sectors expected to witness substantial growth due to ongoing network upgrades and new deployments.
Despite the optimistic outlook, certain factors could temper the market's ascent. High manufacturing costs associated with advanced fiber optic connectors and adapters, coupled with the technical expertise required for installation and maintenance, may present challenges, particularly in developing economies. The availability of alternative connectivity solutions, though less performant, could also pose a competitive threat in specific niche applications. However, the inherent superiority of fiber optics in terms of speed, bandwidth, and signal integrity in long-distance and high-capacity deployments ensures its continued dominance. Key players like CommScope, Amphenol, Molex, Sumitomo Electric, and Corning are actively engaged in research and development to innovate and introduce cost-effective, high-performance solutions, further solidifying the market's growth potential. The market is characterized by intense competition, driving innovation and strategic partnerships to capture market share across diverse regional landscapes, with Asia Pacific expected to lead in terms of growth due to rapid infrastructure development.
Fiber Optic Connectors and Adapters Market Concentration & Innovation
The global Fiber Optic Connectors and Adapters market exhibits moderate to high concentration, with leading players like CommScope, Amphenol, Molex, Sumitomo Electric, and Corning holding significant market shares exceeding 60 million USD collectively. Innovation is a critical differentiator, driven by the increasing demand for higher bandwidth, lower signal loss, and enhanced durability in fiber optic networks. Key innovation areas include the development of advanced connector materials, miniaturized designs, and specialized connectors for harsh environments. Regulatory frameworks, primarily focused on industry standards like TIA/EIA and IEC, ensure interoperability and performance, acting as both facilitators and constraints on innovation. Product substitutes, such as coaxial cable in certain low-bandwidth applications, pose a limited threat due to the superior performance of fiber optics for high-speed data transmission. End-user trends are shifting towards increased adoption of fiber-to-the-home (FTTH) and the expansion of 5G infrastructure, creating a robust demand for reliable and high-performance connectors and adapters. Mergers and acquisitions (M&A) have played a role in consolidating market share, with an estimated aggregate deal value in the tens of millions USD over the historical period.
- Key Innovation Drivers:
- Demand for higher bandwidth and faster data speeds.
- Miniaturization for dense cabling solutions.
- Development of ruggedized connectors for industrial and outdoor applications.
- Improvements in insertion loss and return loss performance.
- M&A Impact: Strategic acquisitions aimed at expanding product portfolios and geographic reach, contributing to market consolidation and driving innovation through shared R&D.
Fiber Optic Connectors and Adapters Industry Trends & Insights
The Fiber Optic Connectors and Adapters industry is poised for substantial growth, driven by a confluence of technological advancements, escalating data consumption, and critical infrastructure development across residential, commercial, and public sectors. The projected Compound Annual Growth Rate (CAGR) for the forecast period (2025-2033) is estimated to be between 8% and 12%, reflecting a robust market penetration across diverse applications. The increasing adoption of high-speed internet services, necessitated by remote work trends, online education, and the proliferation of digital content, directly fuels the demand for advanced fiber optic cabling and, consequently, connectors and adapters. Furthermore, the global rollout of 5G networks represents a significant growth catalyst. The denser infrastructure required for 5G necessitates a higher density of fiber optic connections, boosting the market for compact and high-performance connectors like LC and other miniaturized types.
Technological disruptions are continuously reshaping the market. Innovations in materials science are leading to the development of more robust, environmentally resistant, and cost-effective connector solutions. Furthermore, advancements in manufacturing processes are enabling higher precision and scalability, allowing manufacturers to meet the growing demand without compromising quality. The integration of smart technologies and IoT devices also contributes to market expansion, as these devices often rely on high-speed, low-latency connectivity offered by fiber optics.
Consumer preferences are increasingly aligned with reliable, high-performance, and future-proof connectivity solutions. This trend is particularly evident in the residential segment, where consumers expect seamless streaming, online gaming, and high-definition video conferencing. In the commercial sector, businesses are investing heavily in robust data center infrastructure and enterprise networks to support cloud computing, big data analytics, and advanced operational technologies. The public sector's investment in smart city initiatives, public safety communications, and broadband expansion further solidifies the market's upward trajectory.
Competitive dynamics are characterized by a mix of established global players and emerging regional manufacturers. Companies like CommScope, Amphenol, Molex, Sumitomo Electric, and Corning are at the forefront, leveraging their extensive R&D capabilities and established distribution networks. The market penetration for fiber optic connectors and adapters is projected to reach over 75% in developed regions by the end of the forecast period, with emerging economies showing significant growth potential. The competitive landscape is also shaped by strategic partnerships and collaborations aimed at developing integrated solutions and expanding market reach. The total market size is projected to exceed 15,000 million USD by 2033.
Dominant Markets & Segments in Fiber Optic Connectors and Adapters
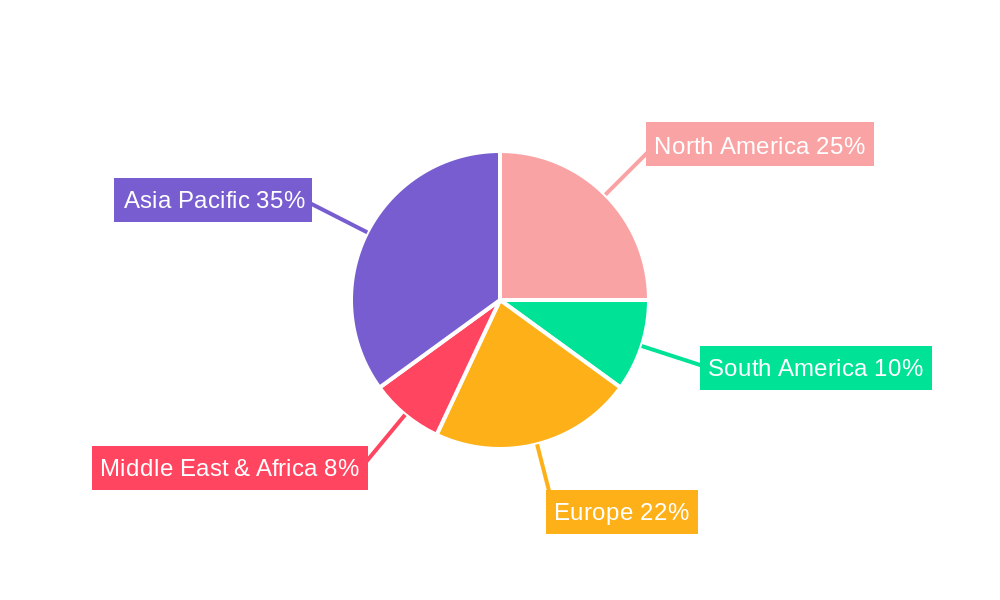
The Fiber Optic Connectors and Adapters market demonstrates clear dominance across specific regions and application segments, driven by robust infrastructure development and a surge in data-intensive applications. North America, particularly the United States and Canada, along with Europe, including Germany, the UK, and France, are currently the leading markets. This dominance is attributed to well-established telecommunication infrastructures, significant investments in broadband expansion initiatives, and a high concentration of commercial enterprises and data centers. Economic policies supporting digital transformation and government initiatives promoting fiber optic deployment have been instrumental in driving market penetration in these regions.
The Commercial application segment stands out as the largest and most influential within the market. This is primarily due to the extensive network infrastructure required by data centers, enterprise offices, and telecommunication providers. The continuous growth of cloud computing, big data analytics, and the increasing demand for high-speed enterprise networking necessitate a vast number of reliable fiber optic connections. The commercial sector's investment in upgrading existing networks and deploying new high-bandwidth solutions ensures sustained demand for various types of connectors and adapters.
Within the Types segmentation, the SC Type and LC Type connectors are experiencing the highest demand. The LC Type, with its small form factor, is particularly dominant in high-density applications such as data centers and telecommunication equipment rooms, where space optimization is critical. The SC Type remains a popular choice for its ease of use and established reliability in broader network deployments. The Other types segment, encompassing newer innovations and specialized connectors, is also witnessing significant growth as the industry pushes for higher performance and specific functionalities.
- Key Drivers for Dominance:
- Economic Policies: Government incentives for broadband deployment, digital infrastructure investment.
- Infrastructure Development: Extensive existing fiber optic networks, ongoing upgrades and expansion.
- Technological Adoption: High adoption rates of data-intensive applications in enterprises and by consumers.
- 5G Rollout: The increasing demand for high-density, high-performance connectivity to support 5G infrastructure.
- Regional Dominance Details:
- North America: Fueled by significant investments in FTTH projects and enterprise network modernization. Estimated market share in this region exceeds 3,000 million USD.
- Europe: Driven by strong government initiatives for digital connectivity and a mature telecommunications market. Estimated market share in this region exceeds 2,800 million USD.
- Application Dominance Details:
- Commercial: Represents over 40% of the total market revenue, driven by data center expansion and enterprise network upgrades. Estimated market size for commercial applications alone exceeds 6,000 million USD.
- Residential: Growing significantly with the expansion of FTTH, showing a CAGR of approximately 10%. Estimated market size for residential applications exceeds 4,000 million USD.
- Type Dominance Details:
- LC Type: Dominant in data centers and high-density applications, accounting for over 35% of connector sales.
- SC Type: Widely adopted in enterprise and carrier networks, representing over 30% of connector sales.
Fiber Optic Connectors and Adapters Product Developments
Product developments in the Fiber Optic Connectors and Adapters market are intensely focused on enhancing performance metrics, improving ease of use, and addressing specialized environmental demands. Innovations include the introduction of connectors with ultra-low insertion loss (ULIL) and high return loss, crucial for high-speed data transmission in data centers and telecommunications. Miniaturization remains a key trend, leading to the development of compact connectors that enable higher port density. Furthermore, ruggedized and hermetically sealed connectors are being developed for harsh industrial, outdoor, and aerospace applications, offering enhanced durability and resistance to environmental factors. These developments aim to provide competitive advantages by offering solutions that meet the evolving, stringent requirements of modern network infrastructure.
Report Scope & Segmentation Analysis
This report offers a comprehensive analysis of the global Fiber Optic Connectors and Adapters market, segmented across key applications and connector types. The analysis covers the Application segments: Residential, Commercial, Public, and Other. The Residential segment, driven by FTTH deployments, is projected to witness a market size of over 4,000 million USD by 2033, with a steady CAGR. The Commercial segment, encompassing data centers and enterprise networks, is expected to lead the market, surpassing 6,000 million USD by 2033, fueled by the demand for high-bandwidth solutions. The Public segment, including government and municipal infrastructure, shows robust growth potential, driven by smart city initiatives. The Other application segment includes specialized industrial and military uses, contributing a smaller but growing portion to the market.
The market is further segmented by Types: SC Type, FC Type, LC Type, and Others. The LC Type is expected to dominate due to its small form factor, crucial for high-density deployments, with an estimated market share exceeding 35%. The SC Type remains a significant segment, valued for its widespread adoption and reliability, accounting for over 30% of market share. The FC Type, though less prevalent than SC and LC, finds applications in specific environments requiring high-precision alignment. The Others category encompasses emerging and specialized connectors designed for niche applications and future technological advancements, showing significant growth potential.
Key Drivers of Fiber Optic Connectors and Adapters Growth
The growth of the Fiber Optic Connectors and Adapters market is propelled by several interconnected factors. The relentless expansion of global internet usage and the ever-increasing demand for higher bandwidth services, driven by streaming, cloud computing, and the Internet of Things (IoT), necessitate advanced fiber optic infrastructure. The ongoing global rollout of 5G mobile networks represents a significant catalyst, requiring denser and more sophisticated fiber optic connectivity. Furthermore, government initiatives worldwide focused on expanding broadband access and digital infrastructure, particularly in underserved areas, are creating substantial market opportunities. Investments in data center infrastructure, driven by the surge in digital data generation and processing, also significantly contribute to market growth.
- Technological Advancements: Development of higher performance, more compact, and durable connectors.
- Economic Factors: Increased disposable income leading to higher demand for high-speed internet services and digital entertainment.
- Regulatory Push: Government mandates and subsidies for broadband deployment and digital transformation.
- Industry Demand: Expansion of data centers, enterprises, and telecommunications networks.
Challenges in the Fiber Optic Connectors and Adapters Sector
Despite the robust growth, the Fiber Optic Connectors and Adapters sector faces several challenges. High initial installation costs for fiber optic networks can be a deterrent, particularly in certain emerging markets. Intense competition among manufacturers leads to price pressures, impacting profit margins, especially for commoditized connector types. The complexity of installation and the need for skilled labor can also pose a challenge, particularly in large-scale deployments. Supply chain disruptions, including raw material availability and logistical issues, can impact production and delivery timelines. Furthermore, the rapid pace of technological evolution necessitates continuous R&D investment to stay competitive, which can be a burden for smaller players.
- High Initial Deployment Costs: Significant capital investment required for widespread fiber optic network implementation.
- Intense Price Competition: Pressure on margins due to a large number of manufacturers and commoditization of standard connectors.
- Skilled Labor Requirements: Need for trained technicians for installation and maintenance.
- Supply Chain Volatility: Potential disruptions in raw material sourcing and global logistics.
Emerging Opportunities in Fiber Optic Connectors and Adapters
Emerging opportunities in the Fiber Optic Connectors and Adapters market are ripe for exploration. The expanding deployment of Wi-Fi 6E and Wi-Fi 7, which leverage higher frequencies and require more robust backhaul, presents a significant opportunity for high-speed fiber connectivity. The growth of edge computing infrastructure, distributing data processing closer to the source, will drive demand for compact and efficient fiber optic solutions in localized environments. The increasing adoption of fiber optics in industrial automation, smart manufacturing, and automotive applications, where high reliability and low latency are paramount, opens new market avenues. Furthermore, the development of advanced optical materials and manufacturing techniques, such as additive manufacturing, could lead to novel connector designs and cost reductions, unlocking further market potential.
- Wi-Fi 6E/7 Backhaul: Increased demand for fiber optic connectivity to support next-generation wireless standards.
- Edge Computing Deployments: Need for localized, high-performance fiber optic solutions.
- Industrial and Automotive Applications: Growing adoption in sectors requiring high reliability and precision.
Leading Players in the Fiber Optic Connectors and Adapters Market
- CommScope
- Amphenol
- Molex
- Sumitomo Electric
- Nexans Cabling Solutions
- Radiall
- 3M
- JAE
- HUBER + SUHNER
- Corning
- Yazaki
- Senko
- Rosenberger-OSI
- Delphi
- AFL
- LEMO
- Hirose
- FIT
Key Developments in Fiber Optic Connectors and Adapters Industry
- 2023/2024: Launch of ultra-low insertion loss (ULIL) connectors to meet the demands of hyperscale data centers and high-speed networking.
- 2022/2023: Increased investment in M&A activities by major players to expand product portfolios and geographical reach.
- 2022: Introduction of enhanced ruggedized connector solutions for demanding industrial and outdoor environments.
- 2021/2022: Significant product development focused on miniaturization of connectors to enable higher port density in network equipment.
- 2020/2021: Growing emphasis on sustainable manufacturing practices and recyclable materials in connector production.
Strategic Outlook for Fiber Optic Connectors and Adapters Market
The strategic outlook for the Fiber Optic Connectors and Adapters market is exceptionally positive, driven by an insatiable global demand for high-speed data transmission and the continuous evolution of digital infrastructure. The sustained growth in broadband adoption, coupled with the transformative impact of 5G and the burgeoning Internet of Things (IoT), ensures a consistent and expanding market for reliable fiber optic connectivity solutions. Strategic focus on innovation in areas such as miniaturization, enhanced durability, and superior optical performance will be crucial for market leaders. Furthermore, companies that can effectively navigate evolving regulatory landscapes and capitalize on emerging market opportunities, such as edge computing and industrial automation, are well-positioned for long-term success. Strategic partnerships and a commitment to cost-effective, high-quality manufacturing will continue to define the competitive edge in this dynamic sector, promising significant growth potential throughout the forecast period.
Fiber Optic Connectors and Adapters Segmentation
-
1. Application
- 1.1. Residential
- 1.2. Commercial
- 1.3. Public
- 1.4. Other
-
2. Types
- 2.1. SC Type
- 2.2. FC Type
- 2.3. LC Type
- 2.4. Others
Fiber Optic Connectors and Adapters Segmentation By Geography
-
1. North America
- 1.1. United States
- 1.2. Canada
- 1.3. Mexico
-
2. South America
- 2.1. Brazil
- 2.2. Argentina
- 2.3. Rest of South America
-
3. Europe
- 3.1. United Kingdom
- 3.2. Germany
- 3.3. France
- 3.4. Italy
- 3.5. Spain
- 3.6. Russia
- 3.7. Benelux
- 3.8. Nordics
- 3.9. Rest of Europe
-
4. Middle East & Africa
- 4.1. Turkey
- 4.2. Israel
- 4.3. GCC
- 4.4. North Africa
- 4.5. South Africa
- 4.6. Rest of Middle East & Africa
-
5. Asia Pacific
- 5.1. China
- 5.2. India
- 5.3. Japan
- 5.4. South Korea
- 5.5. ASEAN
- 5.6. Oceania
- 5.7. Rest of Asia Pacific
Fiber Optic Connectors and Adapters REPORT HIGHLIGHTS
| Aspects | Details |
|---|---|
| Study Period | 2019-2033 |
| Base Year | 2024 |
| Estimated Year | 2025 |
| Forecast Period | 2025-2033 |
| Historical Period | 2019-2024 |
| Growth Rate | CAGR of XX% from 2019-2033 |
| Segmentation |
|
Table of Contents
- 1. Introduction
- 1.1. Research Scope
- 1.2. Market Segmentation
- 1.3. Research Methodology
- 1.4. Definitions and Assumptions
- 2. Executive Summary
- 2.1. Introduction
- 3. Market Dynamics
- 3.1. Introduction
- 3.2. Market Drivers
- 3.3. Market Restrains
- 3.4. Market Trends
- 4. Market Factor Analysis
- 4.1. Porters Five Forces
- 4.2. Supply/Value Chain
- 4.3. PESTEL analysis
- 4.4. Market Entropy
- 4.5. Patent/Trademark Analysis
- 5. Global Fiber Optic Connectors and Adapters Analysis, Insights and Forecast, 2019-2031
- 5.1. Market Analysis, Insights and Forecast - by Application
- 5.1.1. Residential
- 5.1.2. Commercial
- 5.1.3. Public
- 5.1.4. Other
- 5.2. Market Analysis, Insights and Forecast - by Types
- 5.2.1. SC Type
- 5.2.2. FC Type
- 5.2.3. LC Type
- 5.2.4. Others
- 5.3. Market Analysis, Insights and Forecast - by Region
- 5.3.1. North America
- 5.3.2. South America
- 5.3.3. Europe
- 5.3.4. Middle East & Africa
- 5.3.5. Asia Pacific
- 5.1. Market Analysis, Insights and Forecast - by Application
- 6. North America Fiber Optic Connectors and Adapters Analysis, Insights and Forecast, 2019-2031
- 6.1. Market Analysis, Insights and Forecast - by Application
- 6.1.1. Residential
- 6.1.2. Commercial
- 6.1.3. Public
- 6.1.4. Other
- 6.2. Market Analysis, Insights and Forecast - by Types
- 6.2.1. SC Type
- 6.2.2. FC Type
- 6.2.3. LC Type
- 6.2.4. Others
- 6.1. Market Analysis, Insights and Forecast - by Application
- 7. South America Fiber Optic Connectors and Adapters Analysis, Insights and Forecast, 2019-2031
- 7.1. Market Analysis, Insights and Forecast - by Application
- 7.1.1. Residential
- 7.1.2. Commercial
- 7.1.3. Public
- 7.1.4. Other
- 7.2. Market Analysis, Insights and Forecast - by Types
- 7.2.1. SC Type
- 7.2.2. FC Type
- 7.2.3. LC Type
- 7.2.4. Others
- 7.1. Market Analysis, Insights and Forecast - by Application
- 8. Europe Fiber Optic Connectors and Adapters Analysis, Insights and Forecast, 2019-2031
- 8.1. Market Analysis, Insights and Forecast - by Application
- 8.1.1. Residential
- 8.1.2. Commercial
- 8.1.3. Public
- 8.1.4. Other
- 8.2. Market Analysis, Insights and Forecast - by Types
- 8.2.1. SC Type
- 8.2.2. FC Type
- 8.2.3. LC Type
- 8.2.4. Others
- 8.1. Market Analysis, Insights and Forecast - by Application
- 9. Middle East & Africa Fiber Optic Connectors and Adapters Analysis, Insights and Forecast, 2019-2031
- 9.1. Market Analysis, Insights and Forecast - by Application
- 9.1.1. Residential
- 9.1.2. Commercial
- 9.1.3. Public
- 9.1.4. Other
- 9.2. Market Analysis, Insights and Forecast - by Types
- 9.2.1. SC Type
- 9.2.2. FC Type
- 9.2.3. LC Type
- 9.2.4. Others
- 9.1. Market Analysis, Insights and Forecast - by Application
- 10. Asia Pacific Fiber Optic Connectors and Adapters Analysis, Insights and Forecast, 2019-2031
- 10.1. Market Analysis, Insights and Forecast - by Application
- 10.1.1. Residential
- 10.1.2. Commercial
- 10.1.3. Public
- 10.1.4. Other
- 10.2. Market Analysis, Insights and Forecast - by Types
- 10.2.1. SC Type
- 10.2.2. FC Type
- 10.2.3. LC Type
- 10.2.4. Others
- 10.1. Market Analysis, Insights and Forecast - by Application
- 11. Competitive Analysis
- 11.1. Global Market Share Analysis 2024
- 11.2. Company Profiles
- 11.2.1 CommScope
- 11.2.1.1. Overview
- 11.2.1.2. Products
- 11.2.1.3. SWOT Analysis
- 11.2.1.4. Recent Developments
- 11.2.1.5. Financials (Based on Availability)
- 11.2.2 Amphenol
- 11.2.2.1. Overview
- 11.2.2.2. Products
- 11.2.2.3. SWOT Analysis
- 11.2.2.4. Recent Developments
- 11.2.2.5. Financials (Based on Availability)
- 11.2.3 Molex
- 11.2.3.1. Overview
- 11.2.3.2. Products
- 11.2.3.3. SWOT Analysis
- 11.2.3.4. Recent Developments
- 11.2.3.5. Financials (Based on Availability)
- 11.2.4 Sumitomo Electric
- 11.2.4.1. Overview
- 11.2.4.2. Products
- 11.2.4.3. SWOT Analysis
- 11.2.4.4. Recent Developments
- 11.2.4.5. Financials (Based on Availability)
- 11.2.5 Nexans Cabling solutions
- 11.2.5.1. Overview
- 11.2.5.2. Products
- 11.2.5.3. SWOT Analysis
- 11.2.5.4. Recent Developments
- 11.2.5.5. Financials (Based on Availability)
- 11.2.6 Radiall
- 11.2.6.1. Overview
- 11.2.6.2. Products
- 11.2.6.3. SWOT Analysis
- 11.2.6.4. Recent Developments
- 11.2.6.5. Financials (Based on Availability)
- 11.2.7 3M
- 11.2.7.1. Overview
- 11.2.7.2. Products
- 11.2.7.3. SWOT Analysis
- 11.2.7.4. Recent Developments
- 11.2.7.5. Financials (Based on Availability)
- 11.2.8 JAE
- 11.2.8.1. Overview
- 11.2.8.2. Products
- 11.2.8.3. SWOT Analysis
- 11.2.8.4. Recent Developments
- 11.2.8.5. Financials (Based on Availability)
- 11.2.9 HUBER + SUHNER
- 11.2.9.1. Overview
- 11.2.9.2. Products
- 11.2.9.3. SWOT Analysis
- 11.2.9.4. Recent Developments
- 11.2.9.5. Financials (Based on Availability)
- 11.2.10 Corning
- 11.2.10.1. Overview
- 11.2.10.2. Products
- 11.2.10.3. SWOT Analysis
- 11.2.10.4. Recent Developments
- 11.2.10.5. Financials (Based on Availability)
- 11.2.11 Yazaki
- 11.2.11.1. Overview
- 11.2.11.2. Products
- 11.2.11.3. SWOT Analysis
- 11.2.11.4. Recent Developments
- 11.2.11.5. Financials (Based on Availability)
- 11.2.12 Senko
- 11.2.12.1. Overview
- 11.2.12.2. Products
- 11.2.12.3. SWOT Analysis
- 11.2.12.4. Recent Developments
- 11.2.12.5. Financials (Based on Availability)
- 11.2.13 Rosenberger-OSI
- 11.2.13.1. Overview
- 11.2.13.2. Products
- 11.2.13.3. SWOT Analysis
- 11.2.13.4. Recent Developments
- 11.2.13.5. Financials (Based on Availability)
- 11.2.14 Delphi
- 11.2.14.1. Overview
- 11.2.14.2. Products
- 11.2.14.3. SWOT Analysis
- 11.2.14.4. Recent Developments
- 11.2.14.5. Financials (Based on Availability)
- 11.2.15 AFL
- 11.2.15.1. Overview
- 11.2.15.2. Products
- 11.2.15.3. SWOT Analysis
- 11.2.15.4. Recent Developments
- 11.2.15.5. Financials (Based on Availability)
- 11.2.16 LEMO
- 11.2.16.1. Overview
- 11.2.16.2. Products
- 11.2.16.3. SWOT Analysis
- 11.2.16.4. Recent Developments
- 11.2.16.5. Financials (Based on Availability)
- 11.2.17 Hirose
- 11.2.17.1. Overview
- 11.2.17.2. Products
- 11.2.17.3. SWOT Analysis
- 11.2.17.4. Recent Developments
- 11.2.17.5. Financials (Based on Availability)
- 11.2.18 FIT
- 11.2.18.1. Overview
- 11.2.18.2. Products
- 11.2.18.3. SWOT Analysis
- 11.2.18.4. Recent Developments
- 11.2.18.5. Financials (Based on Availability)
- 11.2.1 CommScope
List of Figures
- Figure 1: Global Fiber Optic Connectors and Adapters Revenue Breakdown (million, %) by Region 2024 & 2032
- Figure 2: North America Fiber Optic Connectors and Adapters Revenue (million), by Application 2024 & 2032
- Figure 3: North America Fiber Optic Connectors and Adapters Revenue Share (%), by Application 2024 & 2032
- Figure 4: North America Fiber Optic Connectors and Adapters Revenue (million), by Types 2024 & 2032
- Figure 5: North America Fiber Optic Connectors and Adapters Revenue Share (%), by Types 2024 & 2032
- Figure 6: North America Fiber Optic Connectors and Adapters Revenue (million), by Country 2024 & 2032
- Figure 7: North America Fiber Optic Connectors and Adapters Revenue Share (%), by Country 2024 & 2032
- Figure 8: South America Fiber Optic Connectors and Adapters Revenue (million), by Application 2024 & 2032
- Figure 9: South America Fiber Optic Connectors and Adapters Revenue Share (%), by Application 2024 & 2032
- Figure 10: South America Fiber Optic Connectors and Adapters Revenue (million), by Types 2024 & 2032
- Figure 11: South America Fiber Optic Connectors and Adapters Revenue Share (%), by Types 2024 & 2032
- Figure 12: South America Fiber Optic Connectors and Adapters Revenue (million), by Country 2024 & 2032
- Figure 13: South America Fiber Optic Connectors and Adapters Revenue Share (%), by Country 2024 & 2032
- Figure 14: Europe Fiber Optic Connectors and Adapters Revenue (million), by Application 2024 & 2032
- Figure 15: Europe Fiber Optic Connectors and Adapters Revenue Share (%), by Application 2024 & 2032
- Figure 16: Europe Fiber Optic Connectors and Adapters Revenue (million), by Types 2024 & 2032
- Figure 17: Europe Fiber Optic Connectors and Adapters Revenue Share (%), by Types 2024 & 2032
- Figure 18: Europe Fiber Optic Connectors and Adapters Revenue (million), by Country 2024 & 2032
- Figure 19: Europe Fiber Optic Connectors and Adapters Revenue Share (%), by Country 2024 & 2032
- Figure 20: Middle East & Africa Fiber Optic Connectors and Adapters Revenue (million), by Application 2024 & 2032
- Figure 21: Middle East & Africa Fiber Optic Connectors and Adapters Revenue Share (%), by Application 2024 & 2032
- Figure 22: Middle East & Africa Fiber Optic Connectors and Adapters Revenue (million), by Types 2024 & 2032
- Figure 23: Middle East & Africa Fiber Optic Connectors and Adapters Revenue Share (%), by Types 2024 & 2032
- Figure 24: Middle East & Africa Fiber Optic Connectors and Adapters Revenue (million), by Country 2024 & 2032
- Figure 25: Middle East & Africa Fiber Optic Connectors and Adapters Revenue Share (%), by Country 2024 & 2032
- Figure 26: Asia Pacific Fiber Optic Connectors and Adapters Revenue (million), by Application 2024 & 2032
- Figure 27: Asia Pacific Fiber Optic Connectors and Adapters Revenue Share (%), by Application 2024 & 2032
- Figure 28: Asia Pacific Fiber Optic Connectors and Adapters Revenue (million), by Types 2024 & 2032
- Figure 29: Asia Pacific Fiber Optic Connectors and Adapters Revenue Share (%), by Types 2024 & 2032
- Figure 30: Asia Pacific Fiber Optic Connectors and Adapters Revenue (million), by Country 2024 & 2032
- Figure 31: Asia Pacific Fiber Optic Connectors and Adapters Revenue Share (%), by Country 2024 & 2032
List of Tables
- Table 1: Global Fiber Optic Connectors and Adapters Revenue million Forecast, by Region 2019 & 2032
- Table 2: Global Fiber Optic Connectors and Adapters Revenue million Forecast, by Application 2019 & 2032
- Table 3: Global Fiber Optic Connectors and Adapters Revenue million Forecast, by Types 2019 & 2032
- Table 4: Global Fiber Optic Connectors and Adapters Revenue million Forecast, by Region 2019 & 2032
- Table 5: Global Fiber Optic Connectors and Adapters Revenue million Forecast, by Application 2019 & 2032
- Table 6: Global Fiber Optic Connectors and Adapters Revenue million Forecast, by Types 2019 & 2032
- Table 7: Global Fiber Optic Connectors and Adapters Revenue million Forecast, by Country 2019 & 2032
- Table 8: United States Fiber Optic Connectors and Adapters Revenue (million) Forecast, by Application 2019 & 2032
- Table 9: Canada Fiber Optic Connectors and Adapters Revenue (million) Forecast, by Application 2019 & 2032
- Table 10: Mexico Fiber Optic Connectors and Adapters Revenue (million) Forecast, by Application 2019 & 2032
- Table 11: Global Fiber Optic Connectors and Adapters Revenue million Forecast, by Application 2019 & 2032
- Table 12: Global Fiber Optic Connectors and Adapters Revenue million Forecast, by Types 2019 & 2032
- Table 13: Global Fiber Optic Connectors and Adapters Revenue million Forecast, by Country 2019 & 2032
- Table 14: Brazil Fiber Optic Connectors and Adapters Revenue (million) Forecast, by Application 2019 & 2032
- Table 15: Argentina Fiber Optic Connectors and Adapters Revenue (million) Forecast, by Application 2019 & 2032
- Table 16: Rest of South America Fiber Optic Connectors and Adapters Revenue (million) Forecast, by Application 2019 & 2032
- Table 17: Global Fiber Optic Connectors and Adapters Revenue million Forecast, by Application 2019 & 2032
- Table 18: Global Fiber Optic Connectors and Adapters Revenue million Forecast, by Types 2019 & 2032
- Table 19: Global Fiber Optic Connectors and Adapters Revenue million Forecast, by Country 2019 & 2032
- Table 20: United Kingdom Fiber Optic Connectors and Adapters Revenue (million) Forecast, by Application 2019 & 2032
- Table 21: Germany Fiber Optic Connectors and Adapters Revenue (million) Forecast, by Application 2019 & 2032
- Table 22: France Fiber Optic Connectors and Adapters Revenue (million) Forecast, by Application 2019 & 2032
- Table 23: Italy Fiber Optic Connectors and Adapters Revenue (million) Forecast, by Application 2019 & 2032
- Table 24: Spain Fiber Optic Connectors and Adapters Revenue (million) Forecast, by Application 2019 & 2032
- Table 25: Russia Fiber Optic Connectors and Adapters Revenue (million) Forecast, by Application 2019 & 2032
- Table 26: Benelux Fiber Optic Connectors and Adapters Revenue (million) Forecast, by Application 2019 & 2032
- Table 27: Nordics Fiber Optic Connectors and Adapters Revenue (million) Forecast, by Application 2019 & 2032
- Table 28: Rest of Europe Fiber Optic Connectors and Adapters Revenue (million) Forecast, by Application 2019 & 2032
- Table 29: Global Fiber Optic Connectors and Adapters Revenue million Forecast, by Application 2019 & 2032
- Table 30: Global Fiber Optic Connectors and Adapters Revenue million Forecast, by Types 2019 & 2032
- Table 31: Global Fiber Optic Connectors and Adapters Revenue million Forecast, by Country 2019 & 2032
- Table 32: Turkey Fiber Optic Connectors and Adapters Revenue (million) Forecast, by Application 2019 & 2032
- Table 33: Israel Fiber Optic Connectors and Adapters Revenue (million) Forecast, by Application 2019 & 2032
- Table 34: GCC Fiber Optic Connectors and Adapters Revenue (million) Forecast, by Application 2019 & 2032
- Table 35: North Africa Fiber Optic Connectors and Adapters Revenue (million) Forecast, by Application 2019 & 2032
- Table 36: South Africa Fiber Optic Connectors and Adapters Revenue (million) Forecast, by Application 2019 & 2032
- Table 37: Rest of Middle East & Africa Fiber Optic Connectors and Adapters Revenue (million) Forecast, by Application 2019 & 2032
- Table 38: Global Fiber Optic Connectors and Adapters Revenue million Forecast, by Application 2019 & 2032
- Table 39: Global Fiber Optic Connectors and Adapters Revenue million Forecast, by Types 2019 & 2032
- Table 40: Global Fiber Optic Connectors and Adapters Revenue million Forecast, by Country 2019 & 2032
- Table 41: China Fiber Optic Connectors and Adapters Revenue (million) Forecast, by Application 2019 & 2032
- Table 42: India Fiber Optic Connectors and Adapters Revenue (million) Forecast, by Application 2019 & 2032
- Table 43: Japan Fiber Optic Connectors and Adapters Revenue (million) Forecast, by Application 2019 & 2032
- Table 44: South Korea Fiber Optic Connectors and Adapters Revenue (million) Forecast, by Application 2019 & 2032
- Table 45: ASEAN Fiber Optic Connectors and Adapters Revenue (million) Forecast, by Application 2019 & 2032
- Table 46: Oceania Fiber Optic Connectors and Adapters Revenue (million) Forecast, by Application 2019 & 2032
- Table 47: Rest of Asia Pacific Fiber Optic Connectors and Adapters Revenue (million) Forecast, by Application 2019 & 2032
Frequently Asked Questions
1. What is the projected Compound Annual Growth Rate (CAGR) of the Fiber Optic Connectors and Adapters?
The projected CAGR is approximately XX%.
2. Which companies are prominent players in the Fiber Optic Connectors and Adapters?
Key companies in the market include CommScope, Amphenol, Molex, Sumitomo Electric, Nexans Cabling solutions, Radiall, 3M, JAE, HUBER + SUHNER, Corning, Yazaki, Senko, Rosenberger-OSI, Delphi, AFL, LEMO, Hirose, FIT.
3. What are the main segments of the Fiber Optic Connectors and Adapters?
The market segments include Application, Types.
4. Can you provide details about the market size?
The market size is estimated to be USD XXX million as of 2022.
5. What are some drivers contributing to market growth?
N/A
6. What are the notable trends driving market growth?
N/A
7. Are there any restraints impacting market growth?
N/A
8. Can you provide examples of recent developments in the market?
N/A
9. What pricing options are available for accessing the report?
Pricing options include single-user, multi-user, and enterprise licenses priced at USD 2900.00, USD 4350.00, and USD 5800.00 respectively.
10. Is the market size provided in terms of value or volume?
The market size is provided in terms of value, measured in million.
11. Are there any specific market keywords associated with the report?
Yes, the market keyword associated with the report is "Fiber Optic Connectors and Adapters," which aids in identifying and referencing the specific market segment covered.
12. How do I determine which pricing option suits my needs best?
The pricing options vary based on user requirements and access needs. Individual users may opt for single-user licenses, while businesses requiring broader access may choose multi-user or enterprise licenses for cost-effective access to the report.
13. Are there any additional resources or data provided in the Fiber Optic Connectors and Adapters report?
While the report offers comprehensive insights, it's advisable to review the specific contents or supplementary materials provided to ascertain if additional resources or data are available.
14. How can I stay updated on further developments or reports in the Fiber Optic Connectors and Adapters?
To stay informed about further developments, trends, and reports in the Fiber Optic Connectors and Adapters, consider subscribing to industry newsletters, following relevant companies and organizations, or regularly checking reputable industry news sources and publications.
Methodology
Step 1 - Identification of Relevant Samples Size from Population Database


Step 2 - Approaches for Defining Global Market Size (Value, Volume* & Price*)

Note*: In applicable scenarios
Step 3 - Data Sources
Primary Research
- Web Analytics
- Survey Reports
- Research Institute
- Latest Research Reports
- Opinion Leaders
Secondary Research
- Annual Reports
- White Paper
- Latest Press Release
- Industry Association
- Paid Database
- Investor Presentations

Step 4 - Data Triangulation
Involves using different sources of information in order to increase the validity of a study
These sources are likely to be stakeholders in a program - participants, other researchers, program staff, other community members, and so on.
Then we put all data in single framework & apply various statistical tools to find out the dynamic on the market.
During the analysis stage, feedback from the stakeholder groups would be compared to determine areas of agreement as well as areas of divergence


